 Multi-family
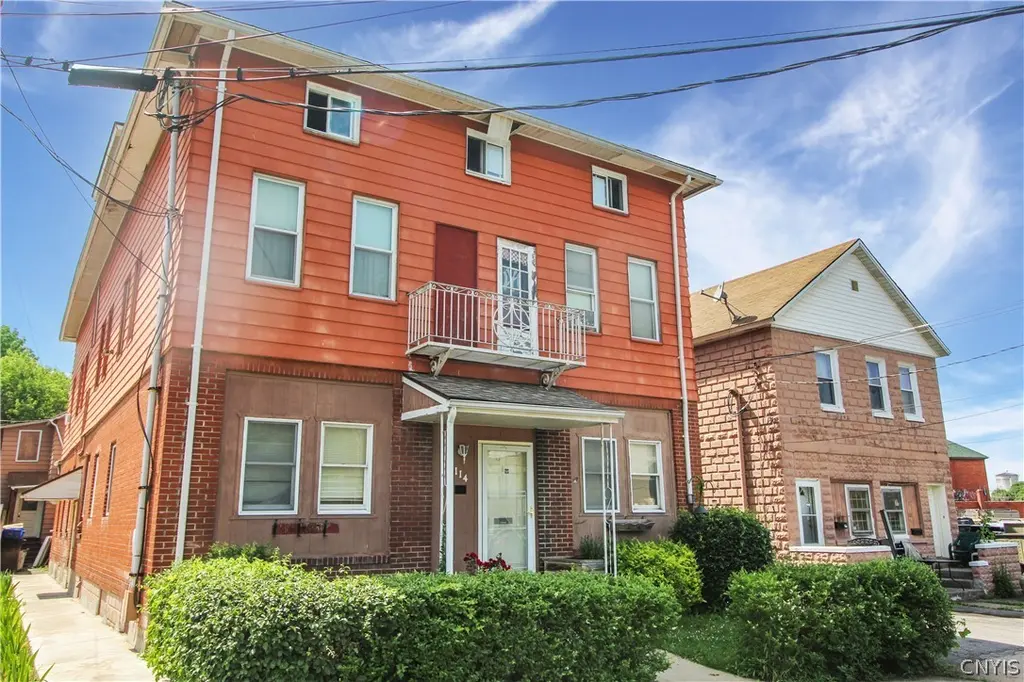
114 Freeman Ave · Solvay, NY
Flood risk 1/10 · Minimal
- FEMA flood zone
- X (unshaded)
- Chance of flooding over 30 yrs
- 0.0%
- Est. flood insurance / yr
- $473 – $860
Fire risk 1/10 · Minimal
- Est. fire insurance / yr
- $691 – $1,283
Heat risk 3/10 · Minor
- Hot days now (above 95°F)
- 7 days/yr
- Hot days in 30 yrs
- 16 days/yr
Wind risk 1/10 · Minimal
- Chance of severe wind over 30 yrs
- 0.0%
Air-quality risk 2/10 · Minimal
- Unhealthy air days now
- 0 days/yr
- Unhealthy air days in 30 yrs
- 1 days/yr
Risk factors via First Street. Map © Google.
Why this score? — see what drove the C grade
The composite is a weighted blend of 9 inputs, each scored 0–100. Each bar is that input's sub-score; the figure is the points it added to the 100-point composite (weight × sub-score).
- Cash flow +24.5/30.0
- DSCR +7.9/10.0
- ARV discount +7.5/15.0
- 1% rule +5.7/10.0
- Livability +3.6/5.0
- Schools +3.1/10.0
- Rent growth +2.5/5.0
- Condition / age +2.5/5.0
- Appreciation +0.0/10.0
$1,500,000
🖨 Deal sheet 📄 Offer letter ✓ Due diligence
Multi-family units
County records classify this as Multi-Family (5+ Unit). Listing-text estimate: 1 unit. estimate disagrees with records
5+ unit building — per-unit beds/baths from public records are typically unavailable; the breakdown below (if shown) is an estimate from the listing text.
Listing remarks MLS
Available on the market for the first time in 40 years, this rare 10-unit portfolio in the heart of the Village of Solvay offers a unique blend of stability and upside for investors. Data in this description pertains to both 114 and 112 Freeman Avenue combined. Consisting of three structures: a 7-unit apartment building, a 2-family multi, and a single-family colonial—all contiguous and sharing off-street parking. Each of the 10 units has separate utilities and a varied mix of sizes (1 one-bedroom, six two-bedroom, two three-bedroom, and one four-bedroom stand-alone home), giving you multiple leasing and marketing strategies. Current rents are below market value, translating into a potential 13% pro forma cap rate—an exceptional value-add play. Located in a tight-knit, lakeside community just minutes from downtown Syracuse, Solvay boasts scenic outdoor amenities, small-town conveniences and attractions, and the benefit of locally controlled, low-cost utilities via municipality-owned Solvay Electric. With strong fundamentals, thoughtful upkeep, and long-term appreciation potential, this property presents a rare opportunity to acquire a performing asset with plenty of room to grow. The hands-on owner of this well-maintained package has 55 years of experience owning and managing over 100 units. He has decided to move on to new projects, presenting an excellent opportunity for the new owner.
Key facts
- 10 unit portfolio
- 2 family multi
- Separate utilities
Tags
Neighborhood map
What this means for you Summary
Snapshot
- This is a 10-bed/?-bath multifamily listed at $1.50M.
Deal economics
- At list price, monthly cash flow is $3k ($37k/yr) — positive.
- The deal already cash-flows at list — no discount required.
- Meets the 1% rule at list price ($16k rent vs $1.50M).
- Recommended offer: $1.46M (3.0% below list) — sets the bar for market timing.
Location & tenants
- Location reads 72/100 on livability (#350 in NY) — a middle-class / working-renter tenant base. Strengths: housing A+, health & safety A+, cost of living A; Watch: employment D+, crime D, amenities F.
- Solvay Union Free School District (suburban): math 31% / reading 42% proficiency, ranked #550 of 590 in NY (top 93%) — families likely to look elsewhere, expect single-tenant / working-renter base with shorter leases.
- Market conditions: 59 active listings in the ZIP; 616 units permitted in Onondaga County in 2024 (256 in 5+ unit buildings).
- At $16,048/mo this rent would consume 283% of the median local household income ($68k/yr) (locally 210% of renters already pay >50% of income on rent) — very limited rent-growth headroom before tenants either downsize or default.
Forward outlook
- Local home prices are declining (-3.0%/yr); year-one equity from $10k of loan paydown is wiped out by about $45k of value loss. Plan a longer hold.
- Onondaga County population projected to shrink 9% by 2050 — rents likely to lag national; underwrite the cash flow, not the appreciation.
Negotiation context
- It's been on market 41 days — a 3% lower offer ($1.46M) is reasonable based on typical stale-listing flexibility.
- 3 sale attempts; this cycle's ask is 3% above the opening price — seller raised mid-cycle; expect resistance to lowballs.
Risks & watch-outs
- Watch-outs: built in 1910 — expect roof / HVAC / electrical / plumbing capex.
Questions for the listing agent
- It's been on market 41 days. Have you received any prior offers? Is the seller open to a 3% concession, seller financing, or rate buy-down credit?
- Built in 1910 — when were the roof, HVAC, electrical panel, plumbing, and water heater last replaced?
- Is there a deadline driving the sale (1031 exchange, divorce, estate, relocation)? That informs how much negotiation room exists.
- Schools are B-rated — typically a magnet for longer-tenancy family renters. What's the average tenant stay here, and is there a school-zone premium baked into asking?
- Crime grade is D in this area — have there been break-ins, vandalism, or insurance claims at this property in the last 3 years? What carrier currently insures it and at what premium?
- What's the average days-on-market for RENTAL listings here right now (not sales)? A rising rental-DOM trend means longer vacancies and softer asking-rent achievability than the comps imply.
- What's the recent tenant-quality profile in this submarket — average credit score on applications, eviction rate, late-payment / NSF rate, and stable-employment percentage? A property-management company in the area should have these aggregated.
- How much new apartment / multifamily construction is in the pipeline within 1–3 miles? Heavy new supply (>2% of stock underway) typically softens rents 12–24 months out; light construction supports rent growth.
Investment metrics
- 1% rule
- 1.07% ✓
- Cap rate
- 8.76%
- Cash-on-cash
- 8.81%
- DSCR
- 1.39
- GRM
- 7.8
CMA / ARV
- ARV (median comp)
- $321,693
- List price
- $1,500,000
- Delta
- 366.28%
- Verdict
- OVERPRICED
- Comps
- 2 within 2.0 mi
Projected returns pro-forma
-3.0% appreciation · 3.0% rent growth · sell at horizon
- IRR
- -3.0%
- Equity multiple
- 0.89×
- Total profit
- $-46,966
- Equity at exit
- $223,655
- IRR
- 6.7%
- Equity multiple
- 1.50×
- Total profit
- $210,969
- Equity at exit
- $129,693
Cash invested: $420,000 (down + closing). Projections, not guarantees.
Landlord ↔ Tenant lean methodology
- Overall (STATE)
- 15 Strongly Tenant-Friendly
- State New York
- 15 Strongly Tenant-Friendly · D+10
- County
- — inherits STATE
- City
- — inherits STATE
ZIP-level market 13209
- Home prices YoY
- -7.7%
- Active inventory
- 59
- Price-to-rent
- 94.3×
Monthly cashflow live
- Estimated rent
- $16,048 medium interval (Pro) →
- Mortgage (P&I)
- −$7,866
- Tax from tax record
- −$1,104 /mo · $13,250/yr
- Insurance
- −$625
- HOA
- −$0
- Vacancy / Maint / Mgmt
- −$3,370
- Net cashflow
- $3,083
Break-even live
10-unit breakdown (identical units grouped — click to expand)
| Units | Beds | Baths | Est. rent |
|---|---|---|---|
| 1× unit | 1 | 1 | $1,326 |
| 6× units | 2 | 1 | $9,282 |
| #2 | 2 | 1 | $1,547 |
| #3 | 2 | 1 | $1,547 |
| #4 | 2 | 1 | $1,547 |
| #5 | 2 | 1 | $1,547 |
| #6 | 2 | 1 | $1,547 |
| #7 | 2 | 1 | $1,547 |
| 2× units | 3 | 1 | $3,552 |
| #8 | 3 | 1 | $1,776 |
| #9 | 3 | 1 | $1,776 |
| 1× unit | 4 | 1 | $1,887 |
| Total (10 units) | $16,048 | ||
UW: 25.0% down · 7.5% · 30yr · 1.5% tax · 5.0% vac · 8.0% maint · 8.0% mgmt
Financing live
Cash to close
- Down payment
- $375,000
- Closing costs
- $45,000
- Reserves months
- —
- Total cash needed
- —
Loan-product check · same deal, 3 products live
Conventional
25% down · 7.5% · 30yr
- Down + closing
- —
- Monthly P&I
- —
- Monthly cashflow
- —
- DSCR
- —
- Eligible?
- —
Personal DTI + credit; lowest rate.
DSCR
20% down · 8.5% · 30yr
- Down + closing
- —
- Monthly P&I
- —
- Monthly cashflow
- —
- DSCR
- —
- Eligible?
- —
No personal income docs; deal must DSCR.
Hard money
10% down · 12.0% · 12mo
- Down + closing
- —
- Monthly P&I
- —
- Monthly cashflow
- —
- DSCR
- —
- Eligible?
- —
Short-term bridge; refi at stabilization.
Listing history 20 events
-
2026-06-18days on market $1,500,000 Active 41 DOM
-
2026-06-17days on market $1,500,000 Active 40 DOM
-
2026-06-16days on market $1,500,000 Active 39 DOM
-
2026-06-15days on market $1,500,000 Active 38 DOM
-
2026-06-14days on market $1,500,000 Active 36 DOM
-
2026-06-13days on market $1,500,000 Active 35 DOM
-
2026-06-10days on market $1,500,000 Active 33 DOM
-
2026-06-09days on market $1,500,000 Active 32 DOM
-
2026-06-08days on market $1,500,000 Active 31 DOM
-
2026-06-07days on market $1,500,000 Active 30 DOM
-
2026-06-02pricedays on market $1,500,000 Active 25 DOM
-
2026-06-01days on market $1,450,000 Active 24 DOM
-
2026-05-31days on market $1,450,000 Active 23 DOM
-
2026-05-30days on market $1,450,000 Active 22 DOM
-
2026-05-08$1,450,000 Active 1421-char remark
Show marketing remark (1421 chars)
Available on the market for the first time in 40 years, this rare 10-unit portfolio in the heart of the Village of Solvay offers a unique blend of stability and upside for investors. Data in this description pertains to both 114 and 112 Freeman Avenue combined. Consisting of three structures: a 7-unit apartment building, a 2-family multi, and a single-family colonial—all contiguous and sharing off-street parking. Each of the 10 units has separate utilities and a varied mix of sizes (1 one-bedroom, six two-bedroom, two three-bedroom, and one four-bedroom stand-alone home), giving you multiple leasing and marketing strategies. Current rents are below market value, translating into a potential 13% pro forma cap rate—an exceptional value-add play. Located in a tight-knit, lakeside community just minutes from downtown Syracuse, Solvay boasts scenic outdoor amenities, small-town conveniences and attractions, and the benefit of locally controlled, low-cost utilities via municipality-owned Solvay Electric. With strong fundamentals, thoughtful upkeep, and long-term appreciation potential, this property presents a rare opportunity to acquire a performing asset with plenty of room to grow. The hands-on owner of this well-maintained package has 55 years of experience owning and managing over 100 units. He has decided to move on to new projects, presenting an excellent opportunity for the new owner.
-
2026-04-30historical
-
2026-01-03$1,450,000 Active
-
2025-12-31historical
-
2025-12-12price $1,450,000
-
2025-07-03$1,500,000 Active
ⓘ Source: listings_history table (triggers on properties + properties_extension) + one-shot
backfill from property_details.listing_events for pre-trigger history.
Tax reassessment forecast NY · Partial reset (capped growth)
- Current annual tax
- $13,250 · $1,104/mo
- Projected year-2 tax
- $19,300 · $1,608/mo
- Expected delta
- +$6,050/yr (+$504/mo · 45.7%)
ⓘ Screening estimate from a state-policy table — verify with the county assessor before closing.
Climate risk First Street
- Flood 1/10 Low FEMA zone X (unshaded) · 0% chance over 30 yrs
- Wildfire 1/10 Low
- Heat 3/10 Moderate 7 d/yr ≥95°F today · 16 d/yr by 30 yrs out
- Wind 1/10 Low 0% chance of damaging wind over 30 yrs
- Air quality 2/10 Low 0 unhealthy d/yr today · 1 by 30 yrs out
Nearby sold comps map
Loading sold comps map…
Walkable amenities ~0.75 mi
Loading nearby amenities…
Taxation est. · year 1
- Rental income
- $192,576
- − Mortgage interest
- −$84,023
- − Property taxes
- −$13,250
- − Insurance
- −$7,500
- − Repairs & maintenance
- −$15,406
- − Management
- −$15,406
- − Depreciation
- −$43,636
- Taxable income
- $13,354
- Est. tax owed @ 24.0%
- −$3,205
- After-tax cash flow
- $33,786/yr
For passive investors: Depreciation is non-cash, so a rental often shows a tax loss while cash-flowing — sheltering income. Rental losses are passive: they offset passive income freely, and up to $25,000/yr can offset ordinary (W-2) income if you actively participate and your MAGI is under $100k (phasing out to $0 by $150k); unused losses carry forward. On sale, claimed depreciation is recaptured at up to 25%, and gains may owe capital-gains tax (a 1031 exchange can defer both). Figures are a year-1 estimate at your 24.0% rate — not tax advice; consult a CPA.
Schools (NCES district)
- District
- Solvay Union Free School District
- NCES district ID
- 3627150
- Math proficiency
- 31% ▼ -14.00%
- Reading proficiency
- 42% ▼ -4.00%
- Median HH income
- $47,163
- Composite
- 31.28/100
- National rank
- #6018
- State rank
- #550 of 590 in NY
Livability — Solvay
- Score
- 72/100
- State rank
- #350
- US rank
- #5913
Category grades
Schools grade is shown separately in the Schools card above.
Census & demographics
- Census place
- Solvay, NY
- County
- Onondaga County · 247,257 people
- Metro
- Syracuse, NY
- Population (ZIP)
- 12,714
- Household income
- $68,138
- Rent vs Own
- Severe rent burden
- 210.0
Population outlook (Onondaga County) Hauer SSP2
- Today (2025)
- 467,894 people
- By 2030
- 463,381 · -1.0%
- By 2040
- 447,697 · -4.3%
- By 2050
- 426,399 · -8.9%
- By 2075
- 373,661 · -20.1%
- By 2100
- 307,967 · -34.2%
Race, ethnicity, and origin ACS 2023
- Neighborhood character
- Predominantly White (86%)
- Race & ethnicity
- White 86% Two or more races 6% Hispanic / Latino 6% Black 3%
- Hispanic origin (detail)
- Mexican 1% Puerto Rican 4%
- Common ancestry
- Romanian 11% Subsaharan African 6% Lithuanian 2%
- Foreign-born
- 11% · Canada, China
- Languages at home
- 87% English-only · Russian/Polish/Slavic 5% Spanish 3% Arabic 2%
Political lean MEDSL · Onondaga
- 2024 margin
- D (+17.3) · D 58.6% · R 41.4%
- 2008→2024 swing
- -3.0pp toward R · 2008: 20.3pp · 2024: 17.3pp
- All cycles
- 2024: D+17.3 2020: D+20.6 2016: D+12.8 2012: D+21.1 2008: D+20.3
Not yet ingested
- Civics
- —
Market trends
- HPI YoY
- ▼ -27.23%
- Current HPI
- 326.7671
- Rent YoY
- —
- Metro
- Syracuse, NY
- State GDP YoY
- ▲ 2.60%
- F500 in state
- 92
Industry mix (Fortune 500 HQ in NY)
| Industry | F500 HQs | Revenue |
|---|---|---|
| Financial Services | 10 | $950B |
|
||
| Consumer Goods | 9 | $162B |
|
||
| Insurance | 4 | $225B |
|
||
| Telecommunications | 2 | $144B |
|
||
| Pharmaceuticals | 2 | $112B |
|
||
| Media / Entertainment | 2 | $69B |
|
||
Price history
-3.3% since first listed6 events — show timeline
- 2026-05-08 Listed $1,450,000 CNYIS
- 2026-04-30 Listing Removed — CNYIS
- 2026-01-03 Listed $1,450,000 CNYIS
- 2025-12-31 Listing Removed — CNYIS
- 2025-12-12 Price Changed $1,450,000 CNYIS
- 2025-07-03 Listed $1,500,000 CNYIS
Property tax history
+1.1%/yrLatest (2025): $13,250 · +5.0% YoY. Source: county tax records.
Cash-flow waterfall
monthlySold comps — $/sqft
last 12 mo · ≤1 miLoading sold comps…