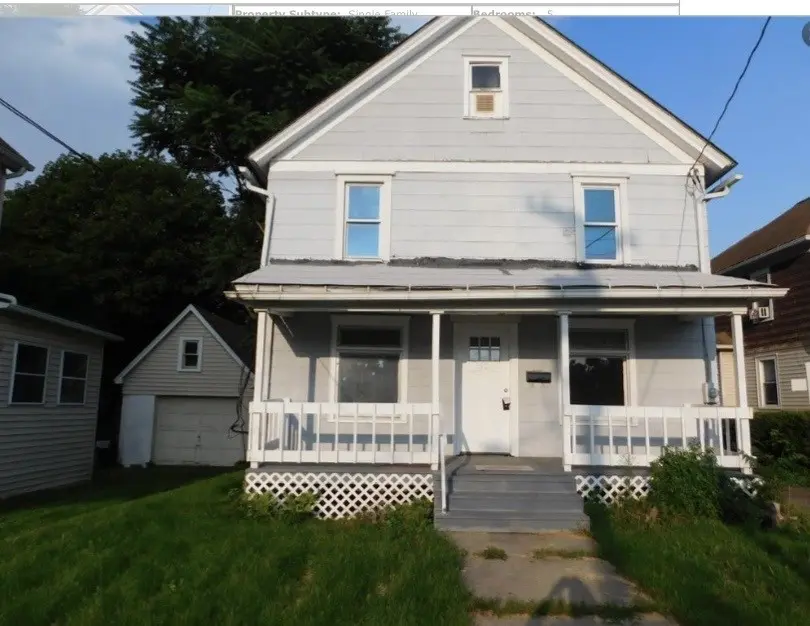
52 Holland St · Binghamton, NY
Flood risk 8/10 · Major
- FEMA flood zone
- X (shaded)
- Chance of flooding over 30 yrs
- 0.77%
- Est. flood insurance / yr
- $473 – $860
Fire risk 1/10 · Minimal
- Est. fire insurance / yr
- $691 – $1,283
Heat risk 3/10 · Minor
- Hot days now (above 94°F)
- 7 days/yr
- Hot days in 30 yrs
- 16 days/yr
Wind risk 2/10 · Minimal
- Chance of severe wind over 30 yrs
- 1.0%
Air-quality risk 2/10 · Minimal
- Unhealthy air days now
- 0 days/yr
- Unhealthy air days in 30 yrs
- 1 days/yr
Risk factors via First Street. Map © Google.
Why this score? — see what drove the B+ grade
The composite is a weighted blend of 9 inputs, each scored 0–100. Each bar is that input's sub-score; the figure is the points it added to the 100-point composite (weight × sub-score).
- Cash flow +29.2/30.0
- ARV discount +15.0/15.0
- 1% rule +10.0/10.0
- DSCR +10.0/10.0
- Rent growth +5.0/5.0
- Livability +3.9/5.0
- Schools +3.0/10.0
- Condition / age +2.5/5.0
- Appreciation +0.0/10.0
$115,000
🖨 Deal sheet (PDF) 📄 Offer letter ✓ Due diligence
Listing remarks MLS
Single family house with 5 Bedrooms & 2 Full Bathrooms.
Key facts
- 4,791 sq ft lot
- Built 1930
- Listed 59 days
Neighborhood map
What this means for you Summary
Snapshot
- This is a 4-bed/2.0-bath single-family listed at $115k.
Deal economics
- At list price, monthly cash flow is $347 ($4k/yr) — positive.
- The deal already cash-flows at list — no discount required.
- Meets the 1% rule at list price ($2k rent vs $115k).
- Recommended offer: $112k (3.0% below list) — sets the bar for market timing.
- Cap rate 10.5% vs local median 6.4% in Binghamton — top-decile yield for the area; either an underpriced asset or a hidden risk that comps aren't pricing in. Stress-test before assuming the spread holds.
Location & tenants
- Location reads 78/100 on livability (#174 in NY, #2,710 nationally) — a middle-class / working-renter tenant base. Strengths: amenities A+, commute A+, cost of living A+; Watch: schools D, crime F, employment F.
- Binghamton City School District (urban): math 30% / reading 44% proficiency, ranked #557 of 590 in NY (top 94%) — families likely to look elsewhere, expect single-tenant / working-renter base with shorter leases; 61% free/reduced lunch — lower-income household profile, screen leases tightly.
- Market conditions: Rents rising fast (+11.2%/yr); 136 active listings in the ZIP; 21 comparable units currently listed for rent nearby; rentals lingering (median 45d on market — plan ~5-8 weeks vacancy on turnover, expect pricing pressure); 71% of comp listings sitting > 30 days — soft ceiling on asking rent; 340 units permitted in Broome County in 2024 (269 in 5+ unit buildings).
- This rent runs 40% of the median local income ($53k/yr) — at the standard rent-burdened threshold; future hikes will face affordability resistance.
Forward outlook
- Local home prices are declining (-3.0%/yr); year-one equity from $795 of loan paydown is wiped out by about $3k of value loss. Plan a longer hold.
- Broome County population projected at -13% by 2050 — secular population decline; favor cash flow + early exit over multi-decade hold.
- At projected returns (-3.0% appreciation + 8.0% rent growth), your $32k cash investment doubles in ~7 years — after that, you're playing with house money.
Negotiation context
- It's been on market 60 days — a 3% lower offer ($112k) is reasonable based on typical stale-listing flexibility.
- 10 sale attempts since 9y ago with the ask held roughly flat each time — persistent listings suggest the price (not the market) is what's stuck; bring a comps-based counter.
- Current owner paid $86k; 34% above their basis — modest negotiation headroom, anchor on the comps not their cost.
Risks & watch-outs
- Watch-outs: property tax is 3.8% of price; flood insurance adds $56/mo; built in 1930 — expect roof / HVAC / electrical / plumbing capex.
- Climate carrying-cost: severe flood risk — expect insurance premiums to compound above CPI over the hold.
Questions for the listing agent
- It's been on market 60 days. Have you received any prior offers? Is the seller open to a 3% concession, seller financing, or rate buy-down credit?
- Built in 1930 — when were the roof, HVAC, electrical panel, plumbing, and water heater last replaced?
- Property tax is high relative to price — has the assessment been appealed recently, and will the sale trigger a re-assessment?
- What's the actual annual flood-insurance premium (NFIP or private), and is the property in a SFHA with mandatory coverage?
- Is there a deadline driving the sale (1031 exchange, divorce, estate, relocation)? That informs how much negotiation room exists.
- Schools are D-rated, which usually means shorter tenancies and higher turnover. Who's the typical renter profile here, and what's been the actual vacancy rate?
- Crime grade is F in this area — have there been break-ins, vandalism, or insurance claims at this property in the last 3 years? What carrier currently insures it and at what premium?
- What's the average days-on-market for RENTAL listings here right now (not sales)? A rising rental-DOM trend means longer vacancies and softer asking-rent achievability than the comps imply.
- What's the recent tenant-quality profile in this submarket — average credit score on applications, eviction rate, late-payment / NSF rate, and stable-employment percentage? A property-management company in the area should have these aggregated.
- How much new for-sale + rental construction is in the pipeline within 1–3 miles? Heavy new supply typically softens prices + rents 12–24 months out; constrained supply supports both.
Investment metrics
- 1% rule
- 1.56% ✓
- Cap rate
- 10.49%
- Cash-on-cash
- 14.98%
- DSCR
- 1.67
- GRM
- 5.3
CMA / ARV
- ARV (median comp)
- $147,274
- List price
- $115,000
- Delta
- -21.91%
- Verdict
- UNDERPRICED
- Comps
- 20 within 1.0 mi
Show comp detail 12 sales within ~0.75 mi
| Address | Dist | Beds/Ba | Sqft | Sold | Price | $/sf | Match |
|---|---|---|---|---|---|---|---|
| 20 Lake Ave Ave | 0.39mi | 4/2.0 | 1,568 (-3%) | 2mo | $125,000 | $80 | 75 |
| 23 Colfax Ave | 0.20mi | 3/2.0 (-1) | 1,561 (-3%) | 8mo | $72,000 | $46 | 73 |
| 40.5 Julian St | 0.13mi | 3/1.5 (-1) | 1,528 (-5%) | 8mo | $180,000 | $118 | 71 |
| 22 Holland St | 0.14mi | 4/2.0 | 1,825 (+13%) | 9mo | $162,500 | $89 | 65 |
| 167 Prospect St | 0.29mi | 3/2.0 (-1) | 1,448 (-10%) | 8mo | $144,000 | $99 | 58 |
| 20 Sunset Dr | 0.70mi | 4/1.5 | 1,650 (+2%) | 6mo | $200,000 | $121 | 57 |
| 23 Mygatt St | 0.68mi | 4/1.5 | 1,666 (+3%) | 9mo | $50,000 | $30 | 53 |
| 149 Matthews St | 0.69mi | 3/1.5 (-1) | 1,564 (-3%) | 5mo | $145,000 | $93 | 51 |
| 28 Sunset Dr | 0.71mi | 3/1.5 (-1) | 1,780 (+10%) | 3mo | $185,000 | $104 | 40 |
| 16 Haendel St | 0.66mi | 5/2.0 (+1) | 1,828 (+13%) | 4mo | $135,000 | $74 | 39 |
| 53 Thorp St | 0.64mi | 3/1.5 (-1) | 1,445 (-11%) | 8mo | $135,000 | $93 | 39 |
| 68 Thorp St | 0.59mi | 5/1.5 (+1) | 1,854 (+15%) | 8mo | $41,000 | $22 | 34 |
Match score weights: distance 35% · size 25% · config 20% · recency 20%. Top-matched comps best support the ARV.
Projected returns pro-forma
-3.0% appreciation · 8.0% rent growth · sell at horizon
- IRR
- 9.7%
- Equity multiple
- 1.41×
- Total profit
- $13,135
- Equity at exit
- $17,147
- IRR
- 23.4%
- Equity multiple
- 3.61×
- Total profit
- $83,904
- Equity at exit
- $9,943
Cash invested: $32,200 (down + closing). Projections, not guarantees.
Landlord ↔ Tenant lean methodology
- Overall (STATE)
- 15 Strongly Tenant-Friendly
- State New York
- 15 Strongly Tenant-Friendly · D+10
- County
- — inherits STATE
- City
- — inherits STATE
ZIP-level market 13905
- Home prices YoY
- -31.1%
- Rents YoY
- 11.2%
- Active inventory
- 136
- Price-to-rent
- 5.3×
Monthly cashflow live
- Estimated rent
- $1,798 high interval (Pro) →
- Mortgage (P&I)
- −$603
- Tax from tax record
- −$367 /mo · $4,404/yr
- Insurance
- −$48
- Flood insurance flood zone
- −$56 /mo · $666/yr
- HOA
- −$0
- Vacancy / Maint / Mgmt
- −$378
- Net cashflow
- $347
Break-even live
Sensitivity live
| Price | -10% $412 | -5% $379 | +0% $347 | +5% $314 | +10% $281 |
|---|---|---|---|---|---|
| Rent | -10% $205 | -5% $276 | +0% $347 | +5% $418 | +10% $489 |
| Rate | -1.0pp $404 | -0.5pp $376 | base $347 | +0.5pp $317 | +1.0pp $286 |
UW: 25.0% down · 7.5% · 30yr · 1.5% tax · 5.0% vac · 8.0% maint · 8.0% mgmt
Financing live
Cash to close
- Down payment
- $28,750
- Closing costs
- $3,450
- Reserves months
- —
- Total cash needed
- —
Loan-product check · same deal, 3 products live
Conventional
25% down · 7.5% · 30yr
- Down + closing
- —
- Monthly P&I
- —
- Monthly cashflow
- —
- DSCR
- —
- Eligible?
- —
Personal DTI + credit; lowest rate.
DSCR
20% down · 8.5% · 30yr
- Down + closing
- —
- Monthly P&I
- —
- Monthly cashflow
- —
- DSCR
- —
- Eligible?
- —
No personal income docs; deal must DSCR.
Hard money
10% down · 12.0% · 12mo
- Down + closing
- —
- Monthly P&I
- —
- Monthly cashflow
- —
- DSCR
- —
- Eligible?
- —
Short-term bridge; refi at stabilization.
Rent comps 21 comps
| Address | Beds | Baths | Sqft | Rent | $/sqft | DOM | Units | Dist |
|---|---|---|---|---|---|---|---|---|
| 4 Baxter St Unit Left Binghamton, NY | 4.0 | 2.5 | 1800 | $1,500 | $0.83 | 14d | 1 | 0.26mi |
| 296 Main St Unit 6 Binghamton, NY | 3.0 | 1.0 | 1200 | $1,250 | $1.04 | 14d | 1 | 0.40mi |
| 133 Crestmont Rd Unit 2 Binghamton, NY | 3.0 | 1.0 | 1300 | $1,900 | $1.46 | 45d | 1 | 0.53mi |
| 36 Haendel St Unit 1 Binghamton, NY | 3.0 | 1.0 | 1600 | $1,650 | $1.03 | 45d | 1 | 0.59mi |
| 36 Haendel St Unit Second Floor Binghamton, NY | 3.0 | 1.0 | 1200 | $1,450 | $1.21 | 45d | 1 | 0.59mi |
| 129 Helen St Unit 1 Binghamton, NY | 4.0 | 2.0 | 1850 | $2,200 | $1.19 | 45d | 1 | 0.71mi |
| 4 Erie St Unit 2 Binghamton, NY | 3.0 | 1.0 | 1075 | $1,200 | $1.12 | 45d | 1 | 0.77mi |
| 16 Highland Ave Unit 1 Binghamton, NY | 3.0 | 1.0 | 1400 | $1,650 | $1.18 | 45d | 1 | 0.80mi |
| 99 Helen St Unit 2 Binghamton, NY | 3.0 | 1.0 | 1220 | $1,600 | $1.31 | 45d | 1 | 0.83mi |
| 198 Chapin St Binghamton, NY | 4.0 | 2.0 | 1500 | $1,700 | $1.13 | 22d | 1 | 0.89mi |
| 171 Chapin St Unit 1st FL Binghamton, NY | 4.0 | 1.5 | 1400 | $3,000 | $2.14 | 45d | 1 | 0.93mi |
| 171 Chapin St Unit 2nd FL Binghamton, NY | 4.0 | 2.0 | 1135 | $3,000 | $2.64 | 45d | 1 | 0.93mi |
| 5 Arthur St Unit 2 Binghamton, NY | 4.0 | 1.0 | 1200 | $1,800 | $1.50 | 45d | 1 | 1.05mi |
| 5 Arthur St Unit 1 Binghamton, NY | 5.0 | 2.0 | 1200 | $2,250 | $1.88 | 45d | 1 | 1.05mi |
| 145 Floral Ave Unit 4 Johnson City, NY | 3.0 | 1.0 | 1095 | $1,250 | $1.14 | 22d | 1 | 1.06mi |
| 50 Lathrop Ave Unit 2 Binghamton, NY | 3.0 | 1.0 | 1250 | $1,600 | $1.28 | 14d | 1 | 1.19mi |
| 73 Leroy St Unit 02 Binghamton, NY | 3.0 | 1.0 | 1100 | $1,950 | $1.77 | 45d | 1 | 1.19mi |
| 19 Walnut St Binghamton, NY | 5.0 | 2.0 | 1666 | $2,250 | $1.35 | 45d | 1 | 1.21mi |
| 26 Johnson Ave Unit 1 Binghamton, NY | 3.0 | 1.0 | 1633 | $1,600 | $0.98 | 45d | 1 | 1.31mi |
| 51 Allen St Unit 1 Johnson City, NY | 3.0 | 1.0 | 1170 | $1,575 | $1.35 | 22d | 1 | 1.45mi |
| 29 Laurel Ave Unit 2 Binghamton, NY | 3.0 | 1.5 | 1500 | $2,250 | $1.50 | 45d | 1 | 1.48mi |
Listing history 40 events
-
2026-06-21days on market $115,000 Active 60 DOM
-
2026-06-19days on market $115,000 Active 58 DOM
-
2026-06-18days on market $115,000 Active 57 DOM
-
2026-06-17days on market $115,000 Active 56 DOM
-
2026-06-16days on market $115,000 Active 55 DOM
-
2026-06-15days on market $115,000 Active 54 DOM
-
2026-06-14days on market $115,000 Active 52 DOM
-
2026-06-13days on market $115,000 Active 51 DOM
-
2026-06-10days on market $115,000 Active 49 DOM
-
2026-06-09days on market $115,000 Active 48 DOM
-
2026-06-08days on market $115,000 Active 47 DOM
-
2026-06-07days on market $115,000 Active 46 DOM
-
2026-06-03days on market $115,000 Active 42 DOM
-
2026-06-02days on market $115,000 Active 41 DOM
-
2026-06-01days on market $115,000 Active 40 DOM
-
2026-05-31days on market $115,000 Active 39 DOM
-
2026-05-30days on market $115,000 Active 38 DOM
-
2026-04-22$115,000 Active 61-char remark
Show marketing remark (61 chars)
Single family house with 5 Bedrooms & 2 Full Bathrooms.
-
2025-04-02historical $1,700
-
2025-03-15$1,700
-
2024-07-15soldstatus $86,000 Closed 260-char remark
Show marketing remark (260 chars)
Renovated 5 bedroom 2 bath home! This was once a 2 family home that was turned into a single-family home which has now been updated. 3 bedrooms on the first floor, one can be used as a dining room. Full bath on each level! Large bonus room on the second floor.
-
2024-07-03status Pending 260-char remark
Show marketing remark (260 chars)
Renovated 5 bedroom 2 bath home! This was once a 2 family home that was turned into a single-family home which has now been updated. 3 bedrooms on the first floor, one can be used as a dining room. Full bath on each level! Large bonus room on the second floor.
-
2024-05-29price $104,900 260-char remark
Show marketing remark (260 chars)
Renovated 5 bedroom 2 bath home! This was once a 2 family home that was turned into a single-family home which has now been updated. 3 bedrooms on the first floor, one can be used as a dining room. Full bath on each level! Large bonus room on the second floor.
-
2024-01-02status Active 260-char remark
Show marketing remark (260 chars)
Renovated 5 bedroom 2 bath home! This was once a 2 family home that was turned into a single-family home which has now been updated. 3 bedrooms on the first floor, one can be used as a dining room. Full bath on each level! Large bonus room on the second floor.
-
2024-01-02price $94,900 260-char remark
Show marketing remark (260 chars)
Renovated 5 bedroom 2 bath home! This was once a 2 family home that was turned into a single-family home which has now been updated. 3 bedrooms on the first floor, one can be used as a dining room. Full bath on each level! Large bonus room on the second floor.
-
2023-11-20price $96,900 260-char remark
Show marketing remark (260 chars)
Renovated 5 bedroom 2 bath home! This was once a 2 family home that was turned into a single-family home which has now been updated. 3 bedrooms on the first floor, one can be used as a dining room. Full bath on each level! Large bonus room on the second floor.
-
2023-10-14price $97,900 260-char remark
Show marketing remark (260 chars)
Renovated 5 bedroom 2 bath home! This was once a 2 family home that was turned into a single-family home which has now been updated. 3 bedrooms on the first floor, one can be used as a dining room. Full bath on each level! Large bonus room on the second floor.
-
2023-10-14status Active 260-char remark
Show marketing remark (260 chars)
Renovated 5 bedroom 2 bath home! This was once a 2 family home that was turned into a single-family home which has now been updated. 3 bedrooms on the first floor, one can be used as a dining room. Full bath on each level! Large bonus room on the second floor.
-
2023-09-11status Pending 260-char remark
Show marketing remark (260 chars)
Renovated 5 bedroom 2 bath home! This was once a 2 family home that was turned into a single-family home which has now been updated. 3 bedrooms on the first floor, one can be used as a dining room. Full bath on each level! Large bonus room on the second floor.
-
2023-08-01$99,900 Active 260-char remark
Show marketing remark (260 chars)
Renovated 5 bedroom 2 bath home! This was once a 2 family home that was turned into a single-family home which has now been updated. 3 bedrooms on the first floor, one can be used as a dining room. Full bath on each level! Large bonus room on the second floor.
-
2023-04-27price $98,900
-
2023-01-23$99,900 Active
-
2022-07-08soldstatus $34,000 Closed
-
2022-03-17$44,900
-
2021-09-24$59,900
-
2018-05-31soldstatus $34,500
-
2018-05-30soldstatus $34,500
-
2017-09-27$39,000
-
2017-01-24$50,000
-
2007-10-01soldstatus $50,000
ⓘ Source: listings_history table (triggers on properties + properties_extension) + one-shot
backfill from property_details.listing_events for pre-trigger history.
Tax reassessment forecast NY · Partial reset (capped growth)
- Current annual tax
- $4,404 · $367/mo
- Projected year-2 tax
- $4,404 · $367/mo
- Expected delta
- $0/yr ($0/mo · 0.0%)
ⓘ Screening estimate from a state-policy table — verify with the county assessor before closing.
Climate risk First Street
- Flood 8/10 Severe FEMA zone X (shaded) · 77% chance over 30 yrs
- Wildfire 1/10 Low
- Heat 3/10 Moderate 7 d/yr ≥94°F today · 16 d/yr by 30 yrs out
- Wind 2/10 Low 100% chance of damaging wind over 30 yrs
- Air quality 2/10 Low 0 unhealthy d/yr today · 1 by 30 yrs out
Nearby sold comps map
Loading sold comps map…
Walkable amenities ~0.75 mi
Loading nearby amenities…
Taxation est. · year 1
- Rental income
- $21,571
- − Mortgage interest
- −$6,442
- − Property taxes
- −$4,404
- − Insurance
- −$1,242
- − Repairs & maintenance
- −$1,726
- − Management
- −$1,726
- − Depreciation
- −$3,345
- Taxable income
- $2,687
- Est. tax owed @ 24.0%
- −$645
- After-tax cash flow
- $3,514/yr
For passive investors: Depreciation is non-cash, so a rental often shows a tax loss while cash-flowing — sheltering income. Rental losses are passive: they offset passive income freely, and up to $25,000/yr can offset ordinary (W-2) income if you actively participate and your MAGI is under $100k (phasing out to $0 by $150k); unused losses carry forward. On sale, claimed depreciation is recaptured at up to 25%, and gains may owe capital-gains tax (a 1031 exchange can defer both). Figures are a year-1 estimate at your 24.0% rate — not tax advice; consult a CPA.
Schools (NCES district)
- District
- Binghamton City School District
- NCES district ID
- 3604870
- Math proficiency
- 30% ▬ 0.00%
- Reading proficiency
- 44% ▲ 15.00%
- Median HH income
- $30,475
- Composite
- 30.09/100
- National rank
- #6342
- State rank
- #557 of 590 in NY
Livability — Binghamton
- Score
- 78/100
- State rank
- #174
- US rank
- #2710
Category grades
Schools grade is shown separately in the Schools card above.
Census & demographics
- Census place
- Binghamton, NY
- County
- Broome County · 126,805 people
- City population
- 65,170
- Metro
- Binghamton, NY
- Population (ZIP)
- 27,988
- Household income
- $53,362
- Rent vs Own
- Severe rent burden
- 1875.0
Population outlook (Broome County) Hauer SSP2
- Today (2025)
- 187,989 people
- By 2030
- 183,066 · -2.6%
- By 2040
- 172,228 · -8.4%
- By 2050
- 163,161 · -13.2%
- By 2075
- 153,641 · -18.3%
- By 2100
- 140,851 · -25.1%
Race, ethnicity, and origin ACS 2023
- Neighborhood character
- Predominantly White (68%)
- Race & ethnicity
- White 68% Asian 10% Black 10% Hispanic / Latino 7% Two or more races 7%
- Hispanic origin (detail)
- Mexican 2% Puerto Rican 3%
- Common ancestry
- Romanian 5% Lithuanian 3% Iranian 1%
- Foreign-born
- 11% · Canada, China, Vietnam
- Languages at home
- 87% English-only · Other Indo-European 5% Spanish 2% Other Asian/Pacific 1%
Political lean MEDSL · Broome
- 2024 margin
- Toss-up / Even · D 50.2% · R 49.8%
- 2008→2024 swing
- -7.6pp toward R · 2008: 8.0pp · 2024: 0.4pp
- All cycles
- 2024: D+0.4 2020: D+3.5 2016: R+3.7 2012: D+4.6 2008: D+8.0
Not yet ingested
- Civics
- —
Market trends
- HPI YoY
- ▼ -134.70%
- Current HPI
- 298.9847
- Rent YoY
- ▲ 11.19%
- Metro
- Binghamton, NY
- State GDP YoY
- ▲ 2.60%
- F500 in state
- 92
Industry mix (Fortune 500 HQ in NY)
| Industry | F500 HQs | Revenue |
|---|---|---|
| Financial Services | 10 | $950B |
|
||
| Consumer Goods | 9 | $162B |
|
||
| Insurance | 4 | $225B |
|
||
| Telecommunications | 2 | $144B |
|
||
| Pharmaceuticals | 2 | $112B |
|
||
| Media / Entertainment | 2 | $69B |
|
||
Price history
+130.0% since first listed23 events — show timeline
- 2026-04-22 Listed $115,000 GBAOR
- 2025-04-02 Rental Removed $1,700 GBAOR
- 2025-03-15 Listed for Rent $1,700 GBAOR
- 2024-07-15 Sold (MLS) $86,000 GBAOR
- 2024-07-03 Pending — GBAOR
- 2024-05-29 Price Changed $104,900 GBAOR
- 2024-01-02 Relisted — GBAOR
- 2024-01-02 Price Changed $94,900 GBAOR
- 2023-11-20 Price Changed $96,900 GBAOR
- 2023-10-14 Price Changed $97,900 GBAOR
- 2023-10-14 Relisted — GBAOR
- 2023-09-11 Pending — GBAOR
- 2023-08-01 Listed $99,900 GBAOR
- 2023-04-27 Price Changed $98,900 GBAOR
- 2023-01-23 Listed $99,900 GBAOR
- 2022-07-08 Sold (MLS) $34,000 GBAOR
- 2022-03-17 Listed $44,900 GBAOR
- 2021-09-24 Listed $59,900 GBAOR
- 2018-05-31 Sold (Public Records) $34,500 Public Records
- 2018-05-30 Sold (MLS) $34,500 GBAOR
- 2017-09-27 Listed $39,000 GBAOR
- 2017-01-24 Listed $50,000 GBAOR
- 2007-10-01 Sold (Public Records) $50,000 Public Records
Property tax history
+4.7%/yrLatest (2025): $4,404 · +0.9% YoY. Source: county tax records.
Cash-flow waterfall
monthlySold comps — $/sqft
last 12 mo · ≤1 miLoading sold comps…