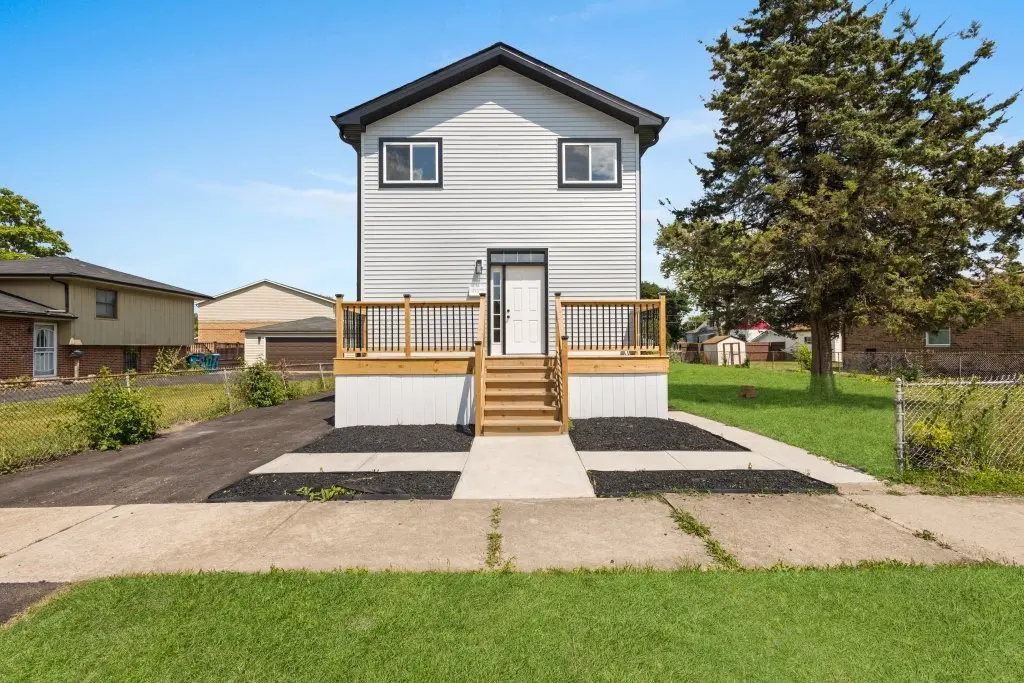
15355 7th Ave · Phoenix, IL
Flood risk 1/10 · Minimal
- FEMA flood zone
- X (unshaded)
- Chance of flooding over 30 yrs
- 0.0%
- Est. flood insurance / yr
- $507 – $1,088
Fire risk 1/10 · Minimal
- Est. fire insurance / yr
- $804 – $1,492
Heat risk 3/10 · Minor
- Hot days now (above 101°F)
- 7 days/yr
- Hot days in 30 yrs
- 15 days/yr
Wind risk 2/10 · Minimal
- Chance of severe wind over 30 yrs
- —
Air-quality risk 4/10 · Minor
- Unhealthy air days now
- 4 days/yr
- Unhealthy air days in 30 yrs
- 5 days/yr
Risk factors via First Street. Map © Google.
Why this score? — see what drove the D+ grade
The composite is a weighted blend of 9 inputs, each scored 0–100. Each bar is that input's sub-score; the figure is the points it added to the 100-point composite (weight × sub-score).
- Cash flow +16.6/30.0
- Appreciation +10.0/10.0
- DSCR +5.2/10.0
- 1% rule +4.5/10.0
- Livability +3.8/5.0
- Rent growth +2.5/5.0
- Condition / age +2.5/5.0
- Schools +0.7/10.0
- ARV discount +0.0/15.0
$274,900
🖨 Deal sheet 📄 Offer letter ✓ Due diligence
Listing remarks
Fully rehabbed and move-in ready, this beautiful 4-bedroom, 3-bath home offers modern updates and a functional layout throughout. The main levels feature stylish finishes, an updated kitchen, and spacious living areas filled with natural light. The basement includes an additional bedroom and full bathroom, providing extra living space perfect for guests, extended family, or a home office. Situated on a generous lot with a 2-car garage, this home offers both comfort and convenience. Located near schools, parks, and major highways. Schedule your showing today! BUYER FINANCING FELL THROUGH AND A NEW AC WAS ADDED TO THE PROPERTY!
Key facts
- Near schools
- Additional bedroom
- Generous lot
Tags
Property features AI
Finance
- Other: Property is not currently leased; Possession at closing
- HOA & community: No master association fee required
Exterior
- Parking: Detached garage with 2 garage spaces; Asphalt driveway; Garage door opener; Garage is owned
- Utilities: Water from Lake Michigan; Public sewer; Electric with circuit breakers
- Home design: Detached single-family home; 1.5-story; Fee simple ownership; Rebuilt/rehab completed in 2025; Property over 100 years old (originally)
- Construction: Frame construction; Built before 1978
- Exterior features: Lot approximately 24 x 121 (less than 0.25 acre); School bus service
Interior
- Kitchen: Range; Microwave; Dishwasher; Refrigerator
- Bedrooms: 4 bedrooms (Master and two bedrooms on the second floor; one bedroom on the main level); Basement bonus room (9 x 12)
- Flooring: Hardwood flooring in living room, dining room and master bedroom
- Bathrooms: 3 full bathrooms; Basement has a bathroom
- Heating & cooling: Natural gas heating; Wall cooling units
- Interior features: Partially finished full basement; 9 total rooms; CO detectors; Ceiling fans
- Laundry & utility: Main-level laundry (10 x 6) with electric dryer hookup and utility sink; Washer; Dryer
Neighborhood map
What this means for you Summary
Snapshot
- This is a 3-bed/1.5-bath single-family listed at $275k.
Deal economics
- At list price, monthly cash flow is $167 ($2k/yr) — positive.
- The deal already cash-flows at list — no discount required.
- To meet the 1% rule (rent ≥ 1% of price), the offer needs to be $262k (4.7% below list).
- Recommended offer: $262k (4.7% below list) — sets the bar for 1% rule.
Location & tenants
- Location reads 75/100 on livability (#230 in IL, #4,248 nationally) — a middle-class / working-renter tenant base. Strengths: commute A+, cost of living A+, crime A-; Watch: health & safety C-, schools F, amenities F.
- Thornton Twp Hsd 205 (suburban): math 7% / reading 8% proficiency, ranked #594 of 620 in IL (top 96%) — low school quality limits family demand, transient renter base, plan for 1-2y turnover.
- Market conditions: 134 active listings in the ZIP; 4 comparable units currently listed for rent nearby; rentals at typical pace (median 25d on market — plan ~3-4 weeks tenant-placement turnaround); 6,272 units permitted in Cook County in 2024 (4,658 in 5+ unit buildings).
Forward outlook
- In year one you build about $29k of equity ($2k loan paydown + $27k appreciation (10.0% local appreciation)).
- At projected returns (10.0% appreciation + 3.0% rent growth), your $77k cash investment doubles in ~3 years — after that, you're playing with house money.
- By year 2, paydown + projected appreciation supports a ~$47k cash-out refi (75% LTV) — recoverable capital for the next deal without selling this one.
Negotiation context
- It's been on market 27 days — a 2% lower offer ($271k) is reasonable based on typical stale-listing flexibility.
- 4 sale attempts since 2y ago; this cycle's ask is 323% above the opening price — seller raised mid-cycle; expect resistance to lowballs.
- Current owner paid $48k; list at $275k implies a 479% gain — meaningful room to come down on a strong offer.
Risks & watch-outs
- Watch-outs: built in 1919 — expect roof / HVAC / electrical / plumbing capex.
Questions for the listing agent
- Built in 1919 — when were the roof, HVAC, electrical panel, plumbing, and water heater last replaced?
- Is there a deadline driving the sale (1031 exchange, divorce, estate, relocation)? That informs how much negotiation room exists.
- Schools are F-rated, which usually means shorter tenancies and higher turnover. Who's the typical renter profile here, and what's been the actual vacancy rate?
- The area grade is low — what's the realistic commute time and amenity access for the typical tenant pool here? Any planned neighborhood developments (good or bad) we should know about?
- What's the average days-on-market for RENTAL listings here right now (not sales)? A rising rental-DOM trend means longer vacancies and softer asking-rent achievability than the comps imply.
- What's the recent tenant-quality profile in this submarket — average credit score on applications, eviction rate, late-payment / NSF rate, and stable-employment percentage? A property-management company in the area should have these aggregated.
- How much new for-sale + rental construction is in the pipeline within 1–3 miles? Heavy new supply typically softens prices + rents 12–24 months out; constrained supply supports both.
Investment metrics
- 1% rule
- 0.95% ✗
- Cap rate
- 7.02%
- Cash-on-cash
- 2.60%
- DSCR
- 1.12
- GRM
- 8.7
CMA / ARV
- ARV (on-the-fly)
- $190,080
- Comps found
- 12
Show comp detail 12 sales within ~0.75 mi
| Address | Dist | Beds/Ba | Sqft | Sold | Price | $/sf | Match |
|---|---|---|---|---|---|---|---|
| 910 E 152nd Pl | 0.28mi | 4/2.0 (+1) | 1,349 (+2%) | 0mo | $190,000 | $141 | 76 |
| 15711 Lowe Ave | 0.45mi | 3/1.5 | 1,404 (+6%) | 2mo | $232,000 | $165 | 67 |
| 34 E 159th St | 0.62mi | 3/1.5 | 1,378 (+4%) | 2mo | $244,900 | $178 | 63 |
| 15444 State St | 0.60mi | 3/2.5 | 1,254 (-5%) | 2mo | $207,000 | $165 | 58 |
| 536 E 155th St | 0.39mi | 4/2.0 (+1) | 1,423 (+8%) | 7mo | $245,000 | $172 | 56 |
| 15536 State St | 0.55mi | 3/1.0 | 1,212 (-8%) | 4mo | $140,000 | $116 | 55 |
| 64 E 158th Pl | 0.65mi | 3/2.5 | 1,250 (-5%) | 3mo | $185,000 | $148 | 55 |
| 14925 Riverside Dr | 0.63mi | 3/1.0 | 1,472 (+12%) | 3mo | $70,000 | $48 | 47 |
| 15750 Woodlawn West Ave | 0.74mi | 3/1.0 | 1,210 (-8%) | 6mo | $137,000 | $113 | 44 |
| 523 E 149th St | 0.70mi | 3/1.5 | 1,143 (-13%) | 2mo | $80,000 | $70 | 44 |
| 14947 Riverside Dr | 0.59mi | 4/2.0 (+1) | 1,491 (+13%) | 6mo | $215,000 | $144 | 39 |
| 551 E 149 St | 0.71mi | 3/1.0 | 1,174 (-11%) | 10mo | $115,000 | $98 | 38 |
Match score weights: distance 35% · size 25% · config 20% · recency 20%. Top-matched comps best support the ARV.
Projected returns pro-forma
10.0% appreciation · 3.0% rent growth · sell at horizon
- IRR
- 26.2%
- Equity multiple
- 3.08×
- Total profit
- $160,388
- Equity at exit
- $247,652
- IRR
- 23.0%
- Equity multiple
- 7.03×
- Total profit
- $464,041
- Equity at exit
- $534,070
Cash invested: $76,972 (down + closing). Projections, not guarantees.
Landlord ↔ Tenant lean methodology
- Overall (STATE)
- 43 Moderately Tenant-Leaning
- State Illinois
- 43 Moderately Tenant-Leaning · D+7
- County
- — inherits STATE
- City
- — inherits STATE
ZIP-level market 60426
- Home prices YoY
- 6.9%
- Active inventory
- 134
- Price-to-rent
- 8.7×
Monthly cashflow live
- Estimated rent
- $2,621 medium interval (Pro) →
- Mortgage (P&I)
- −$1,442
- Tax from tax record
- −$348 /mo · $4,170/yr
- Insurance
- −$115
- HOA
- −$0
- Vacancy / Maint / Mgmt
- −$550
- Net cashflow
- $167
Break-even live
UW: 25.0% down · 7.5% · 30yr · 1.5% tax · 5.0% vac · 8.0% maint · 8.0% mgmt
Financing live
Cash to close
- Down payment
- $68,725
- Closing costs
- $8,247
- Reserves months
- —
- Total cash needed
- —
Loan-product check · same deal, 3 products live
Conventional
25% down · 7.5% · 30yr
- Down + closing
- —
- Monthly P&I
- —
- Monthly cashflow
- —
- DSCR
- —
- Eligible?
- —
Personal DTI + credit; lowest rate.
DSCR
20% down · 8.5% · 30yr
- Down + closing
- —
- Monthly P&I
- —
- Monthly cashflow
- —
- DSCR
- —
- Eligible?
- —
No personal income docs; deal must DSCR.
Hard money
10% down · 12.0% · 12mo
- Down + closing
- —
- Monthly P&I
- —
- Monthly cashflow
- —
- DSCR
- —
- Eligible?
- —
Short-term bridge; refi at stabilization.
Rent comps 4 comps
| Address | Beds | Baths | Sqft | Rent | $/sqft | DOM | Units | Dist |
|---|---|---|---|---|---|---|---|---|
| 16048 Halsted St Unit 2 Harvey, IL | 3.0 | 1.0 | 1091 | $1,650 | $1.51 | 24d | 1 | 0.95mi |
| 14844 Wabash Ave Dolton, IL | 3.0 | 1.5 | 1277 | $2,320 | $1.82 | 24d | 1 | 1.12mi |
| 15509 Park Ln South Holland, IL | 4.0 | 1.5 | 1200 | $3,400 | $2.83 | 8d | 1 | 1.28mi |
| 15509 Park Ln South Holland, IL | 4.0 | 1.5 | 1200 | $3,400 | $2.83 | 24d | 1 | 1.28mi |
Listing history 33 events
-
2026-06-18days on market $274,900 Active 27 DOM
-
2026-06-17days on market $274,900 Active 26 DOM
-
2026-06-16days on market $274,900 Active 25 DOM
-
2026-06-15days on market $274,900 Active 24 DOM
-
2026-06-13days on market $274,900 Active 22 DOM
-
2026-06-13days on market $274,900 Active 21 DOM
-
2026-06-09days on market $274,900 Active 18 DOM
-
2026-06-08days on market $274,900 Active 17 DOM
-
2026-06-07days on market $274,900 Active 16 DOM
-
2026-06-04days on market $274,900 Active 13 DOM
-
2026-06-03days on market $274,900 Active 12 DOM
-
2026-06-02days on market $274,900 Active 11 DOM
-
2026-06-01days on market $274,900 Active 10 DOM
-
2026-05-31days on market $274,900 Active 9 DOM
-
2026-04-04historical Contingent - Continue to Show
-
2026-04-04historical
-
2025-12-03historical Contingent - Continue to Show
-
2025-12-01historical
-
2025-10-02price
-
2025-09-16price
-
2025-09-03price
-
2025-08-15price
-
2025-07-12Active
-
2025-01-07soldstatus $47,500
-
2024-12-20soldstatus $47,500 Closed
-
2024-12-11status Pending
-
2024-11-22price $54,000
-
2024-10-03$65,000 Active
-
2024-08-31historical
-
2024-07-10status Active
-
2024-07-10price
-
2024-05-01status Pending
-
2024-03-07Active
ⓘ Source: listings_history table (triggers on properties + properties_extension) + one-shot
backfill from property_details.listing_events for pre-trigger history.
Tax reassessment forecast IL · Partial reset (capped growth)
- Current annual tax
- $4,170 · $348/mo
- Projected year-2 tax
- $5,205 · $434/mo
- Expected delta
- +$1,035/yr (+$86/mo · 24.8%)
ⓘ Screening estimate from a state-policy table — verify with the county assessor before closing.
Climate risk First Street
- Flood 1/10 Low FEMA zone X (unshaded) · 0% chance over 30 yrs
- Wildfire 1/10 Low
- Heat 3/10 Moderate 7 d/yr ≥101°F today · 15 d/yr by 30 yrs out
- Wind 2/10 Low
- Air quality 4/10 Moderate 4 unhealthy d/yr today · 5 by 30 yrs out
Nearby sold comps map
Loading sold comps map…
Walkable amenities ~0.75 mi
Loading nearby amenities…
Taxation est. · year 1
- Rental income
- $31,451
- − Mortgage interest
- −$15,399
- − Property taxes
- −$4,170
- − Insurance
- −$1,374
- − Repairs & maintenance
- −$2,516
- − Management
- −$2,516
- − Depreciation
- −$7,997
- Taxable loss
- −$2,522
- Est. tax savings @ 24.0%
- +$605
- After-tax cash flow
- $2,608/yr
For passive investors: Depreciation is non-cash, so a rental often shows a tax loss while cash-flowing — sheltering income. Rental losses are passive: they offset passive income freely, and up to $25,000/yr can offset ordinary (W-2) income if you actively participate and your MAGI is under $100k (phasing out to $0 by $150k); unused losses carry forward. On sale, claimed depreciation is recaptured at up to 25%, and gains may owe capital-gains tax (a 1031 exchange can defer both). Figures are a year-1 estimate at your 24.0% rate — not tax advice; consult a CPA.
Schools (NCES district)
- District
- Thornton Twp Hsd 205
- NCES district ID
- 1738970
- Math proficiency
- 7% ▬ 0.00%
- Reading proficiency
- 8% ▼ -2.00%
- Median HH income
- $43,392
- Composite
- 6.92/100
- National rank
- #9976
- State rank
- #594 of 620 in IL
Livability — Phoenix
- Score
- 75/100
- State rank
- #230
- US rank
- #4248
Category grades
Schools grade is shown separately in the Schools card above.
Census & demographics
- Census place
- Phoenix, IL
- Population (ZIP)
- 23,066
Population outlook (Cook County) Hauer SSP2
- Today (2025)
- 5,347,519 people
- By 2030
- 5,357,703 · +0.2%
- By 2040
- 5,324,924 · -0.4%
- By 2050
- 5,230,762 · -2.2%
- By 2075
- 4,785,735 · -10.5%
- By 2100
- 4,188,836 · -21.7%
Race, ethnicity, and origin ACS 2023
- Neighborhood character
- Majority Black (59%)
- Race & ethnicity
- Black 59% Hispanic / Latino 33% Two or more races 12% White 3% Asian 2%
- Hispanic origin (detail)
- Mexican 31%
- Foreign-born
- 17% · Canada
- Languages at home
- 67% English-only · Spanish 30% Other Indo-European 2% French/Haitian/Cajun 1%
Political lean MEDSL · Cook
- 2024 margin
- Solid D (+42.0) · D 70.4% · R 28.4% · Other 1.2%
- 2008→2024 swing
- -11.4pp toward R · 2008: 53.4pp · 2024: 42.0pp
- All cycles
- 2024: D+42.0 2020: D+50.3 2016: D+53.0 2012: D+49.4 2008: D+53.4
Not yet ingested
- Civics
- —
Market trends
- HPI YoY
- ▲ 20.36%
- Current HPI
- 313.7895
- Rent YoY
- —
- Metro
- —
- State GDP YoY
- ▲ 1.59%
- F500 in state
- 60
Industry mix (Fortune 500 HQ in IL)
| Industry | F500 HQs | Revenue |
|---|---|---|
| Insurance | 4 | $201B |
|
||
| Consumer Goods | 4 | $87B |
|
||
| Industrial Machinery | 3 | $64B |
|
||
| Healthcare | 2 | $55B |
|
||
| Retail / Pharmacy | 1 | $148B |
|
||
| Agriculture / Food | 1 | $86B |
|
||
Price history
-26.9% since first listed19 events — show timeline
- 2026-04-04 Contingent — MRED as Distributed by MLS Grid
- 2026-04-04 Listing Removed — MRED as Distributed by MLS Grid
- 2025-12-03 Contingent — MRED as Distributed by MLS Grid
- 2025-12-01 Listing Removed — MRED as Distributed by MLS Grid
- 2025-10-02 Price Changed — MRED as Distributed by MLS Grid
- 2025-09-16 Price Changed — MRED as Distributed by MLS Grid
- 2025-09-03 Price Changed — MRED as Distributed by MLS Grid
- 2025-08-15 Price Changed — MRED as Distributed by MLS Grid
- 2025-07-12 Listed — MRED as Distributed by MLS Grid
- 2025-01-07 Sold (Public Records) $47,500 Public Records
- 2024-12-20 Sold (MLS) $47,500 MRED as Distributed by MLS Grid
- 2024-12-11 Pending — MRED as Distributed by MLS Grid
- 2024-11-22 Price Changed $54,000 MRED as Distributed by MLS Grid
- 2024-10-03 Listed $65,000 MRED as Distributed by MLS Grid
- 2024-08-31 Listing Removed — MRED as Distributed by MLS Grid
- 2024-07-10 Relisted — MRED as Distributed by MLS Grid
- 2024-07-10 Price Changed — MRED as Distributed by MLS Grid
- 2024-05-01 Pending — MRED as Distributed by MLS Grid
- 2024-03-07 Listed — MRED as Distributed by MLS Grid
Property tax history
+10.6%/yrLatest (2023): $4,170 · +39.1% YoY. Source: county tax records.
Cash-flow waterfall
monthlySold comps — $/sqft
last 12 mo · ≤1 miLoading sold comps…