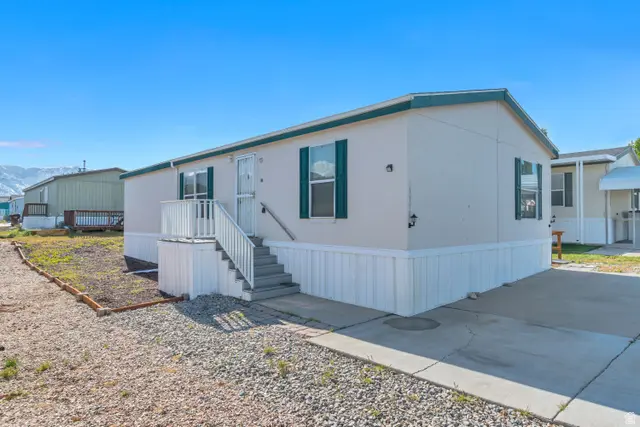
1716 N 150 E · Tooele, UT
Flood risk 6/10 · Moderate
- FEMA flood zone
- X (unshaded)
- Chance of flooding over 30 yrs
- 0.74%
- Est. flood insurance / yr
- $473 – $860
Fire risk 8/10 · Major
- Est. fire insurance / yr
- $453 – $841
Heat risk 4/10 · Minor
- Hot days now (above 92°F)
- 2 days/yr
- Hot days in 30 yrs
- 6 days/yr
Wind risk 1/10 · Minimal
- Chance of severe wind over 30 yrs
- —
Air-quality risk 3/10 · Minor
- Unhealthy air days now
- 2 days/yr
- Unhealthy air days in 30 yrs
- 3 days/yr
Risk factors via First Street. Map © Google.
Why this score? — see what drove the C grade
The composite is a weighted blend of 9 inputs, each scored 0–100. Each bar is that input's sub-score; the figure is the points it added to the 100-point composite (weight × sub-score).
- Cash flow +21.0/30.0
- 1% rule +10.0/10.0
- ARV discount +7.5/15.0
- DSCR +6.7/10.0
- Livability +3.9/5.0
- Rent growth +3.1/5.0
- Schools +3.0/10.0
- Condition / age +2.5/5.0
- Appreciation +0.0/10.0
$95,000
🖨 Deal sheet 📄 Offer letter ✓ Due diligence
Listing remarks MLS
There are no remarks available.
Key facts
- Recent updates
- Soaking tub
- Private full bath
Tags
Property features AI
Finance
- Other: Subdivision: OVERPASS POINT; Property used as residential
- HOA & community: Homeowners association with monthly fee; Association fee $860 per month; Pets permitted (pet rules apply)
Exterior
- Parking: 2 total parking spaces (2 open)
- Utilities: Public sewer; Culinary water
- Home design: Manufactured home; Built and currently standing
- Construction: Aluminum exterior; Asphalt roof; Ramp for accessibility
- Exterior features: Outbuildings; Landscaping: full
Interior
- Kitchen: Free-standing range/oven; Garbage disposal
- Bedrooms: 3 bedrooms on the main level
- Flooring: Carpet; Linoleum
- Bathrooms: 2 full bathrooms
- Heating & cooling: Forced air heating (gas central); Central air conditioning
- Interior features: Separate tub and shower in bath; Garbage disposal; Free-standing range/oven; Blinds on windows
Neighborhood map
What this means for you Summary
Snapshot
- This is a 3-bed/2.0-bath manufactured listed at $95k.
Deal economics
- At list price, monthly cash flow is $133 ($2k/yr) — positive.
- The deal already cash-flows at list — no discount required.
- Meets the 1% rule at list price ($2k rent vs $95k).
- Recommended offer: $92k (3.0% below list) — sets the bar for market timing.
Location & tenants
- Location reads 77/100 on livability (#52 in UT, #3,142 nationally) — a middle-class / working-renter tenant base. Strengths: commute A+, housing A+, cost of living A-; Watch: amenities F.
- Tooele District (town): math 32% / reading 34% proficiency, ranked #62 of 80 in UT (top 78%) — families likely to look elsewhere, expect single-tenant / working-renter base with shorter leases.
- Zoned schools: Copper Canyon School (math 22% / reading 22%, grade F, #509 of 585 statewide, top 88%, 468 students, 33% FRL); Clarke N. Johnsen Jr High (math 40% / reading 41%, grade F, #69 of 138 statewide, top 51%, 892 students, 45% FRL); Tooele High (math 23% / reading 37%, grade F, #119 of 171 statewide, top 71%, 1,768 students, 25% FRL) — zoned schools at 34% FRL track the district average.
- Market conditions: Rents rising (+2.5%/yr); 579 active listings in the ZIP; 10 comparable units currently listed for rent nearby; rentals at typical pace (median 22d on market — plan ~3-4 weeks tenant-placement turnaround); solid renter incomes; 867 units permitted in Tooele County in 2024 (87 in 5+ unit buildings).
Forward outlook
- Local home prices are declining (-3.0%/yr); year-one equity from $657 of loan paydown is wiped out by about $3k of value loss. Plan a longer hold.
- Tooele County population projected at +33% by 2050 — long-run rental-demand tailwind backs the buy-and-hold thesis.
Negotiation context
- It's been on market 41 days — a 3% lower offer ($92k) is reasonable based on typical stale-listing flexibility.
- 3 sale attempts since 17y ago with the ask held roughly flat each time — persistent listings suggest the price (not the market) is what's stuck; bring a comps-based counter.
Risks & watch-outs
- Watch-outs: HOA is 41% of rent.
- Climate carrying-cost: major flood risk; severe wildfire risk — expect insurance premiums to compound above CPI over the hold.
Questions for the listing agent
- It's been on market 41 days. Have you received any prior offers? Is the seller open to a 3% concession, seller financing, or rate buy-down credit?
- What does the HOA fee cover, when was the last increase, and are there any pending special assessments or reserve-fund shortfalls?
- Is there a deadline driving the sale (1031 exchange, divorce, estate, relocation)? That informs how much negotiation room exists.
- Schools are D-rated, which usually means shorter tenancies and higher turnover. Who's the typical renter profile here, and what's been the actual vacancy rate?
- What's the average days-on-market for RENTAL listings here right now (not sales)? A rising rental-DOM trend means longer vacancies and softer asking-rent achievability than the comps imply.
- What's the recent tenant-quality profile in this submarket — average credit score on applications, eviction rate, late-payment / NSF rate, and stable-employment percentage? A property-management company in the area should have these aggregated.
- How much new for-sale + rental construction is in the pipeline within 1–3 miles? Heavy new supply typically softens prices + rents 12–24 months out; constrained supply supports both.
Investment metrics
- 1% rule
- 2.20% ✓
- Cap rate
- 7.97%
- Cash-on-cash
- 6.01%
- DSCR
- 1.27
- GRM
- 3.8
CMA / ARV
No comps found within radius.
Projected returns pro-forma
-3.0% appreciation · 2.53% rent growth · sell at horizon
- IRR
- -7.5%
- Equity multiple
- 0.72×
- Total profit
- $-7,336
- Equity at exit
- $14,165
- IRR
- 1.5%
- Equity multiple
- 1.11×
- Total profit
- $2,813
- Equity at exit
- $8,214
Cash invested: $26,600 (down + closing). Projections, not guarantees.
Landlord ↔ Tenant lean methodology
- Overall (STATE)
- 86 Strongly Landlord-Friendly
- State Utah
- 86 Strongly Landlord-Friendly · R+15
- County
- — inherits STATE
- City
- — inherits STATE
ZIP-level market 84074
- Rents YoY
- 2.5%
- Active inventory
- 579
- Price-to-rent
- 3.8×
Monthly cashflow live
- Estimated rent
- $2,088 high interval (Pro) →
- Mortgage (P&I)
- −$498
- Tax est. 1.5%
- −$119 /mo · $1,425/yr
- Insurance
- −$40
- HOA
- −$860
- Vacancy / Maint / Mgmt
- −$439
- Net cashflow
- $133
Break-even live
UW: 25.0% down · 7.5% · 30yr · 1.5% tax · 5.0% vac · 8.0% maint · 8.0% mgmt
Financing live
Cash to close
- Down payment
- $23,750
- Closing costs
- $2,850
- Reserves months
- —
- Total cash needed
- —
Loan-product check · same deal, 3 products live
Conventional
25% down · 7.5% · 30yr
- Down + closing
- —
- Monthly P&I
- —
- Monthly cashflow
- —
- DSCR
- —
- Eligible?
- —
Personal DTI + credit; lowest rate.
DSCR
20% down · 8.5% · 30yr
- Down + closing
- —
- Monthly P&I
- —
- Monthly cashflow
- —
- DSCR
- —
- Eligible?
- —
No personal income docs; deal must DSCR.
Hard money
10% down · 12.0% · 12mo
- Down + closing
- —
- Monthly P&I
- —
- Monthly cashflow
- —
- DSCR
- —
- Eligible?
- —
Short-term bridge; refi at stabilization.
Rent comps 10 comps
| Address | Beds | Baths | Sqft | Rent | $/sqft | DOM | Units | Dist |
|---|---|---|---|---|---|---|---|---|
| 1731 Copper Canyon Dr Tooele, UT | 3.0 | 2.0 | 1399 | $1,985 | $1.42 | 14d | 1 | 0.21mi |
| 1908 N Patchwork Ave Tooele, UT | 4.0 | 2.5 | 1400 | $2,230 | $1.59 | 20d | 1 | 0.25mi |
| 1942 N 20 W Tooele, UT | 3.0 | 1.5 | 1298 | $1,850 | $1.43 | 23d | 1 | 0.53mi |
| 742 N 100 E Tooele, UT | 1.0–3.0 | 1.0–2.0 | 892 | $1,578 | $1.77 | 23d | 2 | 1.13mi |
| 739 N 160 E Unit A Tooele, UT | 3.0 | 2.0 | 1368 | $1,750 | $1.28 | 23d | 1 | 1.15mi |
| 135 E 730 N Unit 1 Tooele, UT | 3.0 | 2.0 | 1368 | $2,150 | $1.57 | 4d | 1 | 1.17mi |
| 728 N 160 E Tooele, UT | 3.0 | 2.0 | 1396 | $1,800 | $1.29 | 21d | 1 | 1.17mi |
| 116 E 730 N Unit 1 Tooele, UT | 3.0 | 2.0 | 1368 | $1,800 | $1.32 | 23d | 1 | 1.20mi |
| 71 W 740 N Tooele, UT | 3.0 | 2.0 | 1479 | $2,200 | $1.49 | 20d | 1 | 1.22mi |
| 1241 N Lexington Greens Dr Tooele, UT | 1.0–3.0 | 1.0–2.0 | 1006 | $1,799 | $1.79 | 3d | 40 | 1.23mi |
HOA detail
- Monthly dues
- $860 · $10,320/yr
Listing history 15 events
-
2026-06-09days on market $95,000 Active 41 DOM
-
2026-06-08days on market $95,000 Active 40 DOM
-
2026-06-07days on market $95,000 Active 39 DOM
-
2026-06-03days on market $95,000 Active 35 DOM
-
2026-06-02days on market $95,000 Active 34 DOM
-
2026-06-01days on market $95,000 Active 33 DOM
-
2026-05-31days on market $95,000 Active 32 DOM
-
2026-05-19price $95,000
-
2026-04-29$99,500 Active
-
2025-09-22soldstatus Closed 31-char remark
Show marketing remark (31 chars)
There are no remarks available.
-
2025-09-12status Under Contract 31-char remark
Show marketing remark (31 chars)
There are no remarks available.
-
2025-08-01price $109,900 31-char remark
Show marketing remark (31 chars)
There are no remarks available.
-
2025-06-20$120,000 Active 31-char remark
Show marketing remark (31 chars)
There are no remarks available.
-
2009-03-25soldstatus 31-char remark
Show marketing remark (31 chars)
There are no remarks available.
-
2009-01-06$29,999 31-char remark
Show marketing remark (31 chars)
There are no remarks available.
ⓘ Source: listings_history table (triggers on properties + properties_extension) + one-shot
backfill from property_details.listing_events for pre-trigger history.
Climate risk First Street
- Flood 6/10 Major FEMA zone X (unshaded) · 74% chance over 30 yrs
- Wildfire 8/10 Severe
- Heat 4/10 Moderate 2 d/yr ≥92°F today · 6 d/yr by 30 yrs out
- Wind 1/10 Low
- Air quality 3/10 Moderate 2 unhealthy d/yr today · 3 by 30 yrs out
Nearby sold comps map
Loading sold comps map…
Walkable amenities ~0.75 mi
Loading nearby amenities…
Taxation est. · year 1
- Rental income
- $25,059
- − Mortgage interest
- −$5,321
- − Property taxes
- −$1,425
- − Insurance
- −$475
- − Repairs & maintenance
- −$2,005
- − Management
- −$2,005
- − HOA
- −$10,320
- − Depreciation
- −$2,764
- Taxable income
- $744
- Est. tax owed @ 24.0%
- −$179
- After-tax cash flow
- $1,419/yr
For passive investors: Depreciation is non-cash, so a rental often shows a tax loss while cash-flowing — sheltering income. Rental losses are passive: they offset passive income freely, and up to $25,000/yr can offset ordinary (W-2) income if you actively participate and your MAGI is under $100k (phasing out to $0 by $150k); unused losses carry forward. On sale, claimed depreciation is recaptured at up to 25%, and gains may owe capital-gains tax (a 1031 exchange can defer both). Figures are a year-1 estimate at your 24.0% rate — not tax advice; consult a CPA.
Schools (NCES district)
- District
- Tooele District
- NCES district ID
- 4901050
- Math proficiency
- 32% ▼ -8.00%
- Reading proficiency
- 34% ▼ -6.00%
- Median HH income
- $63,054
- Composite
- 29.94/100
- National rank
- #6379
- State rank
- #62 of 80 in UT
Livability — Tooele
- Score
- 77/100
- State rank
- #52
- US rank
- #3142
Category grades
Schools grade is shown separately in the Schools card above.
Census & demographics
- Census place
- Tooele, UT
- County
- Tooele County · 59,706 people
- City population
- 59,706
- Metro
- Salt Lake City, UT
- Population (ZIP)
- 59,706
- Household income
- $108,341
- Rent vs Own
- Severe rent burden
- 355.0
Population outlook (Tooele County) Hauer SSP2
- Today (2025)
- 73,901 people
- By 2030
- 79,080 · +7.0%
- By 2040
- 89,127 · +20.6%
- By 2050
- 98,460 · +33.2%
- By 2075
- 115,767 · +56.7%
- By 2100
- 122,453 · +65.7%
Race, ethnicity, and origin ACS 2023
- Neighborhood character
- Predominantly White (78%)
- Race & ethnicity
- White 78% Hispanic / Latino 14% Two or more races 9% Pacific Islander 1% Black 1%
- Hispanic origin (detail)
- Mexican 11%
- Common ancestry
- Italian 5% Slovak 4% Portuguese 2%
- Foreign-born
- 3% · Canada
- Languages at home
- 90% English-only · Spanish 7% Other Asian/Pacific 1% Other Indo-European 1%
Political lean MEDSL · Tooele
- 2024 margin
- Solid R (+41.0) · D 28.1% · R 69.1% · Other 2.8%
- 2008→2024 swing
- -11.2pp toward R · 2008: -29.8pp · 2024: -41.0pp
- All cycles
- 2024: R+41.0 2020: R+38.3 2016: R+30.0 2012: R+51.4 2008: R+29.8
Not yet ingested
- Civics
- —
Market trends
- HPI YoY
- ▼ -206.55%
- Current HPI
- 244.981
- Rent YoY
- ▲ 2.53%
- Metro
- Salt Lake City, UT
- State GDP YoY
- ▲ 3.54%
- F500 in state
- 2
Industry mix (Fortune 500 HQ in UT)
| Industry | F500 HQs | Revenue |
|---|---|---|
| Financial Services | 1 | $3B |
|
||
Price history
+216.7% since first listed8 events — show timeline
- 2026-05-19 Price Changed $95,000 WFRMLS
- 2026-04-29 Listed $99,500 WFRMLS
- 2025-09-22 Sold (MLS) — WFRMLS
- 2025-09-12 Pending — WFRMLS
- 2025-08-01 Price Changed $109,900 WFRMLS
- 2025-06-20 Listed $120,000 WFRMLS
- 2009-03-25 Sold (MLS) — WFRMLS
- 2009-01-06 Listed $29,999 WFRMLS
Cash-flow waterfall
monthlySold comps — $/sqft
last 12 mo · ≤1 miLoading sold comps…