 🏗️ New Construction
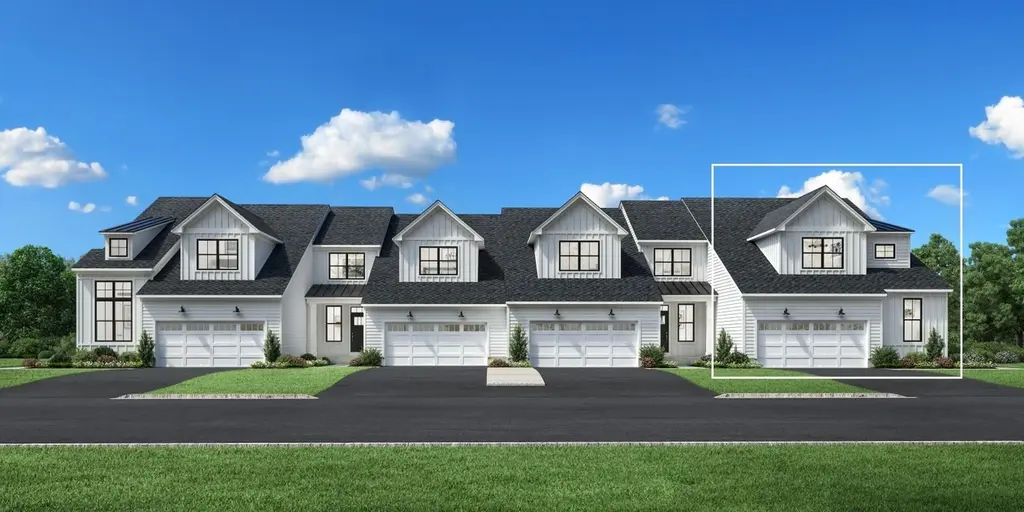
Wilkerson Plan · Thornwood, NY
Flood risk No data
- FEMA flood zone
- —
- Chance of flooding over 30 yrs
- —
- Est. flood insurance / yr
- —
Fire risk No data
- Est. fire insurance / yr
- —
Heat risk No data
- Hot days now (above threshold)
- —
- Hot days in 30 yrs
- —
Wind risk No data
- Chance of severe wind over 30 yrs
- —
Air-quality risk No data
- Unhealthy air days now
- —
- Unhealthy air days in 30 yrs
- —
Risk factors via First Street. Map © Google.
Why this score? — see what drove the C grade
The composite is a weighted blend of 9 inputs, each scored 0–100. Each bar is that input's sub-score; the figure is the points it added to the 100-point composite (weight × sub-score).
- Cash flow +20.6/30.0
- ARV discount +7.5/15.0
- DSCR +6.6/10.0
- Schools +6.0/10.0
- 1% rule +5.4/10.0
- Condition / age +4.8/5.0
- Livability +3.6/5.0
- Rent growth +2.5/5.0
- Appreciation +0.0/10.0
$1,244,995
🖨 Deal sheet 📄 Offer letter ✓ Due diligence
Listing remarks
The Wilkerson leaves a lasting impression with a stunning two-story floor plan with luxury living spaces. A charming foyer with soffit ceiling is open to the lovely two-story casual dining area and great room with rear yard access. The kitchen expertly designed, featuring a large center island with breakfast bar, plenty of counter and cabinet space, and an ample walk-in pantry. Complementing the secluded primary bedroom suite is a generous walk-in closet and an alluring primary bath with dual-sink vanity, a large luxe shower with seat, linen storage, and a private water closet. On the second floor, secondary bedrooms feature walk-in closets and share a hall bath with separate dual-sink vani
Key facts
- Large center island
- Ample walk in pantry
- Two story floor plan
Tags
Property features AI
Finance
- Financial info: List price $1,230,995
Exterior
- Parking: 2 total parking spaces; 2-car garage
- Home design: Single-family plan home; Listed as new construction (Plan)
- Exterior features: Living area approximately 2970
Interior
- Bedrooms: 3 bedrooms
- Bathrooms: 2 full bathrooms and 1 half bathroom (2.5 total)
- Interior features: Plan: Wilkerson
Neighborhood map
What this means for you Summary
Snapshot
- This is a 3-bed/2.5-bath townhouse listed at $1.24M. Condition is rated excellent.
Deal economics
- At list price, monthly cash flow is $2k ($20k/yr) — positive.
- The deal already cash-flows at list — no discount required.
- Meets the 1% rule at list price ($13k rent vs $1.24M).
- Cap rate 7.9% vs local median 5.7% in Thornwood — top-decile yield for the area; either an underpriced asset or a hidden risk that comps aren't pricing in. Stress-test before assuming the spread holds.
Location & tenants
- Location reads 71/100 on livability (#389 in NY) — a middle-class / working-renter tenant base. Strengths: schools A+, crime A+, employment A+; Watch: amenities F, commute F, cost of living F.
- Mount Pleasant Central School District (suburban): math 62% / reading 65% proficiency, ranked #146 of 590 in NY (top 25%) — acceptable for families but not a draw, mixed tenant base, ~2y average lease; only 5% free/reduced lunch — higher-income household profile.
- Market conditions: 28 active listings in the ZIP; 1 comparable units currently listed for rent nearby; 954 units permitted in Westchester County in 2024 (649 in 5+ unit buildings).
Forward outlook
- Local home prices are declining (-3.0%/yr); year-one equity from $9k of loan paydown is wiped out by about $37k of value loss. Plan a longer hold.
- Westchester County population projected at +10% by 2050 — modest demand growth; plan on rents tracking national, not racing it.
Negotiation context
- Only 12 days on market — expect competitive offers; lowballing is unlikely to land.
Questions for the listing agent
- Is there a deadline driving the sale (1031 exchange, divorce, estate, relocation)? That informs how much negotiation room exists.
- Schools are A-rated — typically a magnet for longer-tenancy family renters. What's the average tenant stay here, and is there a school-zone premium baked into asking?
- What's the average days-on-market for RENTAL listings here right now (not sales)? A rising rental-DOM trend means longer vacancies and softer asking-rent achievability than the comps imply.
- What's the recent tenant-quality profile in this submarket — average credit score on applications, eviction rate, late-payment / NSF rate, and stable-employment percentage? A property-management company in the area should have these aggregated.
- How much new for-sale + rental construction is in the pipeline within 1–3 miles? Heavy new supply typically softens prices + rents 12–24 months out; constrained supply supports both.
Investment metrics
- 1% rule
- 1.04% ✓
- Cap rate
- 7.90%
- Cash-on-cash
- 5.73%
- DSCR
- 1.26
- GRM
- 8.0
CMA / ARV
No comps found within radius.
Projected returns pro-forma
-3.0% appreciation · 3.0% rent growth · sell at horizon
- IRR
- -7.4%
- Equity multiple
- 0.73×
- Total profit
- $-95,481
- Equity at exit
- $185,633
- IRR
- 2.2%
- Equity multiple
- 1.16×
- Total profit
- $54,230
- Equity at exit
- $107,644
Cash invested: $348,599 (down + closing). Projections, not guarantees.
Landlord ↔ Tenant lean methodology
- Overall (STATE)
- 15 Strongly Tenant-Friendly
- State New York
- 15 Strongly Tenant-Friendly · D+10
- County
- — inherits STATE
- City
- — inherits STATE
ZIP-level market 10595
- Home prices YoY
- -17.7%
- Active inventory
- 28
- Price-to-rent
- 8.0×
Monthly cashflow live
- Estimated rent
- $12,999 medium interval (Pro) →
- Mortgage (P&I)
- −$6,529
- Tax est. 1.5%
- −$1,556 /mo · $18,675/yr
- Insurance
- −$519
- HOA
- −$0
- Vacancy / Maint / Mgmt
- −$2,730
- Net cashflow
- $1,665
Break-even live
UW: 25.0% down · 7.5% · 30yr · 1.5% tax · 5.0% vac · 8.0% maint · 8.0% mgmt
Financing live
Cash to close
- Down payment
- $311,249
- Closing costs
- $37,350
- Reserves months
- —
- Total cash needed
- —
Loan-product check · same deal, 3 products live
Conventional
25% down · 7.5% · 30yr
- Down + closing
- —
- Monthly P&I
- —
- Monthly cashflow
- —
- DSCR
- —
- Eligible?
- —
Personal DTI + credit; lowest rate.
DSCR
20% down · 8.5% · 30yr
- Down + closing
- —
- Monthly P&I
- —
- Monthly cashflow
- —
- DSCR
- —
- Eligible?
- —
No personal income docs; deal must DSCR.
Hard money
10% down · 12.0% · 12mo
- Down + closing
- —
- Monthly P&I
- —
- Monthly cashflow
- —
- DSCR
- —
- Eligible?
- —
Short-term bridge; refi at stabilization.
Rent comps 1 comps
| Address | Beds | Baths | Sqft | Rent | $/sqft | DOM | Units | Dist |
|---|---|---|---|---|---|---|---|---|
| 10 Foxwood Ln Thornwood, NY | 4.0 | 3.5 | 2026 | $12,999 | $6.42 | 44d | 1 | 0.89mi |
Listing history 9 events
-
2026-06-18days on market $1,244,995 Active 12 DOM
-
2026-06-17days on market $1,244,995 Active 11 DOM
-
2026-06-16pricedays on market $1,244,995 Active 10 DOM
-
2026-06-15days on market $1,230,995 Active 9 DOM
-
2026-06-13days on market $1,230,995 Active 7 DOM
-
2026-06-09days on market $1,230,995 Active 3 DOM
-
2026-06-08days on market $1,230,995 Active 2 DOM
-
2026-06-07remarks 699-char remark
-
2026-06-07$1,230,995 Active 1 DOM
ⓘ Source: listings_history table (triggers on properties + properties_extension) + one-shot
backfill from property_details.listing_events for pre-trigger history.
Nearby sold comps map
Loading sold comps map…
Walkable amenities ~0.75 mi
Loading nearby amenities…
Taxation est. · year 1
- Rental income
- $155,988
- − Mortgage interest
- −$69,739
- − Property taxes
- −$18,675
- − Insurance
- −$6,225
- − Repairs & maintenance
- −$12,479
- − Management
- −$12,479
- − Depreciation
- −$36,218
- Taxable income
- $173
- Est. tax owed @ 24.0%
- −$41
- After-tax cash flow
- $19,942/yr
For passive investors: Depreciation is non-cash, so a rental often shows a tax loss while cash-flowing — sheltering income. Rental losses are passive: they offset passive income freely, and up to $25,000/yr can offset ordinary (W-2) income if you actively participate and your MAGI is under $100k (phasing out to $0 by $150k); unused losses carry forward. On sale, claimed depreciation is recaptured at up to 25%, and gains may owe capital-gains tax (a 1031 exchange can defer both). Figures are a year-1 estimate at your 24.0% rate — not tax advice; consult a CPA.
Condition & rehab AI · 2 photos
The Wilkerson townhouse is in excellent condition with no visible repairs or maintenance needed. It offers a well-designed floor plan and is move-in ready, making it an attractive option for both resale and rental markets.
Value-add opportunities
- Both Painting exterior siding — Fresh paint can enhance curb appeal and property value.
- Both Landscaping improvements — Enhanced landscaping can improve curb appeal and attract potential buyers/tenants.
- Both Interior touch-ups — Fresh paint and minor touch-ups can improve the home's appearance and attract more interest from buyers/tenants.
Renovation cost estimate screening
Value-add ROI direction
- Both Painting exterior siding — Fresh paint can enhance curb appeal and property value. ↑
- Both Landscaping improvements — Enhanced landscaping can improve curb appeal and attract potential buyers/tenants. ↑
- Both Interior touch-ups — Fresh paint and minor touch-ups can improve the home's appearance and attract more interest from buyers/tenants. ↑
ⓘ Cost ranges are severity-bucket heuristics (US national rule-of-thumb). Get contractor quotes + a written scope before underwriting a rehab budget.
Schools (NCES district)
- District
- Mount Pleasant Central School District
- NCES district ID
- 3620160
- Math proficiency
- 62% ▼ -16.00%
- Reading proficiency
- 65% ▲ 3.00%
- Median HH income
- $109,054
- Composite
- 59.62/100
- National rank
- #911
- State rank
- #146 of 590 in NY
Livability — Thornwood
- Score
- 71/100
- State rank
- #389
- US rank
- #6724
Category grades
Schools grade is shown separately in the Schools card above.
Census & demographics
- City population
- 7,180
- Population (ZIP)
- 7,180
Population outlook (Westchester County) Hauer SSP2
- Today (2025)
- 1,028,035 people
- By 2030
- 1,051,636 · +2.3%
- By 2040
- 1,098,520 · +6.9%
- By 2050
- 1,136,044 · +10.5%
- By 2075
- 1,196,925 · +16.4%
- By 2100
- 1,175,147 · +14.3%
Race, ethnicity, and origin ACS 2023
- Neighborhood character
- Predominantly White (68%)
- Race & ethnicity
- White 68% Hispanic / Latino 13% Black 9% Asian 7% Two or more races 6%
- Hispanic origin (detail)
- Mexican 1% Puerto Rican 3% Dominican 2%
- Common ancestry
- Romanian 3% Italian 2% Armenian 2%
- Foreign-born
- 17% · Canada, Jamaica, China
- Languages at home
- 73% English-only · Other Indo-European 9% Spanish 8% Russian/Polish/Slavic 2%
Political lean MEDSL · Westchester
- 2024 margin
- Strong D (+26.3) · D 63.1% · R 36.9%
- 2008→2024 swing
- -1.3pp toward R · 2008: 27.6pp · 2024: 26.3pp
- All cycles
- 2024: D+26.3 2020: D+36.3 2016: D+32.8 2012: D+22.2 2008: D+27.6
Not yet ingested
- Civics
- —
Market trends
- HPI YoY
- ▼ -62.54%
- Current HPI
- 290.8983
- Rent YoY
- —
- Metro
- —
- State GDP YoY
- ▲ 2.60%
- F500 in state
- 92
Industry mix (Fortune 500 HQ in NY)
| Industry | F500 HQs | Revenue |
|---|---|---|
| Financial Services | 10 | $950B |
|
||
| Consumer Goods | 9 | $162B |
|
||
| Insurance | 4 | $225B |
|
||
| Telecommunications | 2 | $144B |
|
||
| Pharmaceuticals | 2 | $112B |
|
||
| Media / Entertainment | 2 | $69B |
|
||
Cash-flow waterfall
monthlySold comps — $/sqft
last 12 mo · ≤1 miLoading sold comps…