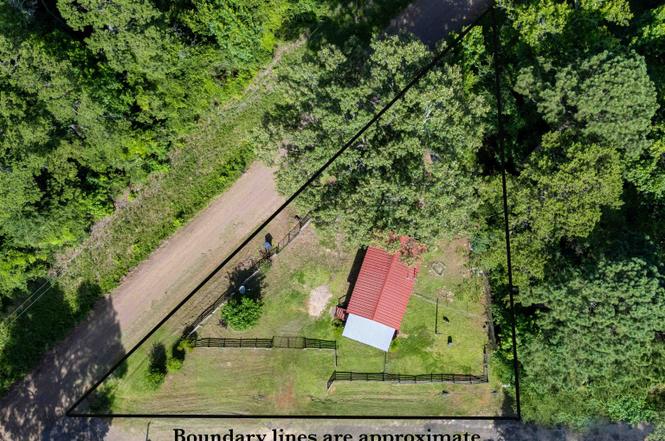
200 Dog Wood Dr · Pine Harbor, TX
Flood risk 1/10 · Minimal
- FEMA flood zone
- —
- Chance of flooding over 30 yrs
- 0.0%
- Est. flood insurance / yr
- —
Fire risk 2/10 · Minimal
- Est. fire insurance / yr
- $1,222 – $2,270
Heat risk 7/10 · Major
- Hot days now (above 110°F)
- 7 days/yr
- Hot days in 30 yrs
- 24 days/yr
Wind risk 6/10 · Moderate
- Chance of severe wind over 30 yrs
- 61.0%
Air-quality risk 2/10 · Minimal
- Unhealthy air days now
- 1 days/yr
- Unhealthy air days in 30 yrs
- 1 days/yr
Risk factors via First Street. Map © Google.
Why this score? — see what drove the D- grade
The composite is a weighted blend of 9 inputs, each scored 0–100. Each bar is that input's sub-score; the figure is the points it added to the 100-point composite (weight × sub-score).
- Cash flow +14.4/30.0
- ARV discount +7.5/15.0
- DSCR +4.4/10.0
- 1% rule +3.0/10.0
- Rent growth +2.5/5.0
- Livability +2.5/5.0
- Condition / age +2.5/5.0
- Schools +2.3/10.0
- Appreciation +0.0/10.0
$99,900
🖨 Deal sheet (PDF) 📄 Offer letter ✓ Due diligence
Listing remarks MLS
Charming and cozy one-bedroom, one-bath home located at Lake O the Pines. This home has 540 sq. ft. of comfortable living space featuring an updated modern kitchen with stainless steel appliances, a spacious living area with fireplace, and thoughtful details throughout. Enjoy relaxing on the covered front porch overlooking the fenced yard, perfect for pets or outdoor gatherings. A convenient storage building provides additional space for tools or hobbies. Property also has 30 amp plug for RV hookup. Ideal for a weekend getaway, downsizing, or investment property near Historic Jefferson, TX. Just blocks away from the boat ramp and fishing dock for the avid fisherman. Don’t miss this affordable and move-in-ready gem! Call to see today.
Key facts
- Turn-key convenience
- Fully fenced
- Inviting front porch
Tags
Property features AI
Finance
- Other: Property is on an irregular lot of approximately 0.176 acres
- HOA & community: Homeowners association with a $50 annual fee (about $4.17/month)
Exterior
- Utilities: Septic tank
- Home design: Single family residence; Residential property; Corner, level lot
- Exterior features: Covered porch; Wood fence; Storage structure
Interior
- Kitchen: Dishwasher; Microwave; Refrigerator
- Bedrooms: 2 total rooms
- Flooring: Vinyl
- Bathrooms: 1 full bathroom
- Heating & cooling: Ceiling fan(s); Window unit(s)
- Interior features: Ceiling fan(s); Window unit(s)
- Laundry & utility: Electric water heater
Neighborhood map
What this means for you Summary
Snapshot
- This is a 1-bed/1.0-bath single-family listed at $100k.
Deal economics
- At list price, monthly cash flow is $21 ($248/yr) — positive.
- The deal already cash-flows at list — no discount required.
- To meet the 1% rule (rent ≥ 1% of price), the offer needs to be $79k (20.5% below list).
- Recommended offer: $79k (20.5% below list) — sets the bar for 1% rule.
Location & tenants
- Location reads 50/100 on livability (#1,494 in TX) — a working-class tenant base; expect higher turnover. Strengths: cost of living A+; Watch: crime F, amenities F, commute F.
- Jefferson ISD (rural): math 23% / reading 33% proficiency, ranked #689 of 826 in TX (top 83%) — low school quality limits family demand, transient renter base, plan for 1-2y turnover.
- Zoned schools: Jefferson El (math 22% / reading 32%, grade F, #2,791 of 4,322 statewide, top 68%, 275 students, 75% FRL); Jefferson J H (math 23% / reading 29%, grade F, #1,222 of 1,662 statewide, top 74%, 333 students, 73% FRL); Jefferson H S (math 27% / reading 52%, grade F, #821 of 1,632 statewide, top 53%, 380 students, 66% FRL) — zoned schools average 71% FRL vs 43% district-wide (28 pts higher); higher-poverty schools than district average — tighter screening recommended.
- Market conditions: 194 active listings in the ZIP; 8 units permitted in Marion County in 2024 (0 in 5+ unit buildings).
Forward outlook
- Local home prices are declining (-3.0%/yr); year-one equity from $691 of loan paydown is wiped out by about $3k of value loss. Plan a longer hold.
- Marion County population projected at -20% by 2050 — secular population decline; favor cash flow + early exit over multi-decade hold.
Negotiation context
- Only 6 days on market — expect competitive offers; lowballing is unlikely to land.
- 4 sale attempts since 3y ago with the ask held roughly flat each time — persistent listings suggest the price (not the market) is what's stuck; bring a comps-based counter.
Risks & watch-outs
- Climate carrying-cost: major wind risk, 61% chance of damaging wind over 30y; extreme-heat days projected 7→24/yr by 2055 (HVAC capex compounding) — expect insurance premiums to compound above CPI over the hold.
Questions for the listing agent
- What does the HOA fee cover, when was the last increase, and are there any pending special assessments or reserve-fund shortfalls?
- Is there a deadline driving the sale (1031 exchange, divorce, estate, relocation)? That informs how much negotiation room exists.
- Schools are F-rated, which usually means shorter tenancies and higher turnover. Who's the typical renter profile here, and what's been the actual vacancy rate?
- Crime grade is F in this area — have there been break-ins, vandalism, or insurance claims at this property in the last 3 years? What carrier currently insures it and at what premium?
- The area grade is low — what's the realistic commute time and amenity access for the typical tenant pool here? Any planned neighborhood developments (good or bad) we should know about?
- What's the average days-on-market for RENTAL listings here right now (not sales)? A rising rental-DOM trend means longer vacancies and softer asking-rent achievability than the comps imply.
- What's the recent tenant-quality profile in this submarket — average credit score on applications, eviction rate, late-payment / NSF rate, and stable-employment percentage? A property-management company in the area should have these aggregated.
- How much new for-sale + rental construction is in the pipeline within 1–3 miles? Heavy new supply typically softens prices + rents 12–24 months out; constrained supply supports both.
Investment metrics
- 1% rule
- 0.80% ✗
- Cap rate
- 6.54%
- Cash-on-cash
- 0.89%
- DSCR
- 1.04
- GRM
- 10.5
CMA / ARV
No comps found within radius.
Projected returns pro-forma
-3.0% appreciation · 3.0% rent growth · sell at horizon
- IRR
- -14.9%
- Equity multiple
- 0.47×
- Total profit
- $-14,911
- Equity at exit
- $14,895
- IRR
- -6.4%
- Equity multiple
- 0.59×
- Total profit
- $-11,449
- Equity at exit
- $8,638
Cash invested: $27,972 (down + closing). Projections, not guarantees.
Landlord ↔ Tenant lean methodology
- Overall (STATE)
- 87 Strongly Landlord-Friendly
- State Texas
- 87 Strongly Landlord-Friendly · R+5
- County
- — inherits STATE
- City
- — inherits STATE
ZIP-level market 75657
- Home prices YoY
- -9.7%
- Active inventory
- 194
- Price-to-rent
- 10.5×
Monthly cashflow live
- Estimated rent
- $795 medium interval (Pro) →
- Mortgage (P&I)
- −$524
- Tax from tax record
- −$38 /mo · $451/yr
- Insurance
- −$42
- HOA
- −$4
- Vacancy / Maint / Mgmt
- −$167
- Net cashflow
- $21
Break-even live
Sensitivity live
| Price | -10% $77 | -5% $49 | +0% $21 | +5% $-8 | +10% $-36 |
|---|---|---|---|---|---|
| Rent | -10% $-42 | -5% $-11 | +0% $21 | +5% $52 | +10% $83 |
| Rate | -1.0pp $71 | -0.5pp $46 | base $21 | +0.5pp $-5 | +1.0pp $-32 |
UW: 25.0% down · 7.5% · 30yr · 1.5% tax · 5.0% vac · 8.0% maint · 8.0% mgmt
Financing live
Cash to close
- Down payment
- $24,975
- Closing costs
- $2,997
- Reserves months
- —
- Total cash needed
- —
Loan-product check · same deal, 3 products live
Conventional
25% down · 7.5% · 30yr
- Down + closing
- —
- Monthly P&I
- —
- Monthly cashflow
- —
- DSCR
- —
- Eligible?
- —
Personal DTI + credit; lowest rate.
DSCR
20% down · 8.5% · 30yr
- Down + closing
- —
- Monthly P&I
- —
- Monthly cashflow
- —
- DSCR
- —
- Eligible?
- —
No personal income docs; deal must DSCR.
Hard money
10% down · 12.0% · 12mo
- Down + closing
- —
- Monthly P&I
- —
- Monthly cashflow
- —
- DSCR
- —
- Eligible?
- —
Short-term bridge; refi at stabilization.
HOA detail
- Monthly dues
- $4 · $48/yr
Listing history 6 events
-
2026-06-22days on market $99,900 Active 6 DOM
-
2026-06-19days on market $99,900 Active 4 DOM
-
2026-06-18days on market $99,900 Active 3 DOM
-
2026-06-17days on market $99,900 Active 2 DOM
-
2026-06-15remarks 699-char remark
-
2026-06-15$99,900 Active 1 DOM
ⓘ Source: listings_history table (triggers on properties + properties_extension) + one-shot
backfill from property_details.listing_events for pre-trigger history.
Tax reassessment forecast TX · Resets to sale price
- Current annual tax
- $451 · $38/mo
- Projected year-2 tax
- $1,828 · $152/mo
- Expected delta
- +$1,377/yr (+$115/mo · 305.6%)
ⓘ Screening estimate from a state-policy table — verify with the county assessor before closing.
Climate risk First Street
- Flood 1/10 Low 0% chance over 30 yrs
- Wildfire 2/10 Low
- Heat 7/10 Severe 7 d/yr ≥110°F today · 24 d/yr by 30 yrs out
- Wind 6/10 Major 61% chance of damaging wind over 30 yrs
- Air quality 2/10 Low 1 unhealthy d/yr today · 1 by 30 yrs out
Nearby sold comps map
Loading sold comps map…
Walkable amenities ~0.75 mi
Loading nearby amenities…
Taxation est. · year 1
- Rental income
- $9,535
- − Mortgage interest
- −$5,596
- − Property taxes
- −$451
- − Insurance
- −$500
- − Repairs & maintenance
- −$763
- − Management
- −$763
- − HOA
- −$48
- − Depreciation
- −$2,906
- Taxable loss
- −$1,491
- Est. tax savings @ 24.0%
- +$358
- After-tax cash flow
- $606/yr
For passive investors: Depreciation is non-cash, so a rental often shows a tax loss while cash-flowing — sheltering income. Rental losses are passive: they offset passive income freely, and up to $25,000/yr can offset ordinary (W-2) income if you actively participate and your MAGI is under $100k (phasing out to $0 by $150k); unused losses carry forward. On sale, claimed depreciation is recaptured at up to 25%, and gains may owe capital-gains tax (a 1031 exchange can defer both). Figures are a year-1 estimate at your 24.0% rate — not tax advice; consult a CPA.
Schools (NCES district)
- District
- Jefferson ISD
- NCES district ID
- 4824730
- Math proficiency
- 23% ▼ -8.00%
- Reading proficiency
- 33% ▼ -4.00%
- Median HH income
- $33,504
- Composite
- 22.93/100
- National rank
- #7992
- State rank
- #689 of 826 in TX
Livability — Pine Harbor
- Score
- 50/100
- State rank
- #1494
- US rank
- #25521
Category grades
Schools grade is shown separately in the Schools card above.
Census & demographics
- Census place
- Pine Harbor, TX
- Population (ZIP)
- 6,842
Population outlook (Marion County) Hauer SSP2
- Today (2025)
- 9,339 people
- By 2030
- 8,881 · -4.9%
- By 2040
- 8,044 · -13.9%
- By 2050
- 7,449 · -20.2%
- By 2075
- 6,638 · -28.9%
- By 2100
- 5,871 · -37.1%
Race, ethnicity, and origin ACS 2023
- Neighborhood character
- Predominantly White (71%)
- Race & ethnicity
- White 71% Black 22% Two or more races 3% Hispanic / Latino 3% Native American 1%
- Common ancestry
- Iranian 2% Slovak 2% Lithuanian 2%
- Foreign-born
- 2% · Canada
- Languages at home
- 98% English-only · Spanish 1%
Political lean MEDSL · Marion
- 2024 margin
- Solid R (+52.5) · D 23.4% · R 75.9%
- 2008→2024 swing
- -30.8pp toward R · 2008: -21.7pp · 2024: -52.5pp
- All cycles
- 2024: R+52.5 2020: R+43.8 2016: R+43.1 2012: R+29.1 2008: R+21.7
Not yet ingested
- Civics
- —
Market trends
- HPI YoY
- ▼ -13.60%
- Current HPI
- 126.2671
- Rent YoY
- —
- Metro
- —
- State GDP YoY
- ▲ 3.95%
- F500 in state
- 110
Industry mix (Fortune 500 HQ in TX)
| Industry | F500 HQs | Revenue |
|---|---|---|
| Energy | 16 | $1,198B |
|
||
| Technology | 5 | $198B |
|
||
| Engineering / Construction | 4 | $72B |
|
||
| Energy Services | 3 | $60B |
|
||
| Utilities | 3 | $41B |
|
||
| Healthcare | 2 | $330B |
|
||
Price history
+81.6% since first listed10 events — show timeline
- 2026-06-15 Listed $99,900 LAAR
- 2026-02-24 Sold (Public Records) — Public Records
- 2026-02-20 Sold (MLS) — LAAR
- 2026-02-04 Pending — LAAR
- 2025-11-10 Listed $75,500 LAAR
- 2023-10-31 Sold (MLS) — LAAR
- 2023-10-02 Pending — LAAR
- 2023-09-01 Relisted — LAAR
- 2023-08-08 Delisted — LAAR
- 2023-08-02 Listed $55,000 LAAR
Property tax history
+9.9%/yrLatest (2025): $451 · +5.7% YoY. Source: county tax records.
Cash-flow waterfall
monthlySold comps — $/sqft
last 12 mo · ≤1 miLoading sold comps…