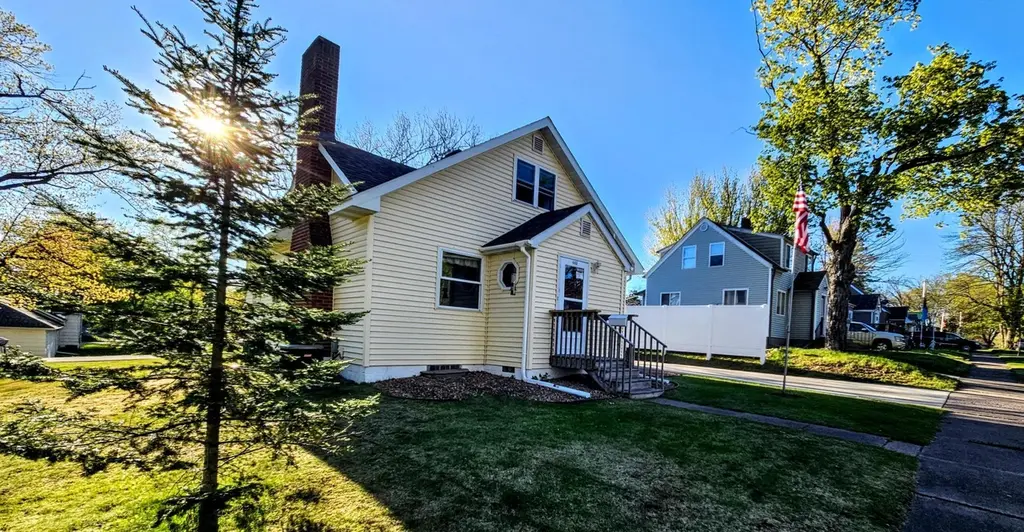
443 Morrison St · Mora, MN
Flood risk 1/10 · Minimal
- FEMA flood zone
- —
- Chance of flooding over 30 yrs
- 0.0%
- Est. flood insurance / yr
- —
Fire risk 2/10 · Minimal
- Est. fire insurance / yr
- $888 – $1,650
Heat risk 2/10 · Minimal
- Hot days now (above 98°F)
- 7 days/yr
- Hot days in 30 yrs
- 13 days/yr
Wind risk 1/10 · Minimal
- Chance of severe wind over 30 yrs
- —
Air-quality risk 2/10 · Minimal
- Unhealthy air days now
- 1 days/yr
- Unhealthy air days in 30 yrs
- 1 days/yr
Risk factors via First Street. Map © Google.
Why this score? — see what drove the C- grade
The composite is a weighted blend of 9 inputs, each scored 0–100. Each bar is that input's sub-score; the figure is the points it added to the 100-point composite (weight × sub-score).
- ARV discount +15.0/15.0
- Cash flow +10.4/30.0
- Appreciation +8.1/10.0
- Schools +4.3/10.0
- Livability +3.7/5.0
- DSCR +3.0/10.0
- 1% rule +2.7/10.0
- Rent growth +2.5/5.0
- Condition / age +2.5/5.0
$229,700
🖨 Deal sheet 📄 Offer letter ✓ Due diligence
Listing remarks
There is a certain kind of home that feels steady the moment you arrive - rooted, enduring, quietly proud of its place in the town. Built in 1946, just as the world was stepping into a new era of hope and rebuilding, this Mora home carries the unmistakable charm of a property that has been loved and cared for across generations. The current owners have tended to it with exceptional attention. ensuring that every small detail has been thoughtfully maintained. Set on an expansive corner lot in the heart of Mora, the home offers unbeatable proximity to downtown conveniences and the restaurants and shops along Highway 65. The neighborhood is tidy, welcoming, and anchored by the kind of communit
Key facts
- Backyard patio
- Majestic oak trees
- Corner lot
Tags
Property features AI
Finance
- Financial info: Free and clear mortgage status
Exterior
- Parking: Detached parking areas with concrete and other driveway surfaces; 2-car garage with 16x30 dimensions, 7' high by 9' wide door, garage door opener; Parking garage
- Utilities: City water (in street); City sewer (in street); 100 Amp electric service; Electric provided by East Central Energy; Natural gas
- Home design: Residential property; One and one-half levels; Entry level: Main
- Construction: Block and frame construction; Block foundation; Roof: asphalt and rubber (age 8 years or less); Foundation dimensions approximately 29 x 30
- Exterior features: Vinyl exterior; Patio; Vinyl fencing; Storage shed; Corner lot with light to medium tree coverage; City street frontage; public maintained road
Interior
- Kitchen: Dishwasher; Range; Refrigerator; Exhaust fan; Kitchen window
- Bedrooms: 3 bedrooms (one bedroom on upper level, two on main level)
- Bathrooms: 1 full bath and 2 half baths (half bath in basement, full bath on main level, full bath on upper level)
- Heating & cooling: Forced air heating; Central air conditioning
- Interior features: Ceiling fan(s); Eat-in kitchen; Patio access; Partially finished basement; Storage space; Drainage system in basement; Wood-burning fireplace in living room
- Laundry & utility: Laundry room with sink; Washer hookup; Gas dryer hookup; Laundry located in lower/basement level
Neighborhood map
What this means for you Summary
Snapshot
- This is a 3-bed/3.0-bath single-family listed at $230k.
Deal economics
- At list price, monthly cash flow is $-120 ($-1k/yr) — negative.
- To cash-flow at today's rent, offer at most $208k (9.2% below list).
- To meet the 1% rule (rent ≥ 1% of price), the offer needs to be $178k (22.7% below list).
- Recommended offer: $178k (22.7% below list) — sets the bar for 1% rule.
- Cap rate 5.7% vs local median 4.0% in Mora — top-decile yield for the area; either an underpriced asset or a hidden risk that comps aren't pricing in. Stress-test before assuming the spread holds.
Location & tenants
- Location reads 74/100 on livability (#207 in MN, #4,362 nationally) — a middle-class / working-renter tenant base. Strengths: cost of living A+, housing A+, crime A; Watch: employment D+, health & safety D+, amenities F.
- Mora Public School District (town): math 44% / reading 58% proficiency, ranked #115 of 301 in MN (top 38%) — acceptable for families but not a draw, mixed tenant base, ~2y average lease.
- Market conditions: 108 active listings in the ZIP; 1 comparable units currently listed for rent nearby; 59 units permitted in Kanabec County in 2024 (0 in 5+ unit buildings).
Forward outlook
- In year one you build about $16k of equity ($2k loan paydown + $14k appreciation (6.2% local appreciation)).
- Kanabec County population projected at -25% by 2050 — secular population decline; favor cash flow + early exit over multi-decade hold.
- By year 3, paydown + projected appreciation supports a ~$39k cash-out refi (75% LTV) — recoverable capital for the next deal without selling this one.
Negotiation context
- Only 3 days on market — expect competitive offers; lowballing is unlikely to land.
Risks & watch-outs
- Watch-outs: built in 1946 — expect roof / HVAC / electrical / plumbing capex.
Questions for the listing agent
- What do current leases actually rent for vs. the listed asking? Can we see a recent rent roll and the last 12 months of T-12 income?
- Built in 1946 — when were the roof, HVAC, electrical panel, plumbing, and water heater last replaced?
- Is there a deadline driving the sale (1031 exchange, divorce, estate, relocation)? That informs how much negotiation room exists.
- Schools are B-rated — typically a magnet for longer-tenancy family renters. What's the average tenant stay here, and is there a school-zone premium baked into asking?
- What's the average days-on-market for RENTAL listings here right now (not sales)? A rising rental-DOM trend means longer vacancies and softer asking-rent achievability than the comps imply.
- What's the recent tenant-quality profile in this submarket — average credit score on applications, eviction rate, late-payment / NSF rate, and stable-employment percentage? A property-management company in the area should have these aggregated.
- How much new for-sale + rental construction is in the pipeline within 1–3 miles? Heavy new supply typically softens prices + rents 12–24 months out; constrained supply supports both.
Investment metrics
- 1% rule
- 0.77% ✗
- Cap rate
- 5.67%
- Cash-on-cash
- -2.24%
- DSCR
- 0.90
- GRM
- 10.8
CMA / ARV
- ARV (median comp)
- $294,364
- List price
- $229,700
- Delta
- -21.97%
- Verdict
- UNDERPRICED
- Comps
- 1 within 2.0 mi
Projected returns pro-forma
6.15% appreciation · 3.0% rent growth · sell at horizon
- IRR
- 13.9%
- Equity multiple
- 1.94×
- Total profit
- $60,702
- Equity at exit
- $146,569
- IRR
- 14.3%
- Equity multiple
- 3.86×
- Total profit
- $183,982
- Equity at exit
- $267,690
Cash invested: $64,316 (down + closing). Projections, not guarantees.
Landlord ↔ Tenant lean methodology
- Overall (STATE)
- 46 Balanced
- State Minnesota
- 46 Balanced · D+2
- County
- — inherits STATE
- City
- — inherits STATE
ZIP-level market 55051
- Home prices YoY
- 2.0%
- Active inventory
- 108
- Price-to-rent
- 10.8×
Monthly cashflow live
- Estimated rent
- $1,775 medium interval (Pro) →
- Mortgage (P&I)
- −$1,205
- Tax from tax record
- −$222 /mo · $2,664/yr
- Insurance
- −$96
- HOA
- −$0
- Vacancy / Maint / Mgmt
- −$373
- Net cashflow
- $-120
Break-even live
UW: 25.0% down · 7.5% · 30yr · 1.5% tax · 5.0% vac · 8.0% maint · 8.0% mgmt
Financing live
Cash to close
- Down payment
- $57,425
- Closing costs
- $6,891
- Reserves months
- —
- Total cash needed
- —
Loan-product check · same deal, 3 products live
Conventional
25% down · 7.5% · 30yr
- Down + closing
- —
- Monthly P&I
- —
- Monthly cashflow
- —
- DSCR
- —
- Eligible?
- —
Personal DTI + credit; lowest rate.
DSCR
20% down · 8.5% · 30yr
- Down + closing
- —
- Monthly P&I
- —
- Monthly cashflow
- —
- DSCR
- —
- Eligible?
- —
No personal income docs; deal must DSCR.
Hard money
10% down · 12.0% · 12mo
- Down + closing
- —
- Monthly P&I
- —
- Monthly cashflow
- —
- DSCR
- —
- Eligible?
- —
Short-term bridge; refi at stabilization.
Rent comps 1 comps
| Address | Beds | Baths | Sqft | Rent | $/sqft | DOM | Units | Dist |
|---|---|---|---|---|---|---|---|---|
| 200 Park St S Mora, MN | 3.0 | 2.0 | 1340 | $1,775 | $1.32 | 43d | 1 | 0.27mi |
Listing history 4 events
-
2026-05-18status Pending 1765-char remark
-
2026-05-17price $229,700 1765-char remark
-
2026-05-16price $299,700 1765-char remark
-
2026-05-15$229,500 Active 1765-char remark
ⓘ Source: listings_history table (triggers on properties + properties_extension) + one-shot
backfill from property_details.listing_events for pre-trigger history.
Tax reassessment forecast MN · Partial reset (capped growth)
- Current annual tax
- $2,664 · $222/mo
- Projected year-2 tax
- $2,664 · $222/mo
- Expected delta
- $0/yr ($0/mo · 0.0%)
ⓘ Screening estimate from a state-policy table — verify with the county assessor before closing.
Climate risk First Street
- Flood 1/10 Low 0% chance over 30 yrs
- Wildfire 2/10 Low
- Heat 2/10 Low 7 d/yr ≥98°F today · 13 d/yr by 30 yrs out
- Wind 1/10 Low
- Air quality 2/10 Low 1 unhealthy d/yr today · 1 by 30 yrs out
Nearby sold comps map
Loading sold comps map…
Walkable amenities ~0.75 mi
Loading nearby amenities…
Taxation est. · year 1
- Rental income
- $21,300
- − Mortgage interest
- −$12,867
- − Property taxes
- −$2,664
- − Insurance
- −$1,148
- − Repairs & maintenance
- −$1,704
- − Management
- −$1,704
- − Depreciation
- −$6,682
- Taxable loss
- −$5,469
- Est. tax savings @ 24.0%
- +$1,313
- After-tax cash flow
- $-128/yr
For passive investors: Depreciation is non-cash, so a rental often shows a tax loss while cash-flowing — sheltering income. Rental losses are passive: they offset passive income freely, and up to $25,000/yr can offset ordinary (W-2) income if you actively participate and your MAGI is under $100k (phasing out to $0 by $150k); unused losses carry forward. On sale, claimed depreciation is recaptured at up to 25%, and gains may owe capital-gains tax (a 1031 exchange can defer both). Figures are a year-1 estimate at your 24.0% rate — not tax advice; consult a CPA.
Schools (NCES district)
- District
- Mora Public School District
- NCES district ID
- 2721480
- Math proficiency
- 44% ▼ -15.00%
- Reading proficiency
- 58% ▼ -8.00%
- Median HH income
- $46,788
- Composite
- 43.26/100
- National rank
- #3052
- State rank
- #115 of 301 in MN
Livability — Mora
- Score
- 74/100
- State rank
- #207
- US rank
- #4362
Category grades
Schools grade is shown separately in the Schools card above.
Census & demographics
- Census place
- Mora, MN
- Population (ZIP)
- 9,927
Population outlook (Kanabec County) Hauer SSP2
- Today (2025)
- 14,998 people
- By 2030
- 14,363 · -4.2%
- By 2040
- 12,841 · -14.4%
- By 2050
- 11,299 · -24.7%
- By 2075
- 8,458 · -43.6%
- By 2100
- 6,283 · -58.1%
Race, ethnicity, and origin ACS 2023
- Neighborhood character
- Predominantly White (93%)
- Race & ethnicity
- White 93% Two or more races 4% Hispanic / Latino 1%
- Common ancestry
- Portuguese 10% Scottish 5% Lithuanian 3%
- Foreign-born
- 1%
- Languages at home
- 97% English-only · German/W. Germanic 2% Spanish 1%
Political lean MEDSL · Kanabec
- 2024 margin
- Solid R (+42.4) · D 28.1% · R 70.4% · Other 1.5%
- 2008→2024 swing
- -33.7pp toward R · 2008: -8.7pp · 2024: -42.4pp
- All cycles
- 2024: R+42.4 2020: R+37.9 2016: R+35.7 2012: R+9.0 2008: R+8.7
Not yet ingested
- Civics
- —
Market trends
- HPI YoY
- ▲ 6.15%
- Current HPI
- 313.18
- Rent YoY
- —
- Metro
- —
- State GDP YoY
- ▲ 2.41%
- F500 in state
- 34
Industry mix (Fortune 500 HQ in MN)
| Industry | F500 HQs | Revenue |
|---|---|---|
| Healthcare | 2 | $407B |
|
||
| Retail | 2 | $150B |
|
||
| Consumer Goods | 2 | $32B |
|
||
| Industrial Machinery | 2 | $6B |
|
||
| Agriculture | 1 | $40B |
|
||
| Healthcare / Medical Devices | 1 | $32B |
|
||
Price history
+0.1% since first listed4 events — show timeline
- 2026-05-18 Pending — NORTHSTARMLS as Distributed by MLS Grid
- 2026-05-17 Price Changed $229,700 NORTHSTARMLS as Distributed by MLS Grid
- 2026-05-16 Price Changed $299,700 NORTHSTARMLS as Distributed by MLS Grid
- 2026-05-15 Listed $229,500 NORTHSTARMLS as Distributed by MLS Grid
Property tax history
+10.3%/yrLatest (2025): $2,664 · -0.5% YoY. Source: county tax records.
Cash-flow waterfall
monthlySold comps — $/sqft
last 12 mo · ≤1 miLoading sold comps…