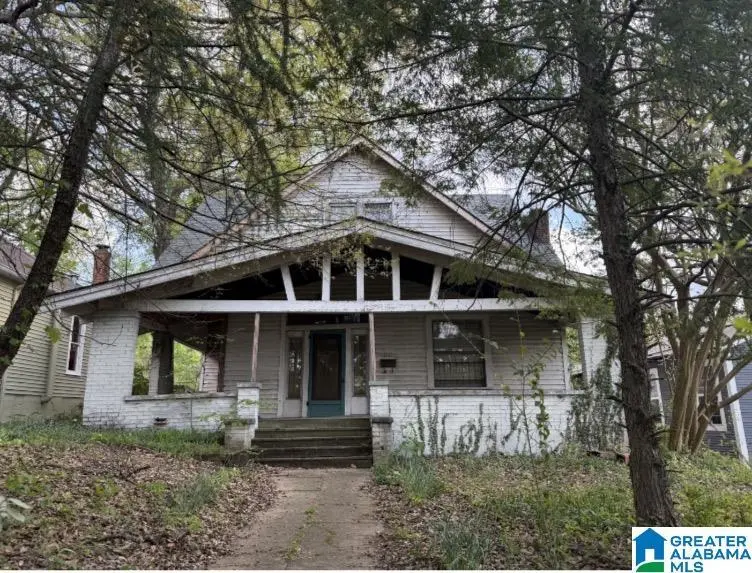
1515 13th Ave S · Birmingham, AL
Flood risk 1/10 · Minimal
- FEMA flood zone
- X (unshaded)
- Chance of flooding over 30 yrs
- 0.0%
- Est. flood insurance / yr
- $507 – $1,088
Fire risk 1/10 · Minimal
- Est. fire insurance / yr
- $916 – $1,700
Heat risk 7/10 · Major
- Hot days now (above 106°F)
- 7 days/yr
- Hot days in 30 yrs
- 19 days/yr
Wind risk 6/10 · Moderate
- Chance of severe wind over 30 yrs
- 27.0%
Air-quality risk 4/10 · Minor
- Unhealthy air days now
- 6 days/yr
- Unhealthy air days in 30 yrs
- 8 days/yr
Risk factors via First Street. Map © Google.
Why this score? — see what drove the B- grade
The composite is a weighted blend of 9 inputs, each scored 0–100. Each bar is that input's sub-score; the figure is the points it added to the 100-point composite (weight × sub-score).
- Cash flow +30.0/30.0
- 1% rule +10.0/10.0
- DSCR +10.0/10.0
- ARV discount +7.5/15.0
- Livability +3.4/5.0
- Rent growth +3.1/5.0
- Condition / age +2.5/5.0
- Schools +0.9/10.0
- Appreciation +0.0/10.0
$120,000
🖨 Deal sheet (PDF) 📄 Offer letter ✓ Due diligence
Listing remarks
Step into the charm of a bygone era with this historic home brimming with opportunity. This property is a true diamond in the rough, ready for a complete renovation to restore it to its former glory. Perfectly positioned just a short walk from UAB and restaurants, the location offers unbeatable convenience. Whether you're an investor, builder, or visionary homeowner, this is a rare chance to create something truly special in UAB/Southside. Bring your plans and imagination—this one is ready for a transformation.
Key facts
- Complete renovation
- Short walk from uab
- Historic home
Tags
Neighborhood map
What this means for you Summary
Snapshot
- This is a 4-bed/2.0-bath single-family listed at $120k.
Deal economics
- At list price, monthly cash flow is $725 ($9k/yr) — positive.
- The deal already cash-flows at list — no discount required.
- Meets the 1% rule at list price ($2k rent vs $120k).
- Cap rate 13.5% vs local median 6.2% in Birmingham — top-decile yield for the area; either an underpriced asset or a hidden risk that comps aren't pricing in. Stress-test before assuming the spread holds.
Location & tenants
- Location reads 67/100 on livability (#78 in AL) — a middle-class / working-renter tenant base. Strengths: commute A+, cost of living A+, housing A+; Watch: amenities C-, crime F, employment F.
- Birmingham City (urban): math 4% / reading 20% proficiency, ranked #116 of 129 in AL (top 90%) — low school quality limits family demand, transient renter base, plan for 1-2y turnover; 82% free/reduced lunch — lower-income household profile, screen leases tightly.
- Zoned schools: Glen Iris Elementary School (math 4% / reading 19%, grade F, #556 of 627 statewide, top 89%, 731 students, 78% FRL); Parker High School (math 2% / reading 2%, grade F, #291 of 305 statewide, top 100%, 826 students, 90% FRL) — zoned schools at 84% FRL track the district average.
- Market conditions: Rents rising (+2.6%/yr); 125 active listings in the ZIP; 1 comparable units currently listed for rent nearby; 2,114 units permitted in Jefferson County in 2024 (556 in 5+ unit buildings).
- At $1,924/mo this rent would consume 45% of the median local household income ($51k/yr) (locally 1468% of renters already pay >50% of income on rent) — very limited rent-growth headroom before tenants either downsize or default.
Forward outlook
- Local home prices are declining (-3.0%/yr); year-one equity from $830 of loan paydown is wiped out by about $4k of value loss. Plan a longer hold.
- Jefferson County population projected to shrink 4% by 2050 — rents likely to lag national; underwrite the cash flow, not the appreciation.
- At projected returns (-3.0% appreciation + 2.6% rent growth), your $34k cash investment doubles in ~5 years — after that, you're playing with house money.
Negotiation context
- Only 4 days on market — expect competitive offers; lowballing is unlikely to land.
- Current owner paid $44k; list at $120k implies a 171% gain — meaningful room to come down on a strong offer.
Risks & watch-outs
- Watch-outs: built in 1920 — expect roof / HVAC / electrical / plumbing capex.
- Climate carrying-cost: major wind risk, 27% chance of damaging wind over 30y; extreme-heat days projected 7→19/yr by 2055 (HVAC capex compounding) — expect insurance premiums to compound above CPI over the hold.
Questions for the listing agent
- Built in 1920 — when were the roof, HVAC, electrical panel, plumbing, and water heater last replaced?
- Is there a deadline driving the sale (1031 exchange, divorce, estate, relocation)? That informs how much negotiation room exists.
- Schools are F-rated, which usually means shorter tenancies and higher turnover. Who's the typical renter profile here, and what's been the actual vacancy rate?
- Crime grade is F in this area — have there been break-ins, vandalism, or insurance claims at this property in the last 3 years? What carrier currently insures it and at what premium?
- What's the average days-on-market for RENTAL listings here right now (not sales)? A rising rental-DOM trend means longer vacancies and softer asking-rent achievability than the comps imply.
- What's the recent tenant-quality profile in this submarket — average credit score on applications, eviction rate, late-payment / NSF rate, and stable-employment percentage? A property-management company in the area should have these aggregated.
- How much new for-sale + rental construction is in the pipeline within 1–3 miles? Heavy new supply typically softens prices + rents 12–24 months out; constrained supply supports both.
Investment metrics
- 1% rule
- 1.60% ✓
- Cap rate
- 13.54%
- Cash-on-cash
- 25.89%
- DSCR
- 2.15
- GRM
- 5.2
CMA / ARV
- ARV (on-the-fly)
- $475,616
- Comps found
- 12
Show comp detail 12 sales within ~0.75 mi
| Address | Dist | Beds/Ba | Sqft | Sold | Price | $/sf | Match |
|---|---|---|---|---|---|---|---|
| 1507 12th St S | 0.36mi | 4/3.5 | 2,848 (0%) | 2mo | $540,000 | $190 | 75 |
| 1425 18th St S | 0.36mi | 4/2.5 | 2,965 (+4%) | 8mo | $465,000 | $157 | 68 |
| 1426 16th St S | 0.12mi | 3/2.5 (-1) | 2,638 (-7%) | 8mo | $440,000 | $167 | 68 |
| 1601 15th Ave S | 0.18mi | 4/1.5 | 2,530 (-11%) | 4mo | $398,000 | $157 | 68 |
| 1618 Cullom St S | 0.52mi | 3/2.0 (-1) | 2,718 (-5%) | 4mo | $417,000 | $153 | 60 |
| 1308 18th Ave S | 0.47mi | 4/2.5 | 3,125 (+10%) | 1mo | $585,000 | $187 | 59 |
| 1532 19th St S | 0.38mi | 4/3.0 | 3,040 (+7%) | 11mo | $342,600 | $113 | 58 |
| 1730 Cullom St S | 0.60mi | 5/3.0 (+1) | 2,843 (-0%) | 9mo | $430,000 | $151 | 55 |
| 1109 Cullom St S | 0.34mi | 4/3.0 | 2,504 (-12%) | 9mo | $437,500 | $175 | 52 |
| 1416 17th St S | 0.18mi | 4/2.5 | 2,502 (-12%) | 21mo | $535,000 | $214 | 52 |
| 1632 11th Pl S | 0.55mi | 4/3.5 | 2,891 (+2%) | 17mo | $460,000 | $159 | 52 |
| 100 Penny Ln | 0.52mi | 3/3.5 (-1) | 3,018 (+6%) | 14mo | $860,000 | $285 | 43 |
Match score weights: distance 35% · size 25% · config 20% · recency 20%. Top-matched comps best support the ARV.
Projected returns pro-forma
-3.0% appreciation · 2.59% rent growth · sell at horizon
- IRR
- 19.1%
- Equity multiple
- 1.77×
- Total profit
- $25,938
- Equity at exit
- $17,892
- IRR
- 27.2%
- Equity multiple
- 3.35×
- Total profit
- $78,848
- Equity at exit
- $10,375
Cash invested: $33,600 (down + closing). Projections, not guarantees.
Landlord ↔ Tenant lean methodology
- Overall (STATE)
- 90 Strongly Landlord-Friendly
- State Alabama
- 90 Strongly Landlord-Friendly · R+15
- County
- — inherits STATE
- City
- — inherits STATE
ZIP-level market 35205
- Rents YoY
- 2.6%
- Active inventory
- 125
- Price-to-rent
- 5.2×
Monthly cashflow live
- Estimated rent
- $1,924 medium interval (Pro) →
- Mortgage (P&I)
- −$629
- Tax from tax record
- −$116 /mo · $1,391/yr
- Insurance
- −$50
- HOA
- −$0
- Vacancy / Maint / Mgmt
- −$404
- Net cashflow
- $725
Break-even live
Sensitivity live
| Price | -10% $793 | -5% $759 | +0% $725 | +5% $691 | +10% $657 |
|---|---|---|---|---|---|
| Rent | -10% $573 | -5% $649 | +0% $725 | +5% $801 | +10% $877 |
| Rate | -1.0pp $785 | -0.5pp $755 | base $725 | +0.5pp $694 | +1.0pp $662 |
UW: 25.0% down · 7.5% · 30yr · 1.5% tax · 5.0% vac · 8.0% maint · 8.0% mgmt
Financing live
Cash to close
- Down payment
- $30,000
- Closing costs
- $3,600
- Reserves months
- —
- Total cash needed
- —
Loan-product check · same deal, 3 products live
Conventional
25% down · 7.5% · 30yr
- Down + closing
- —
- Monthly P&I
- —
- Monthly cashflow
- —
- DSCR
- —
- Eligible?
- —
Personal DTI + credit; lowest rate.
DSCR
20% down · 8.5% · 30yr
- Down + closing
- —
- Monthly P&I
- —
- Monthly cashflow
- —
- DSCR
- —
- Eligible?
- —
No personal income docs; deal must DSCR.
Hard money
10% down · 12.0% · 12mo
- Down + closing
- —
- Monthly P&I
- —
- Monthly cashflow
- —
- DSCR
- —
- Eligible?
- —
Short-term bridge; refi at stabilization.
Rent comps 1 comps
| Address | Beds | Baths | Sqft | Rent | $/sqft | DOM | Units | Dist |
|---|---|---|---|---|---|---|---|---|
| 1022 28th Pl S Unit 3 Birmingham, AL | 4.0 | 4.0 | 2810 | $2,700 | $0.96 | 45d | 1 | 1.31mi |
Listing history 3 events
-
2026-04-29status Pending
-
2026-04-24$120,000 Active
-
1989-07-06soldstatus $44,220
ⓘ Source: listings_history table (triggers on properties + properties_extension) + one-shot
backfill from property_details.listing_events for pre-trigger history.
Tax reassessment forecast AL · Resets to sale price
- Current annual tax
- $1,391 · $116/mo
- Projected year-2 tax
- $1,391 · $116/mo
- Expected delta
- $0/yr ($0/mo · 0.0%)
ⓘ Screening estimate from a state-policy table — verify with the county assessor before closing.
Climate risk First Street
- Flood 1/10 Low FEMA zone X (unshaded) · 0% chance over 30 yrs
- Wildfire 1/10 Low
- Heat 7/10 Severe 7 d/yr ≥106°F today · 19 d/yr by 30 yrs out
- Wind 6/10 Major 27% chance of damaging wind over 30 yrs
- Air quality 4/10 Moderate 6 unhealthy d/yr today · 8 by 30 yrs out
Nearby sold comps map
Loading sold comps map…
Walkable amenities ~0.75 mi
Loading nearby amenities…
Taxation est. · year 1
- Rental income
- $23,090
- − Mortgage interest
- −$6,722
- − Property taxes
- −$1,391
- − Insurance
- −$600
- − Repairs & maintenance
- −$1,847
- − Management
- −$1,847
- − Depreciation
- −$3,491
- Taxable income
- $7,191
- Est. tax owed @ 24.0%
- −$1,726
- After-tax cash flow
- $6,972/yr
For passive investors: Depreciation is non-cash, so a rental often shows a tax loss while cash-flowing — sheltering income. Rental losses are passive: they offset passive income freely, and up to $25,000/yr can offset ordinary (W-2) income if you actively participate and your MAGI is under $100k (phasing out to $0 by $150k); unused losses carry forward. On sale, claimed depreciation is recaptured at up to 25%, and gains may owe capital-gains tax (a 1031 exchange can defer both). Figures are a year-1 estimate at your 24.0% rate — not tax advice; consult a CPA.
Schools (NCES district)
- District
- Birmingham City
- NCES district ID
- 0100390
- Math proficiency
- 4% ▼ -17.00%
- Reading proficiency
- 20% ▼ -4.00%
- Median HH income
- $31,988
- Composite
- 9.49/100
- National rank
- #9850
- State rank
- #116 of 129 in AL
Livability — Birmingham
- Score
- 67/100
- State rank
- #78
- US rank
- #10412
Category grades
Schools grade is shown separately in the Schools card above.
Census & demographics
- Census place
- Birmingham, AL
- County
- Jefferson County · 527,445 people
- City population
- 210,422
- Metro
- Birmingham-Hoover, AL
- Population (ZIP)
- 18,858
- Household income
- $51,158
- Rent vs Own
- Severe rent burden
- 1468.0
Population outlook (Jefferson County) Hauer SSP2
- Today (2025)
- 669,185 people
- By 2030
- 669,694 · +0.1%
- By 2040
- 661,388 · -1.2%
- By 2050
- 643,086 · -3.9%
- By 2075
- 577,267 · -13.7%
- By 2100
- 474,758 · -29.1%
Race, ethnicity, and origin ACS 2023
- Neighborhood character
- Diverse neighborhood (Simpson 0.56)
- Race & ethnicity
- White 60% Black 26% Hispanic / Latino 5% Asian 5% Two or more races 4%
- Hispanic origin (detail)
- Mexican 3%
- Common ancestry
- Slovak 3% Italian 2% Serbian 2%
- Foreign-born
- 9% · Canada, China, Vietnam
- Languages at home
- 90% English-only · Spanish 4% Other Indo-European 2% Chinese 1%
Political lean MEDSL · Jefferson
- 2024 margin
- D (+10.4) · D 54.6% · R 44.2% · Other 1.2%
- 2008→2024 swing
- +5.4pp toward D · 2008: 5.1pp · 2024: 10.4pp
- All cycles
- 2024: D+10.4 2020: D+13.2 2016: D+7.2 2012: D+6.0 2008: D+5.1
Not yet ingested
- Civics
- —
Market trends
- HPI YoY
- ▼ -199.42%
- Current HPI
- 291.38
- Rent YoY
- ▲ 2.59%
- Metro
- Birmingham-Hoover, AL
- State GDP YoY
- ▲ 2.94%
- F500 in state
- 4
Industry mix (Fortune 500 HQ in AL)
| Industry | F500 HQs | Revenue |
|---|---|---|
| Financial Services | 1 | $8B |
|
||
| Healthcare | 1 | $5B |
|
||
Price history
+171.4% since first listed3 events — show timeline
- 2026-04-29 Pending — Greater Alabama MLS
- 2026-04-24 Listed $120,000 Greater Alabama MLS
- 1989-07-06 Sold (Public Records) $44,220 Public Records
Property tax history
+6.9%/yrLatest (2025): $1,391 · +0.0% YoY. Source: county tax records.
Cash-flow waterfall
monthlySold comps — $/sqft
last 12 mo · ≤1 miLoading sold comps…