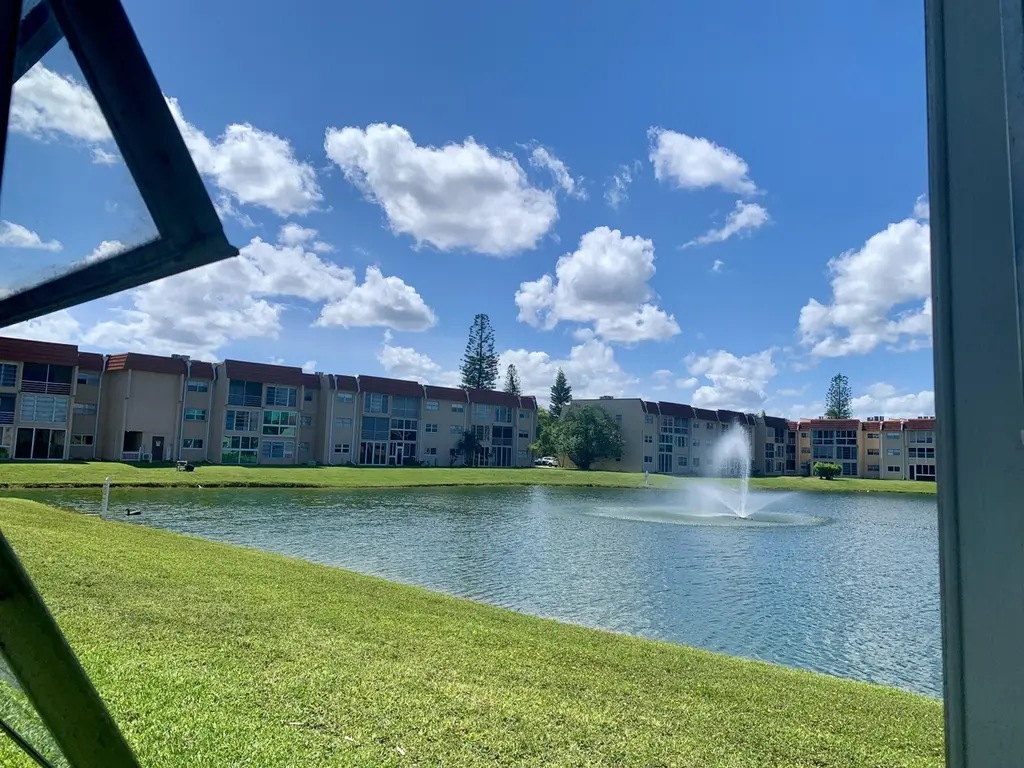
 🌊 Lakefront
2801 N Pine Island Rd #110 · Sunrise, FL
Flood risk 1/10 · Minimal
- FEMA flood zone
- X (shaded)
- Chance of flooding over 30 yrs
- 0.0%
- Est. flood insurance / yr
- $507 – $1,088
Fire risk 1/10 · Minimal
- Est. fire insurance / yr
- $947 – $1,759
Heat risk 9/10 · Severe
- Hot days now (above 106°F)
- 5 days/yr
- Hot days in 30 yrs
- 18 days/yr
Wind risk 10/10 · Severe
- Chance of severe wind over 30 yrs
- 99.0%
Air-quality risk 3/10 · Minor
- Unhealthy air days now
- 2 days/yr
- Unhealthy air days in 30 yrs
- 3 days/yr
Risk factors via First Street. Map © Google.
Why this score? — see what drove the C grade
The composite is a weighted blend of 9 inputs, each scored 0–100. Each bar is that input's sub-score; the figure is the points it added to the 100-point composite (weight × sub-score).
- Cash flow +19.0/30.0
- 1% rule +10.0/10.0
- ARV discount +7.5/15.0
- DSCR +6.0/10.0
- Livability +4.2/5.0
- Schools +4.1/10.0
- Rent growth +2.7/5.0
- Condition / age +2.5/5.0
- Appreciation +0.0/10.0
$139,000
🖨 Deal sheet 📄 Offer letter ✓ Due diligence
Listing remarks MLS
Enjoy beautiful lake view from this first floor unit. All tile, some upgrades have been done and new appliances, freshly paint. Across from one of clubhouse. many activities in the club house-gym indoor pool. BUYER MUST HAVE GOOD CREDIT AND VERIFIABLE INCO ME. 6 MONTH ESCROW ASSOCIATION FEES NO EXCEPTIONA AS PER ASSOCIATION.
Key facts
- Granito countertop
- Landscaped yard
- Updated kitchen
Tags
Property features AI
Finance
- Financial info: Pets not allowed; Community contains 3,245 units
- HOA & community: Association: Sunrise Lakes Condominium Apts. Phase III; Monthly HOA fee (approx.): $652.80; HOA covers cable TV, insurance, grounds and structure maintenance, pest control, security, sewer, trash, elevator, golf, hot water, and recreation facilities; Community amenities include billiard room, clubhouse, fitness center, golf course, laundry, picnic area, pool (heated), shuffleboard court, spa/hot tub, storage, tennis courts, trash chute, courtesy bus, and heated pool; Senior community
Exterior
- Parking: 1 parking space; Asphalt surface; Guest parking available
- Security: Security guard
- Utilities: Public water; Public sewer; Cable connected; Sewer connected
- Home design: Condominium; One level; Faces south; Resale unit; Three-story building
- Construction: Concrete/CBS construction; Concrete roof; Built as part of building with 850 total building area
- Exterior features: On golf course; Waterfront
Interior
- Kitchen: Disposal; Dishwasher; Electric range; Microwave
- Bedrooms: 2 bedrooms on the main level
- Flooring: Tile
- Bathrooms: 2 full bathrooms on the main level
- Heating & cooling: Central electric heating; Central air conditioning; Ceiling fans
- Interior features: Custom mirrors; Jalousie and sliding windows
- Laundry & utility: Laundry in common area
Neighborhood map
What this means for you Summary
Snapshot
- This is a 2-bed/2.0-bath condo listed at $139k.
Deal economics
- At list price, monthly cash flow is $144 ($2k/yr) — positive.
- The deal already cash-flows at list — no discount required.
- Meets the 1% rule at list price ($2k rent vs $139k).
- Cap rate 7.5% vs local median 4.9% in Sunrise — top-decile yield for the area; either an underpriced asset or a hidden risk that comps aren't pricing in. Stress-test before assuming the spread holds.
Location & tenants
- Location reads 83/100 on livability (#56 in FL, #986 nationally) — a professional / high-income tenant draw. Strengths: commute A+, housing A+, health & safety A+; Watch: employment C-, amenities F.
- Broward (suburban): math 42% / reading 53% proficiency, ranked #46 of 73 in FL (top 63%) — families likely to look elsewhere, expect single-tenant / working-renter base with shorter leases.
- Zoned schools: Horizon Elementary School (math 40% / reading 45%, grade F, #1,383 of 2,144 statewide, top 65%, 568 students, 74% FRL); Bair Middle School (math 23% / reading 38%, grade F, #465 of 571 statewide, top 82%, 766 students, 72% FRL); Piper High School (math 12% / reading 35%, grade F, #533 of 667 statewide, top 80%, 2,310 students, 65% FRL) — zoned schools average 70% FRL vs 51% district-wide (19 pts higher); higher-poverty schools than district average — tighter screening recommended.
- Zoned-school proficiency averages 32% at this address vs 48% district-wide (-15 pts) — the specific schools serving this property underperform the Broward average; the district grade overstates school quality for this exact location.
- Market conditions: Rents flat; 559 active listings in the ZIP; 40 comparable units currently listed for rent nearby; rentals at typical pace (median 24d on market — plan ~3-4 weeks tenant-placement turnaround); 2,111 units permitted in Broward County in 2024 (1,265 in 5+ unit buildings).
- This rent runs 35% of the median local income ($72k/yr) — at the standard rent-burdened threshold; future hikes will face affordability resistance.
Forward outlook
- Local home prices are declining (-3.0%/yr); year-one equity from $961 of loan paydown is wiped out by about $4k of value loss. Plan a longer hold.
- Broward County population projected at +34% by 2050 — long-run rental-demand tailwind backs the buy-and-hold thesis.
Negotiation context
- Only 10 days on market — expect competitive offers; lowballing is unlikely to land.
- 2 sale attempts since 15y ago with the ask held roughly flat each time — persistent listings suggest the price (not the market) is what's stuck; bring a comps-based counter.
- Current owner paid $25k; list at $139k implies a 456% gain — meaningful room to come down on a strong offer.
Risks & watch-outs
- Watch-outs: HOA is 31% of rent.
- Climate carrying-cost: severe wind risk, 99% chance of damaging wind over 30y; extreme-heat days projected 5→18/yr by 2055 (HVAC capex compounding) — expect insurance premiums to compound above CPI over the hold.
Questions for the listing agent
- Built in 1975 — when were the roof, HVAC, electrical panel, plumbing, and water heater last replaced?
- What does the HOA fee cover, when was the last increase, and are there any pending special assessments or reserve-fund shortfalls?
- Any open or pending special assessments — roof, HVAC, plumbing, elevator, façade? What's the per-unit balance and payoff schedule, and is the seller paying it off at close or rolling it to the buyer?
- Is there a deadline driving the sale (1031 exchange, divorce, estate, relocation)? That informs how much negotiation room exists.
- This sits on a lake — are riparian / water-frontage rights deeded with the parcel? Any dock permits, shoreline easements, or HOA water-use restrictions?
- What's the documented flood / surge / shoreline-erosion history here (FEMA AND non-FEMA — e.g., storm surge, creek backup, septic-field saturation)?
- Any water-quality or seasonal algae-bloom issues that affect tenant satisfaction or short-term-rental demand?
- What's the average days-on-market for RENTAL listings here right now (not sales)? A rising rental-DOM trend means longer vacancies and softer asking-rent achievability than the comps imply.
- What's the recent tenant-quality profile in this submarket — average credit score on applications, eviction rate, late-payment / NSF rate, and stable-employment percentage? A property-management company in the area should have these aggregated.
- How much new apartment / multifamily construction is in the pipeline within 1–3 miles? Heavy new supply (>2% of stock underway) typically softens rents 12–24 months out; light construction supports rent growth.
Investment metrics
- 1% rule
- 1.51% ✓
- Cap rate
- 7.54%
- Cash-on-cash
- 4.44%
- DSCR
- 1.20
- GRM
- 5.5
CMA / ARV
No comps found within radius.
Projected returns pro-forma
-3.0% appreciation · 0.6% rent growth · sell at horizon
- IRR
- -13.3%
- Equity multiple
- 0.54×
- Total profit
- $-17,948
- Equity at exit
- $20,725
- IRR
- -11.0%
- Equity multiple
- 0.44×
- Total profit
- $-21,721
- Equity at exit
- $12,018
Cash invested: $38,920 (down + closing). Projections, not guarantees.
Landlord ↔ Tenant lean methodology
- Overall (STATE)
- 87 Strongly Landlord-Friendly
- State Florida
- 87 Strongly Landlord-Friendly · R+3
- County
- — inherits STATE
- City
- — inherits STATE
ZIP-level market 33322
- Home prices YoY
- -33.3%
- Rents YoY
- 0.6%
- Active inventory
- 559
- Price-to-rent
- 5.5×
Monthly cashflow live
- Estimated rent
- $2,106 high interval (Pro) →
- Mortgage (P&I)
- −$729
- Tax from tax record
- −$81 /mo · $969/yr
- Insurance
- −$58
- HOA
- −$652
- Vacancy / Maint / Mgmt
- −$442
- Net cashflow
- $144
Break-even live
UW: 25.0% down · 7.5% · 30yr · 1.5% tax · 5.0% vac · 8.0% maint · 8.0% mgmt
Financing live
Cash to close
- Down payment
- $34,750
- Closing costs
- $4,170
- Reserves months
- —
- Total cash needed
- —
Loan-product check · same deal, 3 products live
Conventional
25% down · 7.5% · 30yr
- Down + closing
- —
- Monthly P&I
- —
- Monthly cashflow
- —
- DSCR
- —
- Eligible?
- —
Personal DTI + credit; lowest rate.
DSCR
20% down · 8.5% · 30yr
- Down + closing
- —
- Monthly P&I
- —
- Monthly cashflow
- —
- DSCR
- —
- Eligible?
- —
No personal income docs; deal must DSCR.
Hard money
10% down · 12.0% · 12mo
- Down + closing
- —
- Monthly P&I
- —
- Monthly cashflow
- —
- DSCR
- —
- Eligible?
- —
Short-term bridge; refi at stabilization.
Rent comps 40 comps
| Address | Beds | Baths | Sqft | Rent | $/sqft | DOM | Units | Dist |
|---|---|---|---|---|---|---|---|---|
| 9100 NW 26th Pl Sunrise, FL | 2.0 | 2.0 | 1047 | $2,995 | $2.86 | 24d | 1 | 0.16mi |
| 9100 NW 26th Pl Sunrise, FL | 3.0 | 2.0 | 1047 | $2,995 | $2.86 | 22d | 1 | 0.16mi |
| 8595 Sunrise Lakes Blvd #207 Sunrise, FL | 1.0 | 1.0 | 640 | $1,700 | $2.66 | 24d | 1 | 0.23mi |
| 8595 Sunrise Lakes Blvd #307 Sunrise, FL | 1.0 | 1.0 | 640 | $1,400 | $2.19 | 1d | 1 | 0.23mi |
| 8595 Sunrise Lakes Blvd Sunrise, FL | 1.0 | 1.0 | 640 | $1,550 | $2.42 | 20d | 2 | 0.24mi |
| 8465 Sunrise Lakes Blvd #106 Sunrise, FL | 1.0 | 1.0 | 640 | $1,450 | $2.27 | 24d | 1 | 0.31mi |
| 8500 Sunrise Lakes Blvd #111 Sunrise, FL | 2.0 | 2.0 | 850 | $1,850 | $2.18 | 15d | 1 | 0.32mi |
| 8500 Sunrise Lakes Blvd #111 Sunrise, FL | 2.0 | 2.0 | 850 | $1,850 | $2.18 | 10d | 1 | 0.32mi |
| 8590 Sunrise Lakes Blvd #106 Sunrise, FL | 1.0 | 1.0 | 640 | $1,475 | $2.30 | 24d | 1 | 0.33mi |
| 3100 N Pine Island Rd Sunrise, FL | 1.0–2.0 | 1.5–2.0 | 1002 | $2,300 | $2.29 | 24d | 2 | 0.43mi |
| 8350 Sunrise Lakes Blvd #204 Sunrise, FL | 2.0 | 2.0 | 850 | $1,600 | $1.88 | 24d | 1 | 0.43mi |
| 8400 Sunrise Lakes Blvd #106 Sunrise, FL | 1.0 | 1.0 | 640 | $1,400 | $2.19 | 7d | 1 | 0.44mi |
| 8400 Sunrise Lakes Blvd #106 Sunrise, FL | 1.0 | 1.0 | 640 | $1,400 | $2.19 | 24d | 1 | 0.44mi |
| 8285 Sunrise Lakes Blvd #208 Sunrise, FL | 1.0 | 1.0 | 640 | $1,400 | $2.19 | 24d | 1 | 0.49mi |
| 8285 Sunrise Lakes Blvd #208 Sunrise, FL | 1.0 | 1.0 | 640 | $1,400 | $2.19 | 7d | 1 | 0.49mi |
| 8300 Sunrise Lakes Blvd #212 Sunrise, FL | 2.0 | 2.0 | 850 | $1,900 | $2.24 | 3d | 1 | 0.49mi |
| 8225 Sunrise Lakes Blvd #303 Sunrise, FL | 2.0 | 2.0 | 850 | $1,600 | $1.88 | 3d | 1 | 0.53mi |
| 8220 Sunrise Lakes Blvd #309 Sunrise, FL | 2.0 | 2.0 | 850 | $1,650 | $1.94 | 24d | 1 | 0.56mi |
| 8135 Sunrise Lakes Blvd #302 Sunrise, FL | 2.0 | 2.0 | 850 | $1,550 | $1.82 | 11d | 1 | 0.58mi |
| 8135 Sunrise Lakes Blvd Sunrise, FL | 1.0–2.0 | 1.0–2.0 | 745 | $1,550 | $2.08 | 24d | 2 | 0.59mi |
| 9720 NW 24th Pl Unit B Sunrise, FL | 1.0 | 1.0 | 700 | $1,750 | $2.50 | 24d | 1 | 0.65mi |
| 8100 Sunrise Lakes Blvd Sunrise, FL | 1.0–2.0 | 1.0–2.0 | 745 | $2,200 | $2.95 | 11d | 2 | 0.65mi |
| 3220 NW 84th Ave Sunrise, FL | 2.0 | 2.0 | 1115 | $2,150 | $1.93 | 24d | 1 | 0.65mi |
| 3432 NW 86th Way Unit D204 Sunrise, FL | 2.0 | 2.0 | 1040 | $1,900 | $1.83 | 24d | 1 | 0.66mi |
| 8110 Sunrise Lakes Blvd #307 Sunrise, FL | 1.0 | 1.0 | 640 | $1,500 | $2.34 | 2d | 1 | 0.67mi |
| 8110 Sunrise Lakes Blvd #307 Sunrise, FL | 1.0 | 1.0 | 640 | $1,500 | $2.34 | 17d | 1 | 0.67mi |
| 3244 NW 84th Ave Sunrise, FL | 2.0 | 2.0 | 1115 | $2,300 | $2.06 | 24d | 1 | 0.67mi |
| 3200 NW 84th Ave Sunrise, FL | 2.0 | 2.0 | 1115 | $2,100 | $1.88 | 24d | 1 | 0.68mi |
| 3232 NW 84th Ave Sunrise, FL | 2.0 | 2.0 | 1115 | $2,000 | $1.79 | 24d | 1 | 0.69mi |
| 8601 NW 34th Pl Apt A102 Sunrise, FL | 2.0 | 2.0 | 1080 | $2,200 | $2.04 | 24d | 1 | 0.69mi |
| 9999 Summerbreeze Dr Sunrise, FL | 1.0–2.0 | 1.0–2.0 | 889 | $2,200 | $2.47 | 2d | 8 | 0.71mi |
| 9999 Summerbreeze Dr Sunrise, FL | 1.0–2.0 | 1.0–2.0 | 889 | $2,200 | $2.47 | 18d | 6 | 0.71mi |
| 9999 Summerbreeze Dr Sunrise, FL | 1.0–2.0 | 1.0–2.0 | 889 | $2,200 | $2.47 | 1d | 9 | 0.71mi |
| 9999 Summerbreeze Dr Sunrise, FL | 1.0–2.0 | 1.0–2.0 | 889 | $2,200 | $2.47 | 5d | 9 | 0.71mi |
| 3598 NW 91st Ln #3598 Sunrise, FL | 2.0 | 2.0 | 886 | $1,895 | $2.14 | 24d | 1 | 0.72mi |
| 3551 NW 85th Way Sunrise, FL | 1.0–3.0 | 1.0–2.0 | 1247 | $2,364 | $1.90 | 3d | 23 | 0.74mi |
| 3531 NW 94th Ave Unit 6B Sunrise, FL | 2.0 | 2.0 | 925 | $1,925 | $2.08 | 15d | 1 | 0.74mi |
| 3624 NW 91st Ln #3624 Sunrise, FL | 2.0 | 2.0 | 886 | $2,000 | $2.26 | 5d | 1 | 0.76mi |
| 3562 NW 91st Ln #3562 Sunrise, FL | 2.0 | 2.0 | 886 | $1,900 | $2.14 | 24d | 1 | 0.76mi |
| 2698 N Nob Hill Rd Sunrise, FL | 2.0 | 2.0 | 1008 | $2,275 | $2.26 | 24d | 1 | 0.76mi |
HOA detail condo
- Monthly dues
- $652 · $7,824/yr
- Likely covers
- poolgym
- Assessments
- None detected in remarks — confirm with the listing agent.
Listing history 7 events
-
2026-06-18days on market $139,000 Active 10 DOM
-
2026-06-17days on market $139,000 Active 9 DOM
-
2026-06-16days on market $139,000 Active 8 DOM
-
2026-06-15days on market $139,000 Active 7 DOM
-
2026-06-13days on market $139,000 Active 5 DOM
-
2026-06-08remarks 419-char remark
-
2026-06-08$139,000 Active 1 DOM
ⓘ Source: listings_history table (triggers on properties + properties_extension) + one-shot
backfill from property_details.listing_events for pre-trigger history.
Tax reassessment forecast FL · Resets to sale price
- Current annual tax
- $969 · $81/mo
- Projected year-2 tax
- $1,154 · $96/mo
- Expected delta
- +$185/yr (+$15/mo · 19.1%)
ⓘ Screening estimate from a state-policy table — verify with the county assessor before closing.
Climate risk First Street
- Flood 1/10 Low FEMA zone X (shaded) · 0% chance over 30 yrs
- Wildfire 1/10 Low
- Heat 9/10 Extreme 5 d/yr ≥106°F today · 18 d/yr by 30 yrs out
- Wind 10/10 Extreme 99% chance of damaging wind over 30 yrs
- Air quality 3/10 Moderate 2 unhealthy d/yr today · 3 by 30 yrs out
Nearby sold comps map
Loading sold comps map…
Walkable amenities ~0.75 mi
Loading nearby amenities…
Taxation est. · year 1
- Rental income
- $25,268
- − Mortgage interest
- −$7,786
- − Property taxes
- −$969
- − Insurance
- −$695
- − Repairs & maintenance
- −$2,021
- − Management
- −$2,021
- − HOA
- −$7,824
- − Depreciation
- −$4,044
- Taxable loss
- −$92
- Est. tax savings @ 24.0%
- +$22
- After-tax cash flow
- $1,749/yr
For passive investors: Depreciation is non-cash, so a rental often shows a tax loss while cash-flowing — sheltering income. Rental losses are passive: they offset passive income freely, and up to $25,000/yr can offset ordinary (W-2) income if you actively participate and your MAGI is under $100k (phasing out to $0 by $150k); unused losses carry forward. On sale, claimed depreciation is recaptured at up to 25%, and gains may owe capital-gains tax (a 1031 exchange can defer both). Figures are a year-1 estimate at your 24.0% rate — not tax advice; consult a CPA.
Schools (NCES district)
- District
- Broward
- NCES district ID
- 1200180
- Math proficiency
- 42% ▼ -18.00%
- Reading proficiency
- 53% ▼ -5.00%
- Median HH income
- $52,139
- Composite
- 40.88/100
- National rank
- #3621
- State rank
- #46 of 73 in FL
Livability — Sunrise
- Score
- 83/100
- State rank
- #56
- US rank
- #986
Category grades
Schools grade is shown separately in the Schools card above.
Census & demographics
- Census place
- Sunrise, FL
- County
- Broward County · 1,963,430 people
- City population
- 77,492
- Metro
- Miami-Fort Lauderdale-Pompano Beach, FL
- Population (ZIP)
- 41,128
- Household income
- $71,755
- Rent vs Own
- Severe rent burden
- 931.0
Population outlook (Broward County) Hauer SSP2
- Today (2025)
- 2,207,033 people
- By 2030
- 2,360,704 · +7.0%
- By 2040
- 2,661,208 · +20.6%
- By 2050
- 2,946,698 · +33.5%
- By 2075
- 3,602,273 · +63.2%
- By 2100
- 3,970,984 · +79.9%
Race, ethnicity, and origin ACS 2023
- Neighborhood character
- Highly diverse neighborhood (Simpson 0.72)
- Race & ethnicity
- Hispanic / Latino 35% White 32% Black 24% Two or more races 22% Asian 4%
- Hispanic origin (detail)
- Puerto Rican 5% Cuban 6% Dominican 2% Salvadoran 1%
- Common ancestry
- Hispanic 5% Romanian 2% Scotch-Irish 2%
- Foreign-born
- 41% · Canada, Jamaica, South Korea
- Languages at home
- 58% English-only · Spanish 30% French/Haitian/Cajun 6% Other Indo-European 1%
Political lean MEDSL · Broward
- 2024 margin
- D (+17.0) · D 58.0% · R 41.0%
- 2008→2024 swing
- -17.8pp toward R · 2008: 34.7pp · 2024: 17.0pp
- All cycles
- 2024: D+17.0 2020: D+29.8 2016: D+35.0 2012: D+34.9 2008: D+34.7
Not yet ingested
- Civics
- —
Market trends
- HPI YoY
- ▼ -203.34%
- Current HPI
- 407.5452
- Rent YoY
- ▲ 0.60%
- Metro
- Miami-Fort Lauderdale-Pompano Beach, FL
- State GDP YoY
- ▲ 3.28%
- F500 in state
- 36
Industry mix (Fortune 500 HQ in FL)
| Industry | F500 HQs | Revenue |
|---|---|---|
| Industrial Technology | 2 | $29B |
|
||
| Insurance | 2 | $17B |
|
||
| Retail | 1 | $60B |
|
||
| Technology Distribution | 1 | $58B |
|
||
| Homebuilding | 1 | $35B |
|
||
| Technology Manufacturing | 1 | $35B |
|
||
Price history
+491.5% since first listed7 events — show timeline
- 2026-06-08 Listed $139,000 Beaches MLS
- 2012-03-22 Sold (Public Records) $25,000 Public Records
- 2012-03-08 Sold (MLS) $25,000 MARMLS
- 2011-10-14 Sold (Public Records) $18,000 Public Records
- 2011-09-30 Sold (MLS) $18,000 Beaches MLS
- 2011-07-09 Listed $19,900 Beaches MLS
- 1975-04-01 Sold (Public Records) $23,500 Public Records
Property tax history
+4.2%/yrLatest (2025): $969 · +4.5% YoY. Source: county tax records.
Cash-flow waterfall
monthlySold comps — $/sqft
last 12 mo · ≤1 miLoading sold comps…