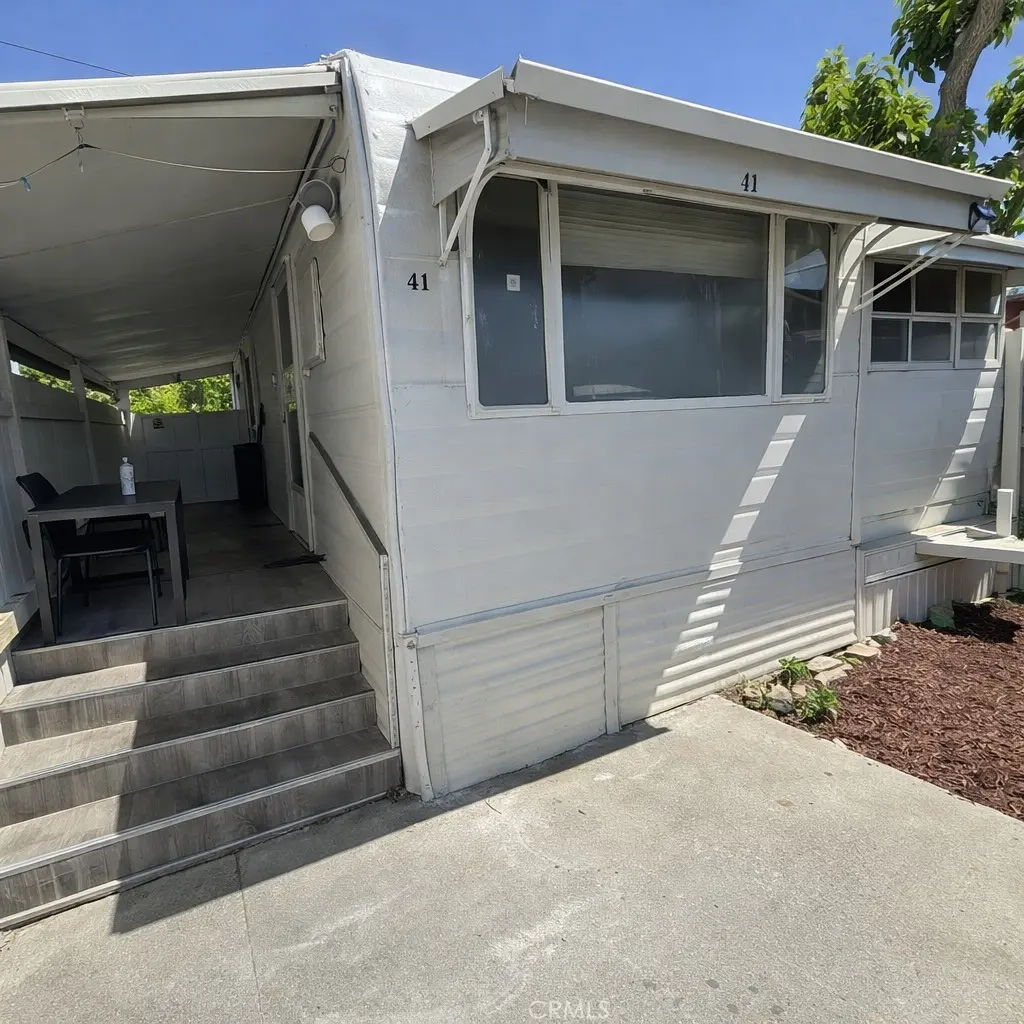
501 W Ramsey St #41 · Banning, CA
Flood risk 1/10 · Minimal
- FEMA flood zone
- X (unshaded)
- Chance of flooding over 30 yrs
- 0.0%
- Est. flood insurance / yr
- $507 – $1,088
Fire risk 10/10 · Severe
- Est. fire insurance / yr
- $659 – $1,223
Heat risk 7/10 · Major
- Hot days now (above 98°F)
- 7 days/yr
- Hot days in 30 yrs
- 20 days/yr
Wind risk 1/10 · Minimal
- Chance of severe wind over 30 yrs
- —
Air-quality risk 8/10 · Major
- Unhealthy air days now
- 18 days/yr
- Unhealthy air days in 30 yrs
- 23 days/yr
Risk factors via First Street. Map © Google.
Why this score? — see what drove the C- grade
The composite is a weighted blend of 9 inputs, each scored 0–100. Each bar is that input's sub-score; the figure is the points it added to the 100-point composite (weight × sub-score).
- Cash flow +15.0/30.0
- ARV discount +15.0/15.0
- 1% rule +5.0/10.0
- DSCR +5.0/10.0
- Rent growth +3.4/5.0
- Condition / age +2.5/5.0
- Livability +2.4/5.0
- Schools +2.0/10.0
- Appreciation +0.0/10.0
$39,000
🖨 Deal sheet 📄 Offer letter ✓ Due diligence
Listing remarks MLS
This 2 bedroom 1 bath trailer is situated in an all-ages community park. Buyer to qualify with the park. Conveniently located close to freeway and shopping. * Pictures coming soon *
Key facts
- Built 1956
- Listed 42 days
Property features AI
Finance
- Other: Lot characterized as 0–1 unit per acre; Elevation measured in feet; Directions available to the park
- Financial info: Land lease fee applies
- HOA & community: Located in Banning Mountain View Estates (land lease community); Community has street lighting and sidewalks; Manager approval required; Pets allowed
Exterior
- Parking: No dedicated parking
- Utilities: Public sewer; Public/district water available
- Home design: Mobile home (model CCH); Mobile home remains on site; 16 ft. wide by 76 ft. long; Single story
- Construction: Year built per public records
- Exterior features: No pool
Interior
- Kitchen: Gas cooktop; Gas oven; Dishwasher; Appliances included
- Bathrooms: 1 full bathroom
- Interior features: One-level entry; One-story home; Two or more access exits
- Laundry & utility: Washer hookup in an area; Has laundry
Neighborhood map
What this means for you Summary
Snapshot
- This is a 2-bed/1.0-bath manufactured listed at $39k.
Deal economics
- At list price, monthly cash flow is $1k ($18k/yr) — positive.
- The deal already cash-flows at list — no discount required.
- Meets the 1% rule at list price ($2k rent vs $39k).
- Recommended offer: $38k (3.0% below list) — sets the bar for market timing.
- Cap rate 51.2% vs local median 3.0% in Banning — top-decile yield for the area; either an underpriced asset or a hidden risk that comps aren't pricing in. Stress-test before assuming the spread holds.
Location & tenants
- Location reads 48/100 on livability (#1,192 in CA) — a working-class tenant base; expect higher turnover. Strengths: housing B+; Watch: crime C-, schools F, amenities F.
- Banning Unified (suburban): math 15% / reading 25% proficiency, ranked #1,258 of 1,400 in CA (top 90%) — low school quality limits family demand, transient renter base, plan for 1-2y turnover; 76% free/reduced lunch — lower-income household profile, screen leases tightly.
- Market conditions: Rents rising (+3.6%/yr); 312 active listings in the ZIP; 8 comparable units currently listed for rent nearby; rentals at typical pace (median 25d on market — plan ~3-4 weeks tenant-placement turnaround); 9,195 units permitted in Riverside County in 2024 (1,512 in 5+ unit buildings).
- This rent runs 42% of the median local income ($63k/yr) — at the standard rent-burdened threshold; future hikes will face affordability resistance.
Forward outlook
- Local home prices are declining (-3.0%/yr); year-one equity from $270 of loan paydown is wiped out by about $1k of value loss. Plan a longer hold.
- Riverside County population projected at +22% by 2050 — long-run rental-demand tailwind backs the buy-and-hold thesis.
- At projected returns (-3.0% appreciation + 3.6% rent growth), your $11k cash investment doubles in ~1 year — after that, you're playing with house money.
Negotiation context
- It's been on market 42 days — a 3% lower offer ($38k) is reasonable based on typical stale-listing flexibility.
- 3 sale attempts with the ask held roughly flat each time — persistent listings suggest the price (not the market) is what's stuck; bring a comps-based counter.
- Current owner paid $32k; 22% above their basis — modest negotiation headroom, anchor on the comps not their cost.
Risks & watch-outs
- Watch-outs: built in 1956 — expect roof / HVAC / electrical / plumbing capex.
- Climate carrying-cost: severe wildfire risk; extreme-heat days projected 7→20/yr by 2055 (HVAC capex compounding) — expect insurance premiums to compound above CPI over the hold.
Questions for the listing agent
- It's been on market 42 days. Have you received any prior offers? Is the seller open to a 3% concession, seller financing, or rate buy-down credit?
- Built in 1956 — when were the roof, HVAC, electrical panel, plumbing, and water heater last replaced?
- Is there a deadline driving the sale (1031 exchange, divorce, estate, relocation)? That informs how much negotiation room exists.
- Schools are F-rated, which usually means shorter tenancies and higher turnover. Who's the typical renter profile here, and what's been the actual vacancy rate?
- What's the average days-on-market for RENTAL listings here right now (not sales)? A rising rental-DOM trend means longer vacancies and softer asking-rent achievability than the comps imply.
- What's the recent tenant-quality profile in this submarket — average credit score on applications, eviction rate, late-payment / NSF rate, and stable-employment percentage? A property-management company in the area should have these aggregated.
- How much new for-sale + rental construction is in the pipeline within 1–3 miles? Heavy new supply typically softens prices + rents 12–24 months out; constrained supply supports both.
Investment metrics
- 1% rule
- 5.61% ✓
- Cap rate
- 51.17%
- Cash-on-cash
- 160.26%
- DSCR
- 8.13
- GRM
- 1.5
CMA / ARV
- ARV (median comp)
- $49,753
- List price
- $39,000
- Delta
- -21.61%
- Verdict
- UNDERPRICED
- Comps
- 5 within 2.0 mi
Projected returns pro-forma
-3.0% appreciation · 3.58% rent growth · sell at horizon
- IRR
- —
- Equity multiple
- 9.05×
- Total profit
- $87,881
- Equity at exit
- $5,815
- IRR
- —
- Equity multiple
- 19.46×
- Total profit
- $201,593
- Equity at exit
- $3,372
Cash invested: $10,920 (down + closing). Projections, not guarantees.
Landlord ↔ Tenant lean methodology
- Overall (STATE)
- 18 Strongly Tenant-Friendly
- State California
- 18 Strongly Tenant-Friendly · D+13
- County
- — inherits STATE
- City
- — inherits STATE
ZIP-level market 92220
- Rents YoY
- 3.6%
- Active inventory
- 312
- Price-to-rent
- 1.5×
Monthly cashflow live
- Estimated rent
- $2,187 high interval (Pro) →
- Mortgage (P&I)
- −$205
- Tax est. 1.5%
- −$49 /mo · $585/yr
- Insurance
- −$16
- HOA
- −$0
- Vacancy / Maint / Mgmt
- −$459
- Net cashflow
- $1,458
Break-even live
UW: 25.0% down · 7.5% · 30yr · 1.5% tax · 5.0% vac · 8.0% maint · 8.0% mgmt
Financing live
Cash to close
- Down payment
- $9,750
- Closing costs
- $1,170
- Reserves months
- —
- Total cash needed
- —
Loan-product check · same deal, 3 products live
Conventional
25% down · 7.5% · 30yr
- Down + closing
- —
- Monthly P&I
- —
- Monthly cashflow
- —
- DSCR
- —
- Eligible?
- —
Personal DTI + credit; lowest rate.
DSCR
20% down · 8.5% · 30yr
- Down + closing
- —
- Monthly P&I
- —
- Monthly cashflow
- —
- DSCR
- —
- Eligible?
- —
No personal income docs; deal must DSCR.
Hard money
10% down · 12.0% · 12mo
- Down + closing
- —
- Monthly P&I
- —
- Monthly cashflow
- —
- DSCR
- —
- Eligible?
- —
Short-term bridge; refi at stabilization.
Rent comps 8 comps
| Address | Beds | Baths | Sqft | Rent | $/sqft | DOM | Units | Dist |
|---|---|---|---|---|---|---|---|---|
| 451 Martin St Banning, CA | 1.0 | 1.0 | 854 | $1,845 | $2.16 | 16d | 1 | 0.58mi |
| 180 E Barbour St Unit C Banning, CA | 2.0 | 1.0 | 924 | $1,895 | $2.05 | 24d | 1 | 0.67mi |
| 1949 W Williams St Banning, CA | 3.0 | 2.0 | 1108 | $2,350 | $2.12 | 24d | 1 | 0.87mi |
| 263 N Evans St Unit A Banning, CA | 2.0 | 1.0 | 835 | $1,700 | $2.04 | 43d | 1 | 1.26mi |
| 654 N Allen St Banning, CA | 3.0 | 1.0 | 1128 | $2,200 | $1.95 | 5d | 1 | 1.27mi |
| 943 Wesley St Banning, CA | 3.0 | 2.0 | 1332 | $3,850 | $2.89 | 43d | 1 | 1.28mi |
| 359 Santa Rita Pl Banning, CA | 3.0 | 1.0 | 1352 | $2,200 | $1.63 | 43d | 1 | 1.29mi |
| 271 Park Ave Banning, CA | 1.0 | 1.0 | 700 | $1,700 | $2.43 | 16d | 1 | 1.44mi |
Listing history 21 events
-
2026-06-18days on market $39,000 Active 42 DOM
-
2026-06-17days on market $39,000 Active 41 DOM
-
2026-06-16days on market $39,000 Active 40 DOM
-
2026-06-15days on market $39,000 Active 39 DOM
-
2026-06-13days on market $39,000 Active 37 DOM
-
2026-06-13days on market $39,000 Active 36 DOM
-
2026-06-09days on market $39,000 Active 33 DOM
-
2026-06-08days on market $39,000 Active 32 DOM
-
2026-06-07days on market $39,000 Active 31 DOM
-
2026-06-04days on market $39,000 Active 28 DOM
-
2026-06-03days on market $39,000 Active 27 DOM
-
2026-06-02days on market $39,000 Active 26 DOM
-
2026-06-01days on market $39,000 Active 25 DOM
-
2026-05-31days on market $39,000 Active 24 DOM
-
2026-05-07$39,000 Active 816-char remark
-
2025-12-19soldstatus $32,000 Closed Sale 181-char remark
Show marketing remark (181 chars)
This 2 bedroom 1 bath trailer is situated in an all-ages community park. Buyer to qualify with the park. Conveniently located close to freeway and shopping. * Pictures coming soon *
-
2025-12-08status Pending Sale 181-char remark
Show marketing remark (181 chars)
This 2 bedroom 1 bath trailer is situated in an all-ages community park. Buyer to qualify with the park. Conveniently located close to freeway and shopping. * Pictures coming soon *
-
2025-10-27$35,000 Active 181-char remark
Show marketing remark (181 chars)
This 2 bedroom 1 bath trailer is situated in an all-ages community park. Buyer to qualify with the park. Conveniently located close to freeway and shopping. * Pictures coming soon *
-
2025-10-22historical
-
2025-08-29$53,500 Active
-
2025-08-28historical
ⓘ Source: listings_history table (triggers on properties + properties_extension) + one-shot
backfill from property_details.listing_events for pre-trigger history.
Climate risk First Street
- Flood 1/10 Low FEMA zone X (unshaded) · 0% chance over 30 yrs
- Wildfire 10/10 Extreme
- Heat 7/10 Severe 7 d/yr ≥98°F today · 20 d/yr by 30 yrs out
- Wind 1/10 Low
- Air quality 8/10 Severe 18 unhealthy d/yr today · 23 by 30 yrs out
Nearby sold comps map
Loading sold comps map…
Walkable amenities ~0.75 mi
Loading nearby amenities…
Taxation est. · year 1
- Rental income
- $26,246
- − Mortgage interest
- −$2,185
- − Property taxes
- −$585
- − Insurance
- −$195
- − Repairs & maintenance
- −$2,100
- − Management
- −$2,100
- − Depreciation
- −$1,135
- Taxable income
- $17,948
- Est. tax owed @ 24.0%
- −$4,307
- After-tax cash flow
- $13,193/yr
For passive investors: Depreciation is non-cash, so a rental often shows a tax loss while cash-flowing — sheltering income. Rental losses are passive: they offset passive income freely, and up to $25,000/yr can offset ordinary (W-2) income if you actively participate and your MAGI is under $100k (phasing out to $0 by $150k); unused losses carry forward. On sale, claimed depreciation is recaptured at up to 25%, and gains may owe capital-gains tax (a 1031 exchange can defer both). Figures are a year-1 estimate at your 24.0% rate — not tax advice; consult a CPA.
Schools (NCES district)
- District
- Banning Unified
- NCES district ID
- 0603840
- Math proficiency
- 15% ▬ 0.00%
- Reading proficiency
- 25% ▼ -1.00%
- Median HH income
- $39,303
- Composite
- 20.12/100
- National rank
- #13850
- State rank
- #1258 of 1400 in CA
Livability — Banning
- Score
- 48/100
- State rank
- #1192
- US rank
- #26047
Category grades
Schools grade is shown separately in the Schools card above.
Census & demographics
- Census place
- Banning, CA
- County
- Riverside County · 2,287,001 people
- City population
- 33,755
- Metro
- Riverside-San Bernardino-Ontario, CA
- Population (ZIP)
- 33,755
- Household income
- $62,599
- Rent vs Own
- Severe rent burden
- 1146.0
Population outlook (Riverside County) Hauer SSP2
- Today (2025)
- 2,664,475 people
- By 2030
- 2,802,692 · +5.2%
- By 2040
- 3,050,904 · +14.5%
- By 2050
- 3,256,783 · +22.2%
- By 2075
- 3,655,058 · +37.2%
- By 2100
- 3,766,594 · +41.4%
Race, ethnicity, and origin ACS 2023
- Neighborhood character
- Diverse neighborhood (Simpson 0.64)
- Race & ethnicity
- Hispanic / Latino 48% White 35% Two or more races 21% Black 6% Asian 5% Native American 4%
- Hispanic origin (detail)
- Mexican 44%
- Common ancestry
- Italian 1% Romanian 1% Portuguese 1%
- Foreign-born
- 17% · Canada, South Korea, China
- Languages at home
- 65% English-only · Spanish 29% Tagalog/Filipino 1% Other Indo-European 1%
Political lean MEDSL · Riverside
- 2024 margin
- Toss-up / Even · D 48.0% · R 49.3% · Other 2.6%
- 2008→2024 swing
- -3.6pp toward R · 2008: 2.3pp · 2024: -1.3pp
- All cycles
- 2024: R+1.3 2020: D+8.0 2016: D+4.3 2012: R+0.4 2008: D+2.3
Not yet ingested
- Civics
- —
Market trends
- HPI YoY
- ▼ -343.32%
- Current HPI
- 342.4268
- Rent YoY
- ▲ 3.58%
- Metro
- Riverside-San Bernardino-Ontario, CA
- State GDP YoY
- ▲ 3.21%
- F500 in state
- 116
Industry mix (Fortune 500 HQ in CA)
| Industry | F500 HQs | Revenue |
|---|---|---|
| Technology | 27 | $1,492B |
|
||
| Financial Services | 3 | $174B |
|
||
| Retail | 3 | $44B |
|
||
| Insurance | 3 | $26B |
|
||
| Media / Entertainment | 2 | $115B |
|
||
| Pharmaceuticals / Biotech | 2 | $62B |
|
||
Price history
-27.1% since first listed7 events — show timeline
- 2026-05-07 Listed $39,000 CRMLS
- 2025-12-19 Sold (MLS) $32,000 CRMLS
- 2025-12-08 Pending — CRMLS
- 2025-10-27 Listed $35,000 CRMLS
- 2025-10-22 Listing Removed — CRMLS
- 2025-08-29 Listed $53,500 CRMLS
- 2025-08-28 Coming Soon — CRMLS
Cash-flow waterfall
monthlySold comps — $/sqft
last 12 mo · ≤1 miLoading sold comps…