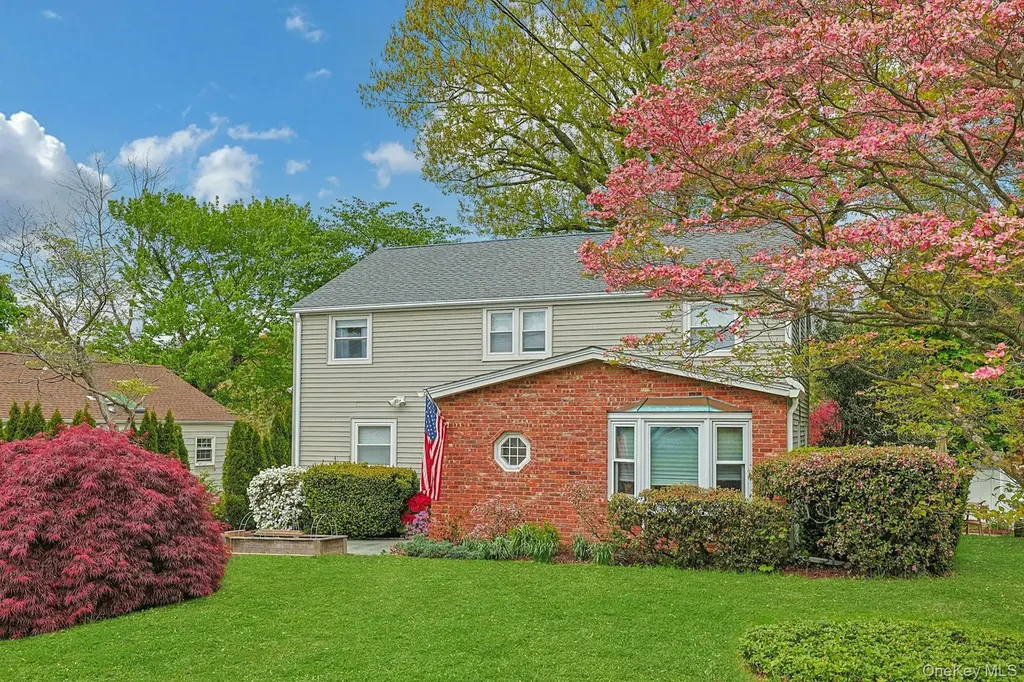
201 Westchester Ave · Thornwood, NY
Flood risk 1/10 · Minimal
- FEMA flood zone
- X (unshaded)
- Chance of flooding over 30 yrs
- 0.0%
- Est. flood insurance / yr
- $473 – $860
Fire risk 1/10 · Minimal
- Est. fire insurance / yr
- $691 – $1,283
Heat risk 5/10 · Moderate
- Hot days now (above 98°F)
- 7 days/yr
- Hot days in 30 yrs
- 15 days/yr
Wind risk 6/10 · Moderate
- Chance of severe wind over 30 yrs
- 27.0%
Air-quality risk 4/10 · Minor
- Unhealthy air days now
- 4 days/yr
- Unhealthy air days in 30 yrs
- 6 days/yr
Risk factors via First Street. Map © Google.
Why this score? — see what drove the C grade
The composite is a weighted blend of 9 inputs, each scored 0–100. Each bar is that input's sub-score; the figure is the points it added to the 100-point composite (weight × sub-score).
- Cash flow +24.0/30.0
- DSCR +7.7/10.0
- 1% rule +6.0/10.0
- Schools +6.0/10.0
- ARV discount +5.2/15.0
- Livability +3.6/5.0
- Rent growth +2.5/5.0
- Condition / age +2.5/5.0
- Appreciation +0.0/10.0
$835,000
🖨 Deal sheet 📄 Offer letter ✓ Due diligence
Listing remarks MLS
It's all about the location! If you love a classic style Colonial complete with modern amenities, this is the home for you. Home features a living room/dining room combination with gleaming hardwood floors, modern eat-in kitchen with granite counters and complemented with stainless steel appliances and door leading to deck and level yard, 1st floor bedroom, den and full bathroom with laundry. The master bedroom on the second floor is king-sized, there are 2 additional bedrooms and a full bath finishing the upstairs. This location is excellent for commuting by highway or train into NYC and very convenient to shopping, schools and all the amenities the Town of Mt. Pleasant offers. Additional Information: ParkingFeatures:1 Car Detached,
Key facts
- 6,368 sq ft lot
- Garage
- Community pool
Property features AI
Finance
- HOA & community: Community pool and park
Exterior
- Parking: Detached parking; Driveway; One garage space (1 total parking space)
- Utilities: Public sewer; Water connected; Trash collection (public); Electric service by Con-Edison
- Home design: Single-family residence; Two stories
- Construction: Brick, frame, and vinyl siding exterior
- Exterior features: Level lot; Near public transit; Near schools; Near shops; Community pool
Interior
- Kitchen: Dishwasher; Refrigerator; Granite counters
- Bedrooms: One bedroom on the first floor
- Flooring: Hardwood floors
- Bathrooms: Two full bathrooms
- Heating & cooling: Forced-air heating (natural gas); Central air conditioning
- Interior features: First-floor bedroom; Eat-in kitchen; Entrance foyer; Granite counters; Deck; Patio; Full, unfinished attic; Partial basement with Bilco doors and storage space; Seven total rooms; Two-level layout
- Laundry & utility: Washer; Dryer; Gas water heater
Neighborhood map
What this means for you Summary
Snapshot
- This is a 4-bed/2.0-bath single-family listed at $835k.
Deal economics
- At list price, monthly cash flow is $2k ($20k/yr) — positive.
- The deal already cash-flows at list — no discount required.
- Meets the 1% rule at list price ($9k rent vs $835k).
- Recommended offer: $822k (1.5% below list) — sets the bar for market timing.
- Cap rate 8.6% vs local median 5.7% in Thornwood — top-decile yield for the area; either an underpriced asset or a hidden risk that comps aren't pricing in. Stress-test before assuming the spread holds.
Location & tenants
- Location reads 71/100 on livability (#389 in NY) — a middle-class / working-renter tenant base. Strengths: crime A+, employment A+, housing A+; Watch: amenities F, commute F, cost of living F.
- Mount Pleasant Central School District (suburban): math 62% / reading 65% proficiency, ranked #146 of 590 in NY (top 25%) — acceptable for families but not a draw, mixed tenant base, ~2y average lease; only 5% free/reduced lunch — higher-income household profile.
- Zoned schools: Hawthorne Elementary School (460 students, 10% FRL); Westlake Middle School (math 55% / reading 61%, grade B, #184 of 729 statewide, top 25%, 429 students, 14% FRL); Westlake High School (math 72% / reading 95%, grade A, #409 of 1,100 statewide, top 39%, 547 students, 19% FRL).
- Market conditions: 33 active listings in the ZIP; 3 comparable units currently listed for rent nearby; rentals at typical pace (median 18d on market — plan ~3-4 weeks tenant-placement turnaround); 954 units permitted in Westchester County in 2024 (649 in 5+ unit buildings).
Forward outlook
- Local home prices are declining (-3.0%/yr); year-one equity from $6k of loan paydown is wiped out by about $25k of value loss. Plan a longer hold.
- Westchester County population projected at +10% by 2050 — modest demand growth; plan on rents tracking national, not racing it.
Negotiation context
- It's been on market 16 days — a 2% lower offer ($822k) is reasonable based on typical stale-listing flexibility.
- 2 sale attempts since 8y ago with the ask held roughly flat each time — persistent listings suggest the price (not the market) is what's stuck; bring a comps-based counter.
- Current owner paid $545k; list at $835k implies a 53% gain — meaningful room to come down on a strong offer.
Risks & watch-outs
- Watch-outs: built in 1936 — expect roof / HVAC / electrical / plumbing capex.
- Climate carrying-cost: major wind risk, 27% chance of damaging wind over 30y; extreme-heat days projected 7→15/yr by 2055 (HVAC capex compounding) — expect insurance premiums to compound above CPI over the hold.
Questions for the listing agent
- Built in 1936 — when were the roof, HVAC, electrical panel, plumbing, and water heater last replaced?
- Is there a deadline driving the sale (1031 exchange, divorce, estate, relocation)? That informs how much negotiation room exists.
- Schools are A-rated — typically a magnet for longer-tenancy family renters. What's the average tenant stay here, and is there a school-zone premium baked into asking?
- What's the average days-on-market for RENTAL listings here right now (not sales)? A rising rental-DOM trend means longer vacancies and softer asking-rent achievability than the comps imply.
- What's the recent tenant-quality profile in this submarket — average credit score on applications, eviction rate, late-payment / NSF rate, and stable-employment percentage? A property-management company in the area should have these aggregated.
- How much new for-sale + rental construction is in the pipeline within 1–3 miles? Heavy new supply typically softens prices + rents 12–24 months out; constrained supply supports both.
Investment metrics
- 1% rule
- 1.10% ✓
- Cap rate
- 8.64%
- Cash-on-cash
- 8.38%
- DSCR
- 1.37
- GRM
- 7.6
CMA / ARV
- ARV (on-the-fly)
- $793,650
- Comps found
- 10
Show comp detail 10 sales within ~0.75 mi
| Address | Dist | Beds/Ba | Sqft | Sold | Price | $/sf | Match |
|---|---|---|---|---|---|---|---|
| 151 Benedict Ave | 0.15mi | 4/1.0 | 1,465 (-11%) | 4mo | $725,000 | $495 | 67 |
| 86 Bainbridge Ave | 0.09mi | 3/2.5 (-1) | 1,626 (-2%) | 23mo | $620,000 | $381 | 67 |
| 144 Westchester Ave | 0.10mi | 4/2.0 | 1,800 (+9%) | 16mo | $770,000 | $428 | 67 |
| 907 Warren Ave | 0.29mi | 4/2.0 | 1,494 (-10%) | 13mo | $825,000 | $552 | 60 |
| 70 Highland Rd | 0.58mi | 3/2.5 (-1) | 1,656 (+0%) | 8mo | $800,000 | $483 | 59 |
| 72 Westchester Ave | 0.25mi | 3/3.0 (-1) | 1,790 (+8%) | 21mo | $825,000 | $461 | 48 |
| 911 Warren Ave | 0.28mi | 4/1.0 | 1,464 (-11%) | 22mo | $601,000 | $411 | 46 |
| 21 Meadowbrook Rd | 0.75mi | 3/2.0 (-1) | 1,745 (+6%) | 16mo | $839,000 | $481 | 37 |
| 98 Larrys Ln | 0.52mi | 4/3.5 | 1,866 (+13%) | 21mo | $1,025,000 | $549 | 31 |
| 685 Linda Ave | 0.67mi | 3/2.0 (-1) | 1,871 (+13%) | 22mo | $655,000 | $350 | 23 |
Match score weights: distance 35% · size 25% · config 20% · recency 20%. Top-matched comps best support the ARV.
Projected returns pro-forma
-3.0% appreciation · 3.0% rent growth · sell at horizon
- IRR
- -3.6%
- Equity multiple
- 0.87×
- Total profit
- $-31,345
- Equity at exit
- $124,501
- IRR
- 6.1%
- Equity multiple
- 1.46×
- Total profit
- $106,649
- Equity at exit
- $72,196
Cash invested: $233,800 (down + closing). Projections, not guarantees.
Landlord ↔ Tenant lean methodology
- Overall (STATE)
- 15 Strongly Tenant-Friendly
- State New York
- 15 Strongly Tenant-Friendly · D+10
- County
- — inherits STATE
- City
- — inherits STATE
ZIP-level market 10594
- Home prices YoY
- -18.7%
- Active inventory
- 33
- Price-to-rent
- 7.6×
Monthly cashflow live
- Estimated rent
- $9,143 medium interval (Pro) →
- Mortgage (P&I)
- −$4,379
- Tax from tax record
- −$865 /mo · $10,376/yr
- Insurance
- −$348
- HOA
- −$0
- Vacancy / Maint / Mgmt
- −$1,920
- Net cashflow
- $1,632
Break-even live
UW: 25.0% down · 7.5% · 30yr · 1.5% tax · 5.0% vac · 8.0% maint · 8.0% mgmt
Financing live
Cash to close
- Down payment
- $208,750
- Closing costs
- $25,050
- Reserves months
- —
- Total cash needed
- —
Loan-product check · same deal, 3 products live
Conventional
25% down · 7.5% · 30yr
- Down + closing
- —
- Monthly P&I
- —
- Monthly cashflow
- —
- DSCR
- —
- Eligible?
- —
Personal DTI + credit; lowest rate.
DSCR
20% down · 8.5% · 30yr
- Down + closing
- —
- Monthly P&I
- —
- Monthly cashflow
- —
- DSCR
- —
- Eligible?
- —
No personal income docs; deal must DSCR.
Hard money
10% down · 12.0% · 12mo
- Down + closing
- —
- Monthly P&I
- —
- Monthly cashflow
- —
- DSCR
- —
- Eligible?
- —
Short-term bridge; refi at stabilization.
Rent comps 3 comps
| Address | Beds | Baths | Sqft | Rent | $/sqft | DOM | Units | Dist |
|---|---|---|---|---|---|---|---|---|
| 10 Foxwood Ln Thornwood, NY | 4.0 | 3.5 | 2026 | $12,999 | $6.42 | 43d | 1 | 0.73mi |
| 568 Manville Rd Unit Upper R Pleasantville, NY | 4.0 | 2.5 | 2049 | $5,500 | $2.68 | 17d | 1 | 1.42mi |
| 568 Manville Rd Unit Upper R Pleasantville, NY | 4.0 | 2.5 | 2049 | $5,200 | $2.54 | 1d | 1 | 1.42mi |
Listing history 12 events
-
2026-06-07status $835,000 Pending 16 DOM
-
2026-06-04days on market $835,000 Active 16 DOM
-
2026-06-03days on market $835,000 Active 15 DOM
-
2026-06-02days on market $835,000 Active 14 DOM
-
2026-06-01days on market $835,000 Active 13 DOM
-
2026-05-31days on market $835,000 Active 12 DOM
-
2026-05-20$835,000 Active
-
2026-05-19historical $835,000
-
2018-08-21soldstatus $545,000
-
2018-07-25soldstatus $545,000 Sold 745-char remark
Show marketing remark (745 chars)
It's all about the location! If you love a classic style Colonial complete with modern amenities, this is the home for you. Home features a living room/dining room combination with gleaming hardwood floors, modern eat-in kitchen with granite counters and complemented with stainless steel appliances and door leading to deck and level yard, 1st floor bedroom, den and full bathroom with laundry. The master bedroom on the second floor is king-sized, there are 2 additional bedrooms and a full bath finishing the upstairs. This location is excellent for commuting by highway or train into NYC and very convenient to shopping, schools and all the amenities the Town of Mt. Pleasant offers. Additional Information: ParkingFeatures:1 Car Detached,
-
2018-06-15historical Pending 745-char remark
Show marketing remark (745 chars)
It's all about the location! If you love a classic style Colonial complete with modern amenities, this is the home for you. Home features a living room/dining room combination with gleaming hardwood floors, modern eat-in kitchen with granite counters and complemented with stainless steel appliances and door leading to deck and level yard, 1st floor bedroom, den and full bathroom with laundry. The master bedroom on the second floor is king-sized, there are 2 additional bedrooms and a full bath finishing the upstairs. This location is excellent for commuting by highway or train into NYC and very convenient to shopping, schools and all the amenities the Town of Mt. Pleasant offers. Additional Information: ParkingFeatures:1 Car Detached,
-
2018-05-02$537,000 Active 745-char remark
Show marketing remark (745 chars)
It's all about the location! If you love a classic style Colonial complete with modern amenities, this is the home for you. Home features a living room/dining room combination with gleaming hardwood floors, modern eat-in kitchen with granite counters and complemented with stainless steel appliances and door leading to deck and level yard, 1st floor bedroom, den and full bathroom with laundry. The master bedroom on the second floor is king-sized, there are 2 additional bedrooms and a full bath finishing the upstairs. This location is excellent for commuting by highway or train into NYC and very convenient to shopping, schools and all the amenities the Town of Mt. Pleasant offers. Additional Information: ParkingFeatures:1 Car Detached,
ⓘ Source: listings_history table (triggers on properties + properties_extension) + one-shot
backfill from property_details.listing_events for pre-trigger history.
Tax reassessment forecast NY · Partial reset (capped growth)
- Current annual tax
- $10,376 · $865/mo
- Projected year-2 tax
- $12,244 · $1,020/mo
- Expected delta
- +$1,868/yr (+$156/mo · 18.0%)
ⓘ Screening estimate from a state-policy table — verify with the county assessor before closing.
Climate risk First Street
- Flood 1/10 Low FEMA zone X (unshaded) · 0% chance over 30 yrs
- Wildfire 1/10 Low
- Heat 5/10 Major 7 d/yr ≥98°F today · 15 d/yr by 30 yrs out
- Wind 6/10 Major 27% chance of damaging wind over 30 yrs
- Air quality 4/10 Moderate 4 unhealthy d/yr today · 6 by 30 yrs out
Nearby sold comps map
Loading sold comps map…
Walkable amenities ~0.75 mi
Loading nearby amenities…
Taxation est. · year 1
- Rental income
- $109,720
- − Mortgage interest
- −$46,773
- − Property taxes
- −$10,376
- − Insurance
- −$4,175
- − Repairs & maintenance
- −$8,778
- − Management
- −$8,778
- − Depreciation
- −$24,291
- Taxable income
- $6,550
- Est. tax owed @ 24.0%
- −$1,572
- After-tax cash flow
- $18,010/yr
For passive investors: Depreciation is non-cash, so a rental often shows a tax loss while cash-flowing — sheltering income. Rental losses are passive: they offset passive income freely, and up to $25,000/yr can offset ordinary (W-2) income if you actively participate and your MAGI is under $100k (phasing out to $0 by $150k); unused losses carry forward. On sale, claimed depreciation is recaptured at up to 25%, and gains may owe capital-gains tax (a 1031 exchange can defer both). Figures are a year-1 estimate at your 24.0% rate — not tax advice; consult a CPA.
Schools (NCES district)
- District
- Mount Pleasant Central School District
- NCES district ID
- 3620160
- Math proficiency
- 62% ▼ -16.00%
- Reading proficiency
- 65% ▲ 3.00%
- Median HH income
- $109,054
- Composite
- 59.62/100
- National rank
- #911
- State rank
- #146 of 590 in NY
Livability — Thornwood
- Score
- 71/100
- State rank
- #389
- US rank
- #6724
Category grades
Schools grade is shown separately in the Schools card above.
Census & demographics
- Census place
- Thornwood, NY
- Population (ZIP)
- 5,512
Population outlook (Westchester County) Hauer SSP2
- Today (2025)
- 1,028,035 people
- By 2030
- 1,051,636 · +2.3%
- By 2040
- 1,098,520 · +6.9%
- By 2050
- 1,136,044 · +10.5%
- By 2075
- 1,196,925 · +16.4%
- By 2100
- 1,175,147 · +14.3%
Race, ethnicity, and origin ACS 2023
- Neighborhood character
- Predominantly White (83%)
- Race & ethnicity
- White 83% Hispanic / Latino 9% Two or more races 4% Asian 4%
- Hispanic origin (detail)
- Mexican 4%
- Common ancestry
- Romanian 4% Scotch-Irish 2% Russian 2%
- Foreign-born
- 16% · Canada, China
- Languages at home
- 78% English-only · Other Indo-European 12% Spanish 7% Other Asian/Pacific 1%
Political lean MEDSL · Westchester
- 2024 margin
- Strong D (+26.3) · D 63.1% · R 36.9%
- 2008→2024 swing
- -1.3pp toward R · 2008: 27.6pp · 2024: 26.3pp
- All cycles
- 2024: D+26.3 2020: D+36.3 2016: D+32.8 2012: D+22.2 2008: D+27.6
Not yet ingested
- Civics
- —
Market trends
- HPI YoY
- ▼ -65.72%
- Current HPI
- 286.025
- Rent YoY
- —
- Metro
- —
- State GDP YoY
- ▲ 2.60%
- F500 in state
- 92
Industry mix (Fortune 500 HQ in NY)
| Industry | F500 HQs | Revenue |
|---|---|---|
| Financial Services | 10 | $950B |
|
||
| Consumer Goods | 9 | $162B |
|
||
| Insurance | 4 | $225B |
|
||
| Telecommunications | 2 | $144B |
|
||
| Pharmaceuticals | 2 | $112B |
|
||
| Media / Entertainment | 2 | $69B |
|
||
Price history
+55.5% since first listed6 events — show timeline
- 2026-05-20 Listed $835,000 OneKey® MLS as Distributed by MLS Grid
- 2026-05-19 Coming Soon $835,000 OneKey® MLS as Distributed by MLS Grid
- 2018-08-21 Sold (Public Records) $545,000 Public Records
- 2018-07-25 Sold (MLS) $545,000 OneKey® MLS as Distributed by MLS Grid
- 2018-06-15 Contingent — OneKey® MLS as Distributed by MLS Grid
- 2018-05-02 Listed $537,000 OneKey® MLS as Distributed by MLS Grid
Property tax history
+1.4%/yrLatest (2025): $10,376 · -0.3% YoY. Source: county tax records.
Cash-flow waterfall
monthlySold comps — $/sqft
last 12 mo · ≤1 miLoading sold comps…