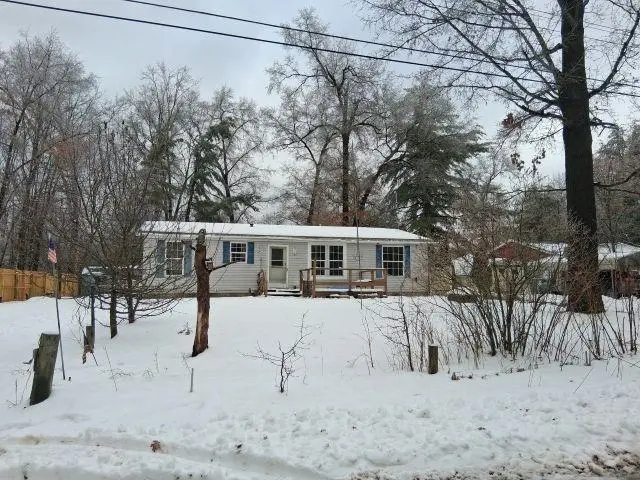
1645 7th. St · Mills, MI
Flood risk 1/10 · Minimal
- FEMA flood zone
- —
- Chance of flooding over 30 yrs
- 0.0%
- Est. flood insurance / yr
- —
Fire risk 4/10 · Minor
- Est. fire insurance / yr
- $784 – $1,456
Heat risk 1/10 · Minimal
- Hot days now (above 94°F)
- 7 days/yr
- Hot days in 30 yrs
- 13 days/yr
Wind risk 1/10 · Minimal
- Chance of severe wind over 30 yrs
- —
Air-quality risk 2/10 · Minimal
- Unhealthy air days now
- 0 days/yr
- Unhealthy air days in 30 yrs
- 1 days/yr
Risk factors via First Street. Map © Google.
Why this score? — see what drove the B- grade
The composite is a weighted blend of 9 inputs, each scored 0–100. Each bar is that input's sub-score; the figure is the points it added to the 100-point composite (weight × sub-score).
- Cash flow +30.0/30.0
- DSCR +10.0/10.0
- 1% rule +9.4/10.0
- ARV discount +8.8/15.0
- Rent growth +2.5/5.0
- Livability +2.5/5.0
- Condition / age +2.5/5.0
- Schools +1.4/10.0
- Appreciation +0.0/10.0
$77,000
🖨 Deal sheet 📄 Offer letter ✓ Due diligence
Listing remarks MLS
Enjoy this wonderful location and make this affordable ranch your own. Set in a growing area with something for everyone, this home is perfect whether you’re ready to retire, work, or simply play. The lifestyle here truly has it all. Opportunities like this don’t last long—don’t wait on this one.
Key facts
- Built 2003
- Listed 84 days
Neighborhood map
What this means for you Summary
Snapshot
- This is a 3-bed/1.0-bath single-family listed at $77k.
Deal economics
- At list price, monthly cash flow is $379 ($5k/yr) — positive.
- The deal already cash-flows at list — no discount required.
- Meets the 1% rule at list price ($1k rent vs $77k).
- Recommended offer: $72k (6.0% below list) — sets the bar for market timing.
Location & tenants
- Location reads: area grade B — affects rentability + tenant quality, not the cash-flow math above.
- Whittemore-Prescott Area Schools (rural): math 11% / reading 25% proficiency, ranked #488 of 540 in MI (top 90%) — low school quality limits family demand, transient renter base, plan for 1-2y turnover; 71% free/reduced lunch — lower-income household profile, screen leases tightly.
- Market conditions: 55 active listings in the ZIP; 57 units permitted in Ogemaw County in 2024 (0 in 5+ unit buildings).
Forward outlook
- Local home prices are declining (-3.0%/yr); year-one equity from $532 of loan paydown is wiped out by about $2k of value loss. Plan a longer hold.
- Ogemaw County population projected at -26% by 2050 — secular population decline; favor cash flow + early exit over multi-decade hold.
- At projected returns (-3.0% appreciation + 3.0% rent growth), your $22k cash investment doubles in ~6 years — after that, you're playing with house money.
Negotiation context
- It's been on market 85 days — a 6% lower offer ($72k) is reasonable based on typical stale-listing flexibility.
- 2 sale attempts; this cycle's ask has dropped $13k (14%) from the opening price — seller is motivated, your offer sets the floor, not the list.
Questions for the listing agent
- It's been on market 85 days. Have you received any prior offers? Is the seller open to a 6% concession, seller financing, or rate buy-down credit?
- Why hasn't it sold? Are there any deal-killer items the seller is aware of (foundation, flood, title, zoning, code violations)?
- Is there a deadline driving the sale (1031 exchange, divorce, estate, relocation)? That informs how much negotiation room exists.
- What's the average days-on-market for RENTAL listings here right now (not sales)? A rising rental-DOM trend means longer vacancies and softer asking-rent achievability than the comps imply.
- What's the recent tenant-quality profile in this submarket — average credit score on applications, eviction rate, late-payment / NSF rate, and stable-employment percentage? A property-management company in the area should have these aggregated.
- How much new for-sale + rental construction is in the pipeline within 1–3 miles? Heavy new supply typically softens prices + rents 12–24 months out; constrained supply supports both.
Investment metrics
- 1% rule
- 1.44% ✓
- Cap rate
- 12.20%
- Cash-on-cash
- 21.09%
- DSCR
- 1.94
- GRM
- 5.8
CMA / ARV
- ARV (median comp)
- $79,352
- List price
- $77,000
- Delta
- -2.96%
- Verdict
- FAIR
- Comps
- 20 within 1.0 mi
Show comp detail 10 sales within ~0.75 mi
| Address | Dist | Beds/Ba | Sqft | Sold | Price | $/sf | Match |
|---|---|---|---|---|---|---|---|
| 1900 Third Oak St | 0.65mi | 3/1.0 | 1,250 (+2%) | 14mo | $59,900 | $48 | 56 |
| 5279 Oak | 0.60mi | 3/1.0 | 1,250 (+2%) | 18mo | $38,000 | $30 | 55 |
| 5279 Oak | 0.60mi | 3/1.0 | 1,250 (+2%) | 18mo | $38,000 | $30 | 55 |
| 5347 Oak Dr | 0.49mi | 2/1.0 (-1) | 1,064 (-14%) | 2mo | $116,000 | $109 | 48 |
| 5316 Chippewa Trl | 0.52mi | 4/1.0 (+1) | 1,328 (+8%) | 16mo | $106,000 | $80 | 44 |
| 1549 E Greenwood Rd | 0.68mi | 2/1.0 (-1) | 1,260 (+2%) | 20mo | $83,000 | $66 | 42 |
| 1931 Tammy Dr | 0.56mi | 3/2.0 | 1,144 (-7%) | 19mo | $105,000 | $92 | 42 |
| 5276 Silver Creek Dr | 0.58mi | 2/1.0 (-1) | 1,088 (-12%) | 9mo | $72,000 | $66 | 40 |
| 5312 Oakhill Dr | 0.66mi | 2/1.0 (-1) | 1,375 (+12%) | 22mo | $128,647 | $94 | 27 |
| 5329 Skunk Hollow Rd | 0.68mi | 2/1.0 (-1) | 1,092 (-11%) | 23mo | $45,000 | $41 | 25 |
Match score weights: distance 35% · size 25% · config 20% · recency 20%. Top-matched comps best support the ARV.
Projected returns pro-forma
-3.0% appreciation · 3.0% rent growth · sell at horizon
- IRR
- 13.5%
- Equity multiple
- 1.54×
- Total profit
- $11,653
- Equity at exit
- $11,481
- IRR
- 22.4%
- Equity multiple
- 2.91×
- Total profit
- $41,203
- Equity at exit
- $6,658
Cash invested: $21,560 (down + closing). Projections, not guarantees.
Landlord ↔ Tenant lean methodology
- Overall (STATE)
- 62 Landlord-Friendly
- State Michigan
- 62 Landlord-Friendly · EVEN
- County
- — inherits STATE
- City
- — inherits STATE
ZIP-level market 48756
- Home prices YoY
- -9.7%
- Active inventory
- 55
- Price-to-rent
- 5.8×
Monthly cashflow live
- Estimated rent
- $1,107 medium interval (Pro) →
- Mortgage (P&I)
- −$404
- Tax from tax record
- −$60 /mo · $718/yr
- Insurance
- −$32
- HOA
- −$0
- Vacancy / Maint / Mgmt
- −$233
- Net cashflow
- $379
Break-even live
UW: 25.0% down · 7.5% · 30yr · 1.5% tax · 5.0% vac · 8.0% maint · 8.0% mgmt
Financing live
Cash to close
- Down payment
- $19,250
- Closing costs
- $2,310
- Reserves months
- —
- Total cash needed
- —
Loan-product check · same deal, 3 products live
Conventional
25% down · 7.5% · 30yr
- Down + closing
- —
- Monthly P&I
- —
- Monthly cashflow
- —
- DSCR
- —
- Eligible?
- —
Personal DTI + credit; lowest rate.
DSCR
20% down · 8.5% · 30yr
- Down + closing
- —
- Monthly P&I
- —
- Monthly cashflow
- —
- DSCR
- —
- Eligible?
- —
No personal income docs; deal must DSCR.
Hard money
10% down · 12.0% · 12mo
- Down + closing
- —
- Monthly P&I
- —
- Monthly cashflow
- —
- DSCR
- —
- Eligible?
- —
Short-term bridge; refi at stabilization.
Listing history 19 events
-
2026-06-18days on market $77,000 Active 85 DOM
-
2026-06-17days on market $77,000 Active 84 DOM
-
2026-06-16days on market $77,000 Active 83 DOM
-
2026-06-15days on market $77,000 Active 82 DOM
-
2026-06-13days on market $77,000 Active 80 DOM
-
2026-06-12days on market $77,000 Active 79 DOM
-
2026-06-09days on market $77,000 Active 76 DOM
-
2026-06-08days on market $77,000 Active 75 DOM
-
2026-06-07days on market $77,000 Active 74 DOM
-
2026-06-07days on market $77,000 Active 73 DOM
-
2026-06-04days on market $77,000 Active 70 DOM
-
2026-06-02days on market $77,000 Active 69 DOM
-
2026-06-01days on market $77,000 Active 68 DOM
-
2026-05-31days on market $77,000 Active 67 DOM
-
2026-05-31days on market $77,000 Active 66 DOM
-
2026-05-09price $77,000 321-char remark
Show marketing remark (297 chars)
Enjoy this wonderful location and make this affordable ranch your own. Set in a growing area with something for everyone, this home is perfect whether you're ready to retire, work, or simply play. The lifestyle here truly has it all. Opportunities like this don't last long-don't wait on this one.
-
2026-05-09price $77,000 297-char remark
Show marketing remark (297 chars)
Enjoy this wonderful location and make this affordable ranch your own. Set in a growing area with something for everyone, this home is perfect whether you're ready to retire, work, or simply play. The lifestyle here truly has it all. Opportunities like this don't last long-don't wait on this one.
-
2026-03-25$89,900 Active 321-char remark
Show marketing remark (297 chars)
Enjoy this wonderful location and make this affordable ranch your own. Set in a growing area with something for everyone, this home is perfect whether you're ready to retire, work, or simply play. The lifestyle here truly has it all. Opportunities like this don't last long-don't wait on this one.
-
2026-03-25$89,900 Active 297-char remark
Show marketing remark (297 chars)
Enjoy this wonderful location and make this affordable ranch your own. Set in a growing area with something for everyone, this home is perfect whether you're ready to retire, work, or simply play. The lifestyle here truly has it all. Opportunities like this don't last long-don't wait on this one.
ⓘ Source: listings_history table (triggers on properties + properties_extension) + one-shot
backfill from property_details.listing_events for pre-trigger history.
Tax reassessment forecast MI · Partial reset (capped growth)
- Current annual tax
- $718 · $60/mo
- Projected year-2 tax
- $952 · $79/mo
- Expected delta
- +$234/yr (+$19/mo · 32.6%)
ⓘ Screening estimate from a state-policy table — verify with the county assessor before closing.
Climate risk First Street
- Flood 1/10 Low 0% chance over 30 yrs
- Wildfire 4/10 Moderate
- Heat 1/10 Low 7 d/yr ≥94°F today · 13 d/yr by 30 yrs out
- Wind 1/10 Low
- Air quality 2/10 Low 0 unhealthy d/yr today · 1 by 30 yrs out
Nearby sold comps map
Loading sold comps map…
Walkable amenities ~0.75 mi
Loading nearby amenities…
Taxation est. · year 1
- Rental income
- $13,286
- − Mortgage interest
- −$4,313
- − Property taxes
- −$718
- − Insurance
- −$385
- − Repairs & maintenance
- −$1,063
- − Management
- −$1,063
- − Depreciation
- −$2,240
- Taxable income
- $3,504
- Est. tax owed @ 24.0%
- −$841
- After-tax cash flow
- $3,706/yr
For passive investors: Depreciation is non-cash, so a rental often shows a tax loss while cash-flowing — sheltering income. Rental losses are passive: they offset passive income freely, and up to $25,000/yr can offset ordinary (W-2) income if you actively participate and your MAGI is under $100k (phasing out to $0 by $150k); unused losses carry forward. On sale, claimed depreciation is recaptured at up to 25%, and gains may owe capital-gains tax (a 1031 exchange can defer both). Figures are a year-1 estimate at your 24.0% rate — not tax advice; consult a CPA.
Schools (NCES district)
- District
- Whittemore-Prescott Area Schools
- NCES district ID
- 2636390
- Math proficiency
- 11% ▼ -12.00%
- Reading proficiency
- 25% ▼ -11.00%
- Median HH income
- $30,244
- Composite
- 14.31/100
- National rank
- #9442
- State rank
- #488 of 540 in MI
Livability — Mills
No livability data for this city. (Only ~50 U.S. cities are tracked.)
Census & demographics
- Census place
- Skidway Lake, MI
- Population (ZIP)
- 3,939
Population outlook (Ogemaw County) Hauer SSP2
- Today (2025)
- 19,373 people
- By 2030
- 18,348 · -5.3%
- By 2040
- 16,176 · -16.5%
- By 2050
- 14,294 · -26.2%
- By 2075
- 11,280 · -41.8%
- By 2100
- 8,942 · -53.8%
Race, ethnicity, and origin ACS 2023
- Neighborhood character
- Predominantly White (94%)
- Race & ethnicity
- White 94% Two or more races 4% Hispanic / Latino 3%
- Common ancestry
- Romanian 9% Lithuanian 4% Slovak 3%
- Foreign-born
- 1% · Canada
- Languages at home
- 99% English-only · Spanish 1% German/W. Germanic 1%
Political lean MEDSL · Ogemaw
- 2024 margin
- Solid R (+42.0) · D 28.4% · R 70.4% · Other 1.3%
- 2008→2024 swing
- -44.4pp toward R · 2008: 2.4pp · 2024: -42.0pp
- All cycles
- 2024: R+42.0 2020: R+40.1 2016: R+36.6 2012: R+6.2 2008: D+2.4
Not yet ingested
- Civics
- —
Market trends
- HPI YoY
- ▼ -22.88%
- Current HPI
- 213.8025
- Rent YoY
- —
- Metro
- —
- State GDP YoY
- ▲ 1.37%
- F500 in state
- 28
Industry mix (Fortune 500 HQ in MI)
| Industry | F500 HQs | Revenue |
|---|---|---|
| Automotive Parts | 3 | $48B |
|
||
| Automotive | 2 | $372B |
|
||
| Chemicals | 1 | $45B |
|
||
| Automotive Retail | 1 | $29B |
|
||
| Healthcare / Medical Devices | 1 | $23B |
|
||
| Automotive Technology | 1 | $20B |
|
||
Price history
-14.3% since first listed4 events — show timeline
- 2026-05-09 Price Changed $77,000 MiRealSource-MiMLS
- 2026-05-09 Price Changed $77,000 REALCOMP
- 2026-03-25 Listed $89,900 REALCOMP
- 2026-03-25 Listed $89,900 MiRealSource-MiMLS
Property tax history
+3.7%/yrLatest (2024): $718 · +9.1% YoY. Source: county tax records.
Cash-flow waterfall
monthlySold comps — $/sqft
last 12 mo · ≤1 miLoading sold comps…