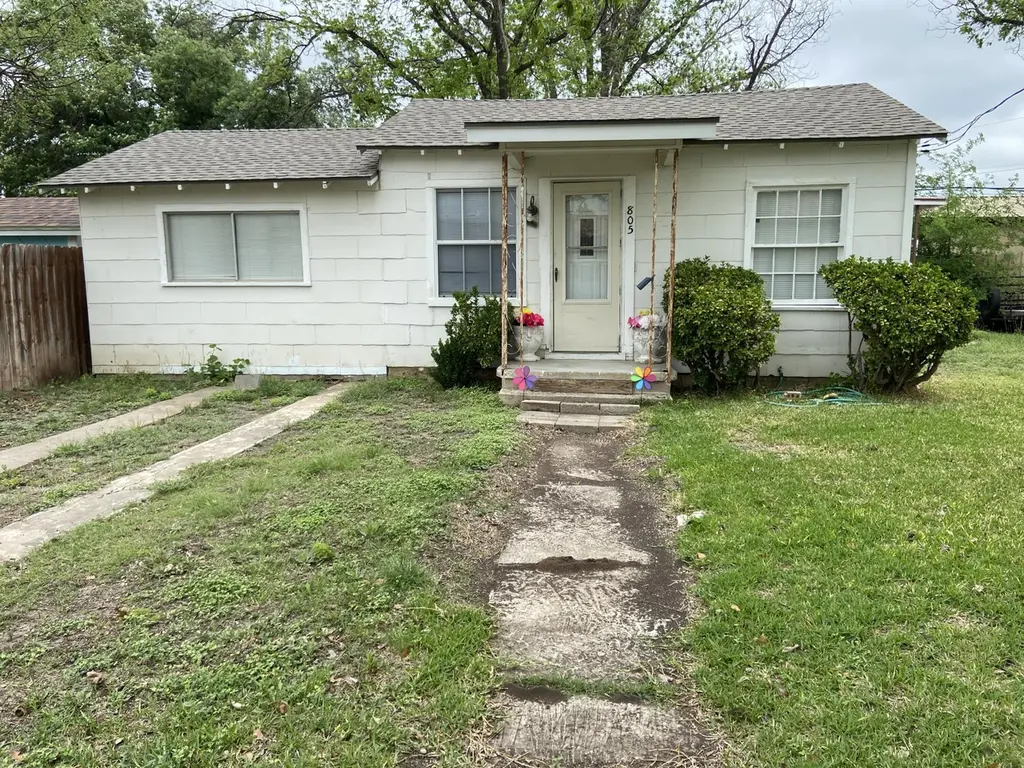
805 Mesquite Ave · Sonora, TX
Flood risk 7/10 · Major
- FEMA flood zone
- —
- Chance of flooding over 30 yrs
- 0.75%
- Est. flood insurance / yr
- —
Fire risk 5/10 · Moderate
- Est. fire insurance / yr
- $1,222 – $2,270
Heat risk 6/10 · Moderate
- Hot days now (above 104°F)
- 7 days/yr
- Hot days in 30 yrs
- 24 days/yr
Wind risk 4/10 · Minor
- Chance of severe wind over 30 yrs
- 15.0%
Air-quality risk 1/10 · Minimal
- Unhealthy air days now
- 0 days/yr
- Unhealthy air days in 30 yrs
- 0 days/yr
Risk factors via First Street. Map © Google.
Why this score? — see what drove the A- grade
The composite is a weighted blend of 9 inputs, each scored 0–100. Each bar is that input's sub-score; the figure is the points it added to the 100-point composite (weight × sub-score).
- Cash flow +30.0/30.0
- ARV discount +15.0/15.0
- DSCR +10.0/10.0
- 1% rule +9.1/10.0
- Appreciation +6.9/10.0
- Schools +4.2/10.0
- Livability +3.9/5.0
- Rent growth +2.5/5.0
- Condition / age +2.5/5.0
$64,000
🖨 Deal sheet 📄 Offer letter ✓ Due diligence
Listing remarks MLS
Own for Less Than Rent - Now FHA Ready! Located at 805 Mesquite in Sonora, TX, this 3 bedroom, 2 bath home offers 1,156 sq. ft. of living space on a small, low-maintenance lot—perfect for easy living. Recent updates have made this home FHA compliant, including a new roof, replaced window panes and additional exterior repairs giving buyers peace of mind and more financing options. Inside, you'll find a sunken living room with tiled floors that adds character, along with central heating and air for year-round comfort. The kitchen includes a range/oven and refrigerator, and a separate laundry room houses the washer and dryer—both included in the sale. While still offering room for your own updates and personal touch, the major improvements are already in place. This makes it a great option for buyers looking for affordability with upside, or investors wanting a solid property with key repairs already handled.
Key facts
- Tiled floors
- Washer and dryer
- Sunken living room
Tags
Neighborhood map
What this means for you Summary
Snapshot
- This is a 3-bed/2.0-bath single-family listed at $64k.
Deal economics
- At list price, monthly cash flow is $282 ($3k/yr) — positive.
- The deal already cash-flows at list — no discount required.
- Meets the 1% rule at list price ($900 rent vs $64k).
- Recommended offer: $58k (9.0% below list) — sets the bar for market timing.
Location & tenants
- Location reads 77/100 on livability (#83 in TX, #2,963 nationally) — a middle-class / working-renter tenant base. Strengths: cost of living A+, housing A+, health & safety A+; Watch: schools C-, employment C-, amenities F.
- Sonora ISD (town): math 52% / reading 46% proficiency, ranked #189 of 826 in TX (top 23%) — families likely to look elsewhere, expect single-tenant / working-renter base with shorter leases.
- Market conditions: 50 active listings in the ZIP; 1 comparable units currently listed for rent nearby.
Forward outlook
- In year one you build about $3k of equity ($442 loan paydown + $2k appreciation (3.7% local appreciation)).
- Sutton County population projected at -23% by 2050 — secular population decline; favor cash flow + early exit over multi-decade hold.
- At projected returns (3.7% appreciation + 3.0% rent growth), your $18k cash investment doubles in ~3 years — after that, you're playing with house money.
Negotiation context
- It's been on market 93 days — a 9% lower offer ($58k) is reasonable based on typical stale-listing flexibility.
- 3 sale attempts with the ask held roughly flat each time — persistent listings suggest the price (not the market) is what's stuck; bring a comps-based counter.
Risks & watch-outs
- Watch-outs: built in 1950 — expect roof / HVAC / electrical / plumbing capex.
- Climate carrying-cost: major flood risk; moderate wildfire risk; extreme-heat days projected 7→24/yr by 2055 (HVAC capex compounding) — expect insurance premiums to compound above CPI over the hold.
Questions for the listing agent
- It's been on market 93 days. Have you received any prior offers? Is the seller open to a 9% concession, seller financing, or rate buy-down credit?
- Built in 1950 — when were the roof, HVAC, electrical panel, plumbing, and water heater last replaced?
- Why hasn't it sold? Are there any deal-killer items the seller is aware of (foundation, flood, title, zoning, code violations)?
- Is there a deadline driving the sale (1031 exchange, divorce, estate, relocation)? That informs how much negotiation room exists.
- What's the average days-on-market for RENTAL listings here right now (not sales)? A rising rental-DOM trend means longer vacancies and softer asking-rent achievability than the comps imply.
- What's the recent tenant-quality profile in this submarket — average credit score on applications, eviction rate, late-payment / NSF rate, and stable-employment percentage? A property-management company in the area should have these aggregated.
- How much new for-sale + rental construction is in the pipeline within 1–3 miles? Heavy new supply typically softens prices + rents 12–24 months out; constrained supply supports both.
Investment metrics
- 1% rule
- 1.41% ✓
- Cap rate
- 11.59%
- Cash-on-cash
- 18.92%
- DSCR
- 1.84
- GRM
- 5.9
CMA / ARV
- ARV (median comp)
- $109,376
- List price
- $64,000
- Delta
- -41.49%
- Verdict
- UNDERPRICED
- Comps
- 20 within 1.0 mi
Show comp detail 3 sales within ~0.75 mi
| Address | Dist | Beds/Ba | Sqft | Sold | Price | $/sf | Match |
|---|---|---|---|---|---|---|---|
| 205 Paso Del Norte | 0.53mi | 2/2.0 (-1) | 1,000 (-14%) | 7mo | $45,000 | $45 | 42 |
| 205 E 2nd St | 0.30mi | 3/1.0 | 1,313 (+14%) | 23mo | $135,000 | $103 | 40 |
| 1512 S Crockett Ave | 0.53mi | 2/2.0 (-1) | 1,058 (-8%) | 22mo | $93,000 | $88 | 38 |
Match score weights: distance 35% · size 25% · config 20% · recency 20%. Top-matched comps best support the ARV.
Projected returns pro-forma
3.73% appreciation · 3.0% rent growth · sell at horizon
- IRR
- 26.8%
- Equity multiple
- 2.57×
- Total profit
- $28,219
- Equity at exit
- $31,449
- IRR
- 26.8%
- Equity multiple
- 5.03×
- Total profit
- $72,245
- Equity at exit
- $50,656
Cash invested: $17,920 (down + closing). Projections, not guarantees.
Landlord ↔ Tenant lean methodology
- Overall (STATE)
- 87 Strongly Landlord-Friendly
- State Texas
- 87 Strongly Landlord-Friendly · R+5
- County
- — inherits STATE
- City
- — inherits STATE
ZIP-level market 76950
- Home prices YoY
- 3.2%
- Active inventory
- 50
- Price-to-rent
- 5.9×
Monthly cashflow live
- Estimated rent
- $900 medium interval (Pro) →
- Mortgage (P&I)
- −$336
- Tax from tax record
- −$66 /mo · $795/yr
- Insurance
- −$27
- HOA
- −$0
- Vacancy / Maint / Mgmt
- −$189
- Net cashflow
- $282
Break-even live
UW: 25.0% down · 7.5% · 30yr · 1.5% tax · 5.0% vac · 8.0% maint · 8.0% mgmt
Financing live
Cash to close
- Down payment
- $16,000
- Closing costs
- $1,920
- Reserves months
- —
- Total cash needed
- —
Loan-product check · same deal, 3 products live
Conventional
25% down · 7.5% · 30yr
- Down + closing
- —
- Monthly P&I
- —
- Monthly cashflow
- —
- DSCR
- —
- Eligible?
- —
Personal DTI + credit; lowest rate.
DSCR
20% down · 8.5% · 30yr
- Down + closing
- —
- Monthly P&I
- —
- Monthly cashflow
- —
- DSCR
- —
- Eligible?
- —
No personal income docs; deal must DSCR.
Hard money
10% down · 12.0% · 12mo
- Down + closing
- —
- Monthly P&I
- —
- Monthly cashflow
- —
- DSCR
- —
- Eligible?
- —
Short-term bridge; refi at stabilization.
Rent comps 1 comps
| Address | Beds | Baths | Sqft | Rent | $/sqft | DOM | Units | Dist |
|---|---|---|---|---|---|---|---|---|
| 1412 S Crockett Ave Sonora, TX | 2.0 | 1.0 | 1496 | $900 | $0.60 | 43d | 1 | 0.49mi |
Listing history 21 events
-
2026-06-18days on market $64,000 Active 93 DOM
-
2026-06-17days on market $64,000 Active 92 DOM
-
2026-06-16days on market $64,000 Active 91 DOM
-
2026-06-15days on market $64,000 Active 90 DOM
-
2026-06-15days on market $64,000 Active 89 DOM
-
2026-06-13days on market $64,000 Active 88 DOM
-
2026-06-12days on market $64,000 Active 87 DOM
-
2026-06-09days on market $64,000 Active 84 DOM
-
2026-06-08days on market $64,000 Active 83 DOM
-
2026-06-08days on market $64,000 Active 82 DOM
-
2026-06-07days on market $64,000 Active 81 DOM
-
2026-06-03days on market $64,000 Active 78 DOM
-
2026-06-02days on market $64,000 Active 77 DOM
-
2026-06-01days on market $64,000 Active 76 DOM
-
2026-05-31days on market $64,000 Active 75 DOM
-
2026-04-21price $64,000 931-char remark
Show marketing remark (931 chars)
Own for Less Than Rent - Now FHA Ready! Located at 805 Mesquite in Sonora, TX, this 3 bedroom, 2 bath home offers 1,156 sq. ft. of living space on a small, low-maintenance lot—perfect for easy living. Recent updates have made this home FHA compliant, including a new roof, replaced window panes and additional exterior repairs giving buyers peace of mind and more financing options. Inside, you'll find a sunken living room with tiled floors that adds character, along with central heating and air for year-round comfort. The kitchen includes a range/oven and refrigerator, and a separate laundry room houses the washer and dryer—both included in the sale. While still offering room for your own updates and personal touch, the major improvements are already in place. This makes it a great option for buyers looking for affordability with upside, or investors wanting a solid property with key repairs already handled.
-
2026-03-11$63,500 Active 931-char remark
Show marketing remark (931 chars)
Own for Less Than Rent - Now FHA Ready! Located at 805 Mesquite in Sonora, TX, this 3 bedroom, 2 bath home offers 1,156 sq. ft. of living space on a small, low-maintenance lot—perfect for easy living. Recent updates have made this home FHA compliant, including a new roof, replaced window panes and additional exterior repairs giving buyers peace of mind and more financing options. Inside, you'll find a sunken living room with tiled floors that adds character, along with central heating and air for year-round comfort. The kitchen includes a range/oven and refrigerator, and a separate laundry room houses the washer and dryer—both included in the sale. While still offering room for your own updates and personal touch, the major improvements are already in place. This makes it a great option for buyers looking for affordability with upside, or investors wanting a solid property with key repairs already handled.
-
2025-09-30status Active
-
2025-09-30price $61,100
-
2025-02-07$59,900 Active
-
2019-07-09soldstatus
ⓘ Source: listings_history table (triggers on properties + properties_extension) + one-shot
backfill from property_details.listing_events for pre-trigger history.
Tax reassessment forecast TX · Resets to sale price
- Current annual tax
- $795 · $66/mo
- Projected year-2 tax
- $1,171 · $98/mo
- Expected delta
- +$377/yr (+$31/mo · 47.4%)
ⓘ Screening estimate from a state-policy table — verify with the county assessor before closing.
Climate risk First Street
- Flood 7/10 Severe 75% chance over 30 yrs
- Wildfire 5/10 Major
- Heat 6/10 Major 7 d/yr ≥104°F today · 24 d/yr by 30 yrs out
- Wind 4/10 Moderate 15% chance of damaging wind over 30 yrs
- Air quality 1/10 Low 0 unhealthy d/yr today · 0 by 30 yrs out
Nearby sold comps map
Loading sold comps map…
Walkable amenities ~0.75 mi
Loading nearby amenities…
Taxation est. · year 1
- Rental income
- $10,800
- − Mortgage interest
- −$3,585
- − Property taxes
- −$795
- − Insurance
- −$320
- − Repairs & maintenance
- −$864
- − Management
- −$864
- − Depreciation
- −$1,862
- Taxable income
- $2,511
- Est. tax owed @ 24.0%
- −$603
- After-tax cash flow
- $2,787/yr
For passive investors: Depreciation is non-cash, so a rental often shows a tax loss while cash-flowing — sheltering income. Rental losses are passive: they offset passive income freely, and up to $25,000/yr can offset ordinary (W-2) income if you actively participate and your MAGI is under $100k (phasing out to $0 by $150k); unused losses carry forward. On sale, claimed depreciation is recaptured at up to 25%, and gains may owe capital-gains tax (a 1031 exchange can defer both). Figures are a year-1 estimate at your 24.0% rate — not tax advice; consult a CPA.
Schools (NCES district)
- District
- Sonora ISD
- NCES district ID
- 4840800
- Math proficiency
- 52% ▼ -4.00%
- Reading proficiency
- 46% ▼ -5.00%
- Median HH income
- $54,215
- Composite
- 42.39/100
- National rank
- #3239
- State rank
- #189 of 826 in TX
Livability — Sonora
- Score
- 77/100
- State rank
- #83
- US rank
- #2963
Category grades
Schools grade is shown separately in the Schools card above.
Census & demographics
- Census place
- Sonora, TX
- Population (ZIP)
- 3,490
Population outlook (Sutton County) Hauer SSP2
- Today (2025)
- 3,727 people
- By 2030
- 3,569 · -4.2%
- By 2040
- 3,220 · -13.6%
- By 2050
- 2,868 · -23.0%
- By 2075
- 2,070 · -44.5%
- By 2100
- 1,313 · -64.8%
Race, ethnicity, and origin ACS 2023
- Neighborhood character
- Majority Hispanic (62%)
- Race & ethnicity
- Hispanic / Latino 62% White 36% Two or more races 9%
- Hispanic origin (detail)
- Mexican 58% Cuban 3%
- Common ancestry
- Serbian 2% Lithuanian 2% Slovak 1%
- Foreign-born
- 11% · Canada
- Languages at home
- 52% English-only · Spanish 48%
Political lean MEDSL · Sutton
- 2024 margin
- Solid R (+67.1) · D 16.3% · R 83.4%
- 2008→2024 swing
- -15.9pp toward R · 2008: -51.2pp · 2024: -67.1pp
- All cycles
- 2024: R+67.1 2020: R+57.8 2016: R+53.9 2012: R+49.8 2008: R+51.2
Not yet ingested
- Civics
- —
Market trends
- HPI YoY
- ▲ 3.73%
- Current HPI
- 119.0271
- Rent YoY
- —
- Metro
- —
- State GDP YoY
- ▲ 3.95%
- F500 in state
- 110
Industry mix (Fortune 500 HQ in TX)
| Industry | F500 HQs | Revenue |
|---|---|---|
| Energy | 16 | $1,198B |
|
||
| Technology | 5 | $198B |
|
||
| Engineering / Construction | 4 | $72B |
|
||
| Energy Services | 3 | $60B |
|
||
| Utilities | 3 | $41B |
|
||
| Healthcare | 2 | $330B |
|
||
Price history
+6.8% since first listed6 events — show timeline
- 2026-04-21 Price Changed $64,000 SAAR TX
- 2026-03-11 Listed $63,500 SAAR TX
- 2025-09-30 Relisted — SAAR TX
- 2025-09-30 Price Changed $61,100 SAAR TX
- 2025-02-07 Listed $59,900 SAAR TX
- 2019-07-09 Sold (Public Records) — Public Records
Property tax history
-1.4%/yrLatest (2025): $795 · -50.0% YoY. Source: county tax records.
Cash-flow waterfall
monthlySold comps — $/sqft
last 12 mo · ≤1 miLoading sold comps…