295 Weddle St · Hillsville, VA
Flood risk 9/10 · Severe
- FEMA flood zone
- X (unshaded)
- Chance of flooding over 30 yrs
- 0.99%
- Est. flood insurance / yr
- $507 – $1,088
Fire risk 4/10 · Minor
- Est. fire insurance / yr
- $666 – $1,236
Heat risk 3/10 · Minor
- Hot days now (above 92°F)
- 7 days/yr
- Hot days in 30 yrs
- 20 days/yr
Wind risk 2/10 · Minimal
- Chance of severe wind over 30 yrs
- 1.0%
Air-quality risk 1/10 · Minimal
- Unhealthy air days now
- 0 days/yr
- Unhealthy air days in 30 yrs
- 0 days/yr
Risk factors via First Street. Map © Google.
Why this score? — see what drove the B grade
The composite is a weighted blend of 9 inputs, each scored 0–100. Each bar is that input's sub-score; the figure is the points it added to the 100-point composite (weight × sub-score).
- Cash flow +30.0/30.0
- DSCR +10.0/10.0
- 1% rule +8.9/10.0
- ARV discount +7.5/15.0
- Schools +5.4/10.0
- Livability +3.2/5.0
- Rent growth +2.5/5.0
- Condition / age +2.5/5.0
- Appreciation +0.0/10.0
$73,500
🖨 Deal sheet 📄 Offer letter ✓ Due diligence
Listing remarks
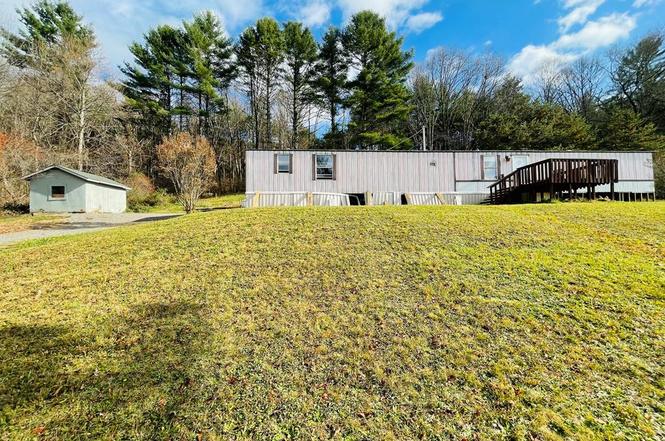
Affordable opportunity with strong upside potential! This 1998 singlewide mobile home (14' x 75', approx. 1,050 sq. ft. ) is situated on a full acre in a peaceful cul-de-sac just minutes (approx. 2.5 miles) from the town of Hillsville, VA. Located in a quiet, well-maintained neighborhood, this property offers both privacy and convenience. The interior is clean and in excellent move-in condition, featuring recent updates including new flooring, fresh paint, updated lighting, and several new plumbing fixtures. A few finishing touches remain, including installation of a water heater and minor trim work to complete the interior. Exterior repairs are needed, including plumbing and underpinning,
Key facts
- 1.06 acre lot
- Built 1998
- Listed 561 days
Property features AI
Exterior
- Utilities: Public water; Septic tank sewer
- Home design: Single-story manufactured home; Residential property
- Construction: Aluminum siding
- Exterior features: Level lot; Shed on property
Interior
- Flooring: Laminate; Vinyl
- Bathrooms: 2 full bathrooms
- Heating & cooling: Electric heating
- Interior features: Laminate and vinyl flooring; Crawl space basement
Neighborhood map
What this means for you Summary
Snapshot
- This is a 3-bed/2.0-bath single-family listed at $74k.
Deal economics
- At list price, monthly cash flow is $235 ($3k/yr) — positive.
- The deal already cash-flows at list — no discount required.
- Meets the 1% rule at list price ($1k rent vs $74k).
- Recommended offer: $65k (12.0% below list) — sets the bar for market timing.
- Cap rate 11.2% vs local median 2.6% in Hillsville — top-decile yield for the area; either an underpriced asset or a hidden risk that comps aren't pricing in. Stress-test before assuming the spread holds.
Location & tenants
- Location reads 65/100 on livability (#339 in VA) — a middle-class / working-renter tenant base. Strengths: cost of living A+, crime A, housing B+; Watch: amenities F, commute F, employment F.
- Carroll County Public School District (rural): math 60% / reading 70% proficiency, ranked #46 of 131 in VA (top 35%) — acceptable for families but not a draw, mixed tenant base, ~2y average lease.
- Zoned schools: Fancy Gap Elementary (math 92% / reading 87%, grade A+, #19 of 1,108 statewide, top 2%, 127 students, 85% FRL); Carroll County Middle (math 54% / reading 72%, grade B+, #134 of 342 statewide, top 40%, 756 students, 84% FRL); Carroll County High (math 64% / reading 67%, grade B, #204 of 319 statewide, top 65%, 1,069 students, 81% FRL) — zoned schools average 83% FRL vs 48% district-wide (35 pts higher); higher-poverty schools than district average — tighter screening recommended.
- Market conditions: 124 active listings in the ZIP; 80 units permitted in Carroll County in 2024 (0 in 5+ unit buildings).
Forward outlook
- Local home prices are declining (-3.0%/yr); year-one equity from $508 of loan paydown is wiped out by about $2k of value loss. Plan a longer hold.
- Carroll County population projected at -18% by 2050 — secular population decline; favor cash flow + early exit over multi-decade hold.
- At projected returns (-3.0% appreciation + 3.0% rent growth), your $21k cash investment doubles in ~9 years — after that, you're playing with house money.
Negotiation context
- It's been on market 561 days — a 12% lower offer ($65k) is reasonable based on typical stale-listing flexibility.
- 4 sale attempts since 2y ago; this cycle's ask has dropped $23k (24%) from the opening price — seller is motivated, your offer sets the floor, not the list.
Risks & watch-outs
- Watch-outs: flood insurance adds $66/mo.
- Climate carrying-cost: severe flood risk — expect insurance premiums to compound above CPI over the hold.
Questions for the listing agent
- It's been on market 561 days. Have you received any prior offers? Is the seller open to a 12% concession, seller financing, or rate buy-down credit?
- What's the actual annual flood-insurance premium (NFIP or private), and is the property in a SFHA with mandatory coverage?
- Why hasn't it sold? Are there any deal-killer items the seller is aware of (foundation, flood, title, zoning, code violations)?
- Is there a deadline driving the sale (1031 exchange, divorce, estate, relocation)? That informs how much negotiation room exists.
- Schools are A-rated — typically a magnet for longer-tenancy family renters. What's the average tenant stay here, and is there a school-zone premium baked into asking?
- What's the average days-on-market for RENTAL listings here right now (not sales)? A rising rental-DOM trend means longer vacancies and softer asking-rent achievability than the comps imply.
- What's the recent tenant-quality profile in this submarket — average credit score on applications, eviction rate, late-payment / NSF rate, and stable-employment percentage? A property-management company in the area should have these aggregated.
- How much new for-sale + rental construction is in the pipeline within 1–3 miles? Heavy new supply typically softens prices + rents 12–24 months out; constrained supply supports both.
Investment metrics
- 1% rule
- 1.39% ✓
- Cap rate
- 11.21%
- Cash-on-cash
- 17.58%
- DSCR
- 1.78
- GRM
- 6.0
CMA / ARV
- ARV (on-the-fly)
- $175,350
- Comps found
- 4
Show comp detail 4 sales within ~0.75 mi
| Address | Dist | Beds/Ba | Sqft | Sold | Price | $/sf | Match |
|---|---|---|---|---|---|---|---|
| 156 Weddle St | 0.20mi | 2/2.0 (-1) | 1,056 (+1%) | 11mo | $95,000 | $90 | 76 |
| 222 Highland Park Dr | 0.58mi | 3/1.0 | 1,000 (-5%) | 21mo | $145,000 | $145 | 44 |
| 1436 Howlett St | 0.35mi | 2/1.5 (-1) | 944 (-10%) | 20mo | $157,400 | $167 | 43 |
| 204 Highland Park Dr | 0.57mi | 3/1.0 | 1,000 (-5%) | 24mo | $175,000 | $175 | 42 |
Match score weights: distance 35% · size 25% · config 20% · recency 20%. Top-matched comps best support the ARV.
Projected returns pro-forma
-3.0% appreciation · 3.0% rent growth · sell at horizon
- IRR
- 3.9%
- Equity multiple
- 1.15×
- Total profit
- $3,114
- Equity at exit
- $10,959
- IRR
- 13.5%
- Equity multiple
- 2.08×
- Total profit
- $22,213
- Equity at exit
- $6,355
Cash invested: $20,580 (down + closing). Projections, not guarantees.
Landlord ↔ Tenant lean methodology
- Overall (STATE)
- 55 Moderately Landlord-Leaning
- State Virginia
- 55 Moderately Landlord-Leaning · D+2
- County
- — inherits STATE
- City
- — inherits STATE
ZIP-level market 24343
- Home prices YoY
- -19.2%
- Active inventory
- 124
- Price-to-rent
- 6.0×
Monthly cashflow live
- Estimated rent
- $1,025 medium interval (Pro) →
- Mortgage (P&I)
- −$385
- Tax est. 1.5%
- −$92 /mo · $1,102/yr
- Insurance
- −$31
- Flood insurance flood zone
- −$66 /mo · $798/yr
- HOA
- −$0
- Vacancy / Maint / Mgmt
- −$215
- Net cashflow
- $235
Break-even live
UW: 25.0% down · 7.5% · 30yr · 1.5% tax · 5.0% vac · 8.0% maint · 8.0% mgmt
Financing live
Cash to close
- Down payment
- $18,375
- Closing costs
- $2,205
- Reserves months
- —
- Total cash needed
- —
Loan-product check · same deal, 3 products live
Conventional
25% down · 7.5% · 30yr
- Down + closing
- —
- Monthly P&I
- —
- Monthly cashflow
- —
- DSCR
- —
- Eligible?
- —
Personal DTI + credit; lowest rate.
DSCR
20% down · 8.5% · 30yr
- Down + closing
- —
- Monthly P&I
- —
- Monthly cashflow
- —
- DSCR
- —
- Eligible?
- —
No personal income docs; deal must DSCR.
Hard money
10% down · 12.0% · 12mo
- Down + closing
- —
- Monthly P&I
- —
- Monthly cashflow
- —
- DSCR
- —
- Eligible?
- —
Short-term bridge; refi at stabilization.
Listing history 13 events
-
2026-05-23status Pending
-
2026-04-16status Active
-
2026-03-31price $73,500
-
2025-12-27price $75,900
-
2025-11-14historical Active Under Contract
-
2025-08-29price $78,500
-
2025-07-09status Active
-
2025-07-08historical
-
2025-05-08status Active
-
2025-05-08historical
-
2025-03-05price $82,500
-
2024-12-16price $89,000
-
2024-11-07$96,500 Active
ⓘ Source: listings_history table (triggers on properties + properties_extension) + one-shot
backfill from property_details.listing_events for pre-trigger history.
Climate risk First Street
- Flood 9/10 Extreme FEMA zone X (unshaded) · 99% chance over 30 yrs
- Wildfire 4/10 Moderate
- Heat 3/10 Moderate 7 d/yr ≥92°F today · 20 d/yr by 30 yrs out
- Wind 2/10 Low 100% chance of damaging wind over 30 yrs
- Air quality 1/10 Low 0 unhealthy d/yr today · 0 by 30 yrs out
Nearby sold comps map
Loading sold comps map…
Walkable amenities ~0.75 mi
Loading nearby amenities…
Taxation est. · year 1
- Rental income
- $12,295
- − Mortgage interest
- −$4,117
- − Property taxes
- −$1,102
- − Insurance
- −$1,165
- − Repairs & maintenance
- −$984
- − Management
- −$984
- − Depreciation
- −$2,138
- Taxable income
- $1,805
- Est. tax owed @ 24.0%
- −$433
- After-tax cash flow
- $2,387/yr
For passive investors: Depreciation is non-cash, so a rental often shows a tax loss while cash-flowing — sheltering income. Rental losses are passive: they offset passive income freely, and up to $25,000/yr can offset ordinary (W-2) income if you actively participate and your MAGI is under $100k (phasing out to $0 by $150k); unused losses carry forward. On sale, claimed depreciation is recaptured at up to 25%, and gains may owe capital-gains tax (a 1031 exchange can defer both). Figures are a year-1 estimate at your 24.0% rate — not tax advice; consult a CPA.
Schools (NCES district)
- District
- Carroll County Public School District
- NCES district ID
- 5100690
- Math proficiency
- 60% ▼ -25.00%
- Reading proficiency
- 70% ▼ -10.00%
- Median HH income
- $36,359
- Composite
- 53.88/100
- National rank
- #1406
- State rank
- #46 of 131 in VA
Livability — Hillsville
- Score
- 65/100
- State rank
- #339
- US rank
- #13358
Category grades
Schools grade is shown separately in the Schools card above.
Census & demographics
- Census place
- Hillsville, VA
- City population
- 8,942
- Population (ZIP)
- 8,942
Population outlook (Carroll County) Hauer SSP2
- Today (2025)
- 28,768 people
- By 2030
- 27,909 · -3.0%
- By 2040
- 25,788 · -10.4%
- By 2050
- 23,522 · -18.2%
- By 2075
- 19,045 · -33.8%
- By 2100
- 14,801 · -48.6%
Race, ethnicity, and origin ACS 2023
- Neighborhood character
- Predominantly White (95%)
- Race & ethnicity
- White 95% Hispanic / Latino 2% Two or more races 2%
- Common ancestry
- Slovak 2% Serbian 2% Italian 1%
- Foreign-born
- 1% · Canada
- Languages at home
- 98% English-only · Spanish 1%
Political lean MEDSL · Carroll
- 2024 margin
- Solid R (+63.3) · D 18.1% · R 81.4%
- 2008→2024 swing
- -30.9pp toward R · 2008: -32.4pp · 2024: -63.3pp
- All cycles
- 2024: R+63.3 2020: R+62.7 2016: R+59.6 2012: R+39.4 2008: R+32.4
Not yet ingested
- Civics
- —
Market trends
- HPI YoY
- ▼ -38.28%
- Current HPI
- 161.0491
- Rent YoY
- —
- Metro
- —
- State GDP YoY
- ▲ 2.40%
- F500 in state
- 50
Industry mix (Fortune 500 HQ in VA)
| Industry | F500 HQs | Revenue |
|---|---|---|
| Aerospace / Defense | 4 | $236B |
|
||
| Technology / Defense | 3 | $32B |
|
||
| Financial Services | 2 | $176B |
|
||
| Utilities | 2 | $27B |
|
||
| Insurance | 2 | $25B |
|
||
| Technology | 2 | $15B |
|
||
Price history
-23.8% since first listed13 events — show timeline
- 2026-05-23 Pending — SWVAR
- 2026-04-16 Relisted — SWVAR
- 2026-03-31 Price Changed $73,500 SWVAR
- 2025-12-27 Price Changed $75,900 SWVAR
- 2025-11-14 Contingent — SWVAR
- 2025-08-29 Price Changed $78,500 SWVAR
- 2025-07-09 Relisted — SWVAR
- 2025-07-08 Delisted — SWVAR
- 2025-05-08 Relisted — SWVAR
- 2025-05-08 Delisted — SWVAR
- 2025-03-05 Price Changed $82,500 SWVAR
- 2024-12-16 Price Changed $89,000 SWVAR
- 2024-11-07 Listed $96,500 SWVAR
Property tax history
-4.8%/yrLatest (2025): $110 · +13.3% YoY. Source: county tax records.
Cash-flow waterfall
monthlySold comps — $/sqft
last 12 mo · ≤1 miLoading sold comps…