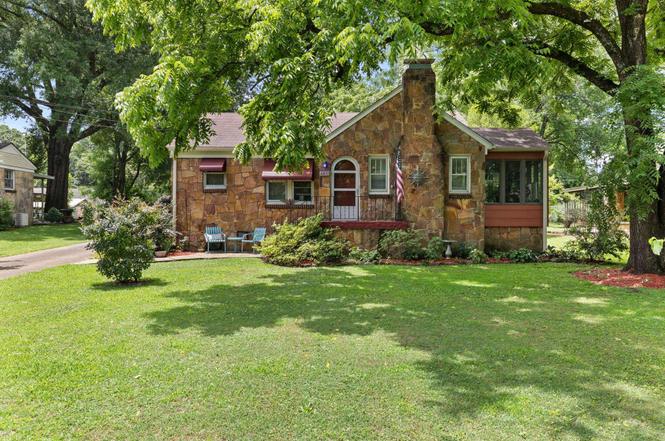
1911 N Wood Ave · Florence, AL
Flood risk 1/10 · Minimal
- FEMA flood zone
- X (unshaded)
- Chance of flooding over 30 yrs
- 0.0%
- Est. flood insurance / yr
- $507 – $1,088
Fire risk 3/10 · Minor
- Est. fire insurance / yr
- $916 – $1,700
Heat risk 6/10 · Moderate
- Hot days now (above 107°F)
- 7 days/yr
- Hot days in 30 yrs
- 20 days/yr
Wind risk 4/10 · Minor
- Chance of severe wind over 30 yrs
- 22.0%
Air-quality risk 2/10 · Minimal
- Unhealthy air days now
- 0 days/yr
- Unhealthy air days in 30 yrs
- 1 days/yr
Risk factors via First Street. Map © Google.
Why this score? — see what drove the F grade
The composite is a weighted blend of 9 inputs, each scored 0–100. Each bar is that input's sub-score; the figure is the points it added to the 100-point composite (weight × sub-score).
- Cash flow +13.7/30.0
- DSCR +4.1/10.0
- Livability +4.1/5.0
- Rent growth +4.0/5.0
- Schools +3.0/10.0
- 1% rule +2.6/10.0
- Condition / age +2.5/5.0
- ARV discount +0.0/15.0
- Appreciation +0.0/10.0
$174,900
🖨 Deal sheet 📄 Offer letter ✓ Due diligence
Listing remarks
Neat and charming cottage on North Wood! This 3 bedroom, 2 bath home is perched on a beautiful lot, just north of downtown Florence area, and features a fenced backyard, mature trees and landscaping, nice fire-pit area, detached garage, and plenty of outdoor space to enjoy. Conveniently located near downtown, this home offers comfort and has lots of character!
Key facts
- Fire-pit area
- Outdoor space
- Fenced backyard
Tags
Property features AI
Exterior
- Parking: Detached or attached garage with 1 garage space
- Utilities: Public sewer
- Home design: Single-family residential property; Located in the University Heights subdivision; Zoned R1
- Construction: Stone construction; Shingle roof; Has basement
- Exterior features: Privacy fencing in back yard; Shed
Interior
- Kitchen: Electric range
- Bedrooms: 3 bedrooms on the main level
- Flooring: Carpet; Hardwood; Tile
- Bathrooms: 2 full bathrooms
- Heating & cooling: Central heating (natural gas); Central air conditioning
- Interior features: Electric water heater; Partial unfinished basement; 9 total rooms
- Laundry & utility: Laundry in basement
Neighborhood map
What this means for you Summary
Snapshot
- This is a 3-bed/2.0-bath single-family listed at $175k.
Deal economics
- At list price, monthly cash flow is $12 ($148/yr) — positive.
- The deal already cash-flows at list — no discount required.
- To meet the 1% rule (rent ≥ 1% of price), the offer needs to be $133k (23.7% below list).
- Recommended offer: $133k (23.7% below list) — sets the bar for 1% rule.
- Cap rate 6.4% vs local median 3.6% in Florence — top-decile yield for the area; either an underpriced asset or a hidden risk that comps aren't pricing in. Stress-test before assuming the spread holds.
Location & tenants
- Location reads 82/100 on livability (#4 in AL, #1,140 nationally) — a professional / high-income tenant draw. Strengths: amenities A+, commute A+, cost of living A+; Watch: crime F, employment F.
- Florence City (urban): math 28% / reading 44% proficiency, ranked #44 of 129 in AL (top 34%) — families likely to look elsewhere, expect single-tenant / working-renter base with shorter leases.
- Zoned schools: Florence Middle School (math 22% / reading 44%, grade F, #101 of 257 statewide, top 40%, 689 students, 51% FRL); Florence High School (math 28% / reading 34%, grade F, #66 of 305 statewide, top 21%, 1,034 students, 36% FRL).
- Market conditions: Rents rising fast (+6.2%/yr); 268 active listings in the ZIP; 7 comparable units currently listed for rent nearby; rentals lingering (median 44d on market — plan ~5-8 weeks vacancy on turnover, expect pricing pressure); 100% of comp listings sitting > 30 days — soft ceiling on asking rent; 164 units permitted in Lauderdale County in 2024 (72 in 5+ unit buildings).
- This rent runs 35% of the median local income ($46k/yr) — at the standard rent-burdened threshold; future hikes will face affordability resistance.
Forward outlook
- Local home prices are declining (-3.0%/yr); year-one equity from $1k of loan paydown is wiped out by about $5k of value loss. Plan a longer hold.
Negotiation context
- Only 2 days on market — expect competitive offers; lowballing is unlikely to land.
- 5 sale attempts since 18y ago with the ask held roughly flat each time — persistent listings suggest the price (not the market) is what's stuck; bring a comps-based counter.
- Current owner paid $136k; 29% above their basis — modest negotiation headroom, anchor on the comps not their cost.
Risks & watch-outs
- Watch-outs: built in 1948 — expect roof / HVAC / electrical / plumbing capex.
- Climate carrying-cost: extreme-heat days projected 7→20/yr by 2055 (HVAC capex compounding) — expect insurance premiums to compound above CPI over the hold.
Questions for the listing agent
- Built in 1948 — when were the roof, HVAC, electrical panel, plumbing, and water heater last replaced?
- Is there a deadline driving the sale (1031 exchange, divorce, estate, relocation)? That informs how much negotiation room exists.
- Crime grade is F in this area — have there been break-ins, vandalism, or insurance claims at this property in the last 3 years? What carrier currently insures it and at what premium?
- The area grade is low — what's the realistic commute time and amenity access for the typical tenant pool here? Any planned neighborhood developments (good or bad) we should know about?
- What's the average days-on-market for RENTAL listings here right now (not sales)? A rising rental-DOM trend means longer vacancies and softer asking-rent achievability than the comps imply.
- What's the recent tenant-quality profile in this submarket — average credit score on applications, eviction rate, late-payment / NSF rate, and stable-employment percentage? A property-management company in the area should have these aggregated.
- How much new for-sale + rental construction is in the pipeline within 1–3 miles? Heavy new supply typically softens prices + rents 12–24 months out; constrained supply supports both.
Investment metrics
- 1% rule
- 0.76% ✗
- Cap rate
- 6.38%
- Cash-on-cash
- 0.30%
- DSCR
- 1.01
- GRM
- 10.9
CMA / ARV
- ARV (on-the-fly)
- $148,512
- Comps found
- 12
Show comp detail 12 sales within ~0.75 mi
| Address | Dist | Beds/Ba | Sqft | Sold | Price | $/sf | Match |
|---|---|---|---|---|---|---|---|
| 2118 Mcburney Dr | 0.21mi | 3/1.0 | 1,289 (+3%) | 3mo | $177,000 | $137 | 78 |
| 145 E Duncan Ave | 0.20mi | 3/1.0 | 1,211 (-3%) | 4mo | $129,000 | $107 | 78 |
| 125 Foy Ave | 0.34mi | 3/1.0 | 1,248 (0%) | 8mo | $185,000 | $148 | 74 |
| 142 Hampton Ave | 0.26mi | 2/1.0 (-1) | 1,274 (+2%) | 6mo | $145,000 | $114 | 70 |
| 1838 Shade Ave | 0.31mi | 2/1.0 (-1) | 1,272 (+2%) | 6mo | $127,450 | $100 | 68 |
| 124 Foy Ave | 0.36mi | 2/1.0 (-1) | 1,288 (+3%) | 4mo | $115,000 | $89 | 66 |
| 1616 Chisholm Rd | 0.53mi | 2/1.0 (-1) | 1,240 (-1%) | 1mo | $210,000 | $169 | 64 |
| 514 Collier Ave | 0.60mi | 3/1.0 | 1,248 (0%) | 8mo | $178,000 | $143 | 62 |
| 2314 Norwood Blvd | 0.55mi | 3/1.5 | 1,371 (+10%) | 0mo | $95,000 | $69 | 56 |
| 216 Foy Ave | 0.42mi | 2/1.0 (-1) | 1,110 (-11%) | 1mo | $130,000 | $117 | 52 |
| 526 Florida Ave | 0.70mi | 3/1.0 | 1,126 (-10%) | 6mo | $134,500 | $119 | 42 |
| 505 Florida Ave | 0.67mi | 2/1.0 (-1) | 1,113 (-11%) | 3mo | $160,000 | $144 | 39 |
Match score weights: distance 35% · size 25% · config 20% · recency 20%. Top-matched comps best support the ARV.
Projected returns pro-forma
-3.0% appreciation · 6.18% rent growth · sell at horizon
- IRR
- -12.8%
- Equity multiple
- 0.53×
- Total profit
- $-23,232
- Equity at exit
- $26,078
- IRR
- -0.1%
- Equity multiple
- 0.99×
- Total profit
- $-251
- Equity at exit
- $15,122
Cash invested: $48,972 (down + closing). Projections, not guarantees.
Landlord ↔ Tenant lean methodology
- Overall (STATE)
- 90 Strongly Landlord-Friendly
- State Alabama
- 90 Strongly Landlord-Friendly · R+15
- County
- — inherits STATE
- City
- — inherits STATE
ZIP-level market 35630
- Home prices YoY
- -33.7%
- Rents YoY
- 6.2%
- Active inventory
- 268
- Price-to-rent
- 10.9×
Monthly cashflow live
- Estimated rent
- $1,335 high interval (Pro) →
- Mortgage (P&I)
- −$917
- Tax from tax record
- −$52 /mo · $623/yr
- Insurance
- −$73
- HOA
- −$0
- Vacancy / Maint / Mgmt
- −$280
- Net cashflow
- $12
Break-even live
UW: 25.0% down · 7.5% · 30yr · 1.5% tax · 5.0% vac · 8.0% maint · 8.0% mgmt
Financing live
Cash to close
- Down payment
- $43,725
- Closing costs
- $5,247
- Reserves months
- —
- Total cash needed
- —
Loan-product check · same deal, 3 products live
Conventional
25% down · 7.5% · 30yr
- Down + closing
- —
- Monthly P&I
- —
- Monthly cashflow
- —
- DSCR
- —
- Eligible?
- —
Personal DTI + credit; lowest rate.
DSCR
20% down · 8.5% · 30yr
- Down + closing
- —
- Monthly P&I
- —
- Monthly cashflow
- —
- DSCR
- —
- Eligible?
- —
No personal income docs; deal must DSCR.
Hard money
10% down · 12.0% · 12mo
- Down + closing
- —
- Monthly P&I
- —
- Monthly cashflow
- —
- DSCR
- —
- Eligible?
- —
Short-term bridge; refi at stabilization.
Rent comps 7 comps
| Address | Beds | Baths | Sqft | Rent | $/sqft | DOM | Units | Dist |
|---|---|---|---|---|---|---|---|---|
| 1413 N Pine St Florence, AL | 4.0 | 2.0 | 1444 | $1,695 | $1.17 | 43d | 1 | 0.48mi |
| 2424 Roberts Ln Florence, AL | 2.0 | 2.0 | 1100 | $1,095 | $1.00 | 43d | 1 | 0.73mi |
| 1034 N Royal Ave Unit 2 Florence, AL | 2.0 | 1.0 | 900 | $850 | $0.94 | 43d | 1 | 0.86mi |
| 1252 Hermitage Dr Florence, AL | 2.0 | 2.0 | 1250 | $1,170 | $0.94 | 43d | 1 | 1.00mi |
| 939 N Royal Ave Florence, AL | 2.0 | 1.0 | 900 | $850 | $0.94 | 43d | 1 | 1.04mi |
| 530 N Royal Ave Florence, AL | 2.0 | 1.0 | 1200 | $1,100 | $0.92 | 44d | 1 | 1.31mi |
| Cypress Dr Florence, AL | 2.0 | 1.0 | 782 | $695 | $0.89 | 43d | 1 | 1.36mi |
Listing history 3 events
-
2026-06-19days on market $174,900 Active 2 DOM
-
2026-06-17remarks 362-char remark
-
2026-06-17$174,900 Active 1 DOM
ⓘ Source: listings_history table (triggers on properties + properties_extension) + one-shot
backfill from property_details.listing_events for pre-trigger history.
Tax reassessment forecast AL · Resets to sale price
- Current annual tax
- $623 · $52/mo
- Projected year-2 tax
- $717 · $60/mo
- Expected delta
- +$94/yr (+$8/mo · 15.0%)
ⓘ Screening estimate from a state-policy table — verify with the county assessor before closing.
Climate risk First Street
- Flood 1/10 Low FEMA zone X (unshaded) · 0% chance over 30 yrs
- Wildfire 3/10 Moderate
- Heat 6/10 Major 7 d/yr ≥107°F today · 20 d/yr by 30 yrs out
- Wind 4/10 Moderate 22% chance of damaging wind over 30 yrs
- Air quality 2/10 Low 0 unhealthy d/yr today · 1 by 30 yrs out
Nearby sold comps map
Loading sold comps map…
Walkable amenities ~0.75 mi
Loading nearby amenities…
Taxation est. · year 1
- Rental income
- $16,015
- − Mortgage interest
- −$9,797
- − Property taxes
- −$623
- − Insurance
- −$874
- − Repairs & maintenance
- −$1,281
- − Management
- −$1,281
- − Depreciation
- −$5,088
- Taxable loss
- −$2,930
- Est. tax savings @ 24.0%
- +$703
- After-tax cash flow
- $851/yr
For passive investors: Depreciation is non-cash, so a rental often shows a tax loss while cash-flowing — sheltering income. Rental losses are passive: they offset passive income freely, and up to $25,000/yr can offset ordinary (W-2) income if you actively participate and your MAGI is under $100k (phasing out to $0 by $150k); unused losses carry forward. On sale, claimed depreciation is recaptured at up to 25%, and gains may owe capital-gains tax (a 1031 exchange can defer both). Figures are a year-1 estimate at your 24.0% rate — not tax advice; consult a CPA.
Schools (NCES district)
- District
- Florence City
- NCES district ID
- 0101530
- Math proficiency
- 28% ▼ -28.00%
- Reading proficiency
- 44% ▼ -4.00%
- Median HH income
- $34,997
- Composite
- 29.69/100
- National rank
- #6456
- State rank
- #44 of 129 in AL
Livability — Florence
- Score
- 82/100
- State rank
- #4
- US rank
- #1140
Category grades
Schools grade is shown separately in the Schools card above.
Census & demographics
- Census place
- Florence, AL
- County
- Lauderdale County · 47,988 people
- City population
- 34,028
- Metro
- Florence-Muscle Shoals, AL
- Population (ZIP)
- 34,028
- Household income
- $46,304
- Rent vs Own
- Severe rent burden
- 1516.0
Population outlook (Lauderdale County) Hauer SSP2
- Today (2025)
- 93,386 people
- By 2030
- 93,634 · +0.3%
- By 2040
- 93,114 · -0.3%
- By 2050
- 91,586 · -1.9%
- By 2075
- 88,667 · -5.1%
- By 2100
- 81,098 · -13.2%
Race, ethnicity, and origin ACS 2023
- Neighborhood character
- Predominantly White (70%)
- Race & ethnicity
- White 70% Black 18% Two or more races 6% Hispanic / Latino 6%
- Hispanic origin (detail)
- Mexican 5%
- Common ancestry
- Slovak 3% Serbian 2% Romanian 1%
- Foreign-born
- 4% · Canada, Vietnam, Guatemala
- Languages at home
- 92% English-only · Spanish 6% Vietnamese 1%
Political lean MEDSL · Lauderdale
- 2024 margin
- Solid R (+51.5) · D 23.8% · R 75.3%
- 2008→2024 swing
- -23.3pp toward R · 2008: -28.2pp · 2024: -51.5pp
- All cycles
- 2024: R+51.5 2020: R+44.7 2016: R+46.0 2012: R+30.9 2008: R+28.2
Not yet ingested
- Civics
- —
Market trends
- HPI YoY
- ▼ -104.78%
- Current HPI
- 206.1364
- Rent YoY
- ▲ 6.18%
- Metro
- Florence-Muscle Shoals, AL
- State GDP YoY
- ▲ 2.94%
- F500 in state
- 4
Industry mix (Fortune 500 HQ in AL)
| Industry | F500 HQs | Revenue |
|---|---|---|
| Financial Services | 1 | $8B |
|
||
| Healthcare | 1 | $5B |
|
||
Price history
+106.0% since first listed8 events — show timeline
- 2026-06-17 Listed $174,900 SAARMLS
- 2021-10-26 Sold (Public Records) $135,900 Public Records
- 2021-10-26 Sold (MLS) $135,900 SAARMLS
- 2021-08-02 Listed $149,900 SAARMLS
- 2017-05-18 Sold (MLS) $80,000 SAARMLS
- 2016-11-21 Listed $84,900 SAARMLS
- 2009-02-27 Listed $84,900 SAARMLS
- 2008-08-15 Listed $84,900 SAARMLS
Property tax history
-0.9%/yrLatest (2025): $623 · +7.6% YoY. Source: county tax records.
Cash-flow waterfall
monthlySold comps — $/sqft
last 12 mo · ≤1 miLoading sold comps…