 Multi-family
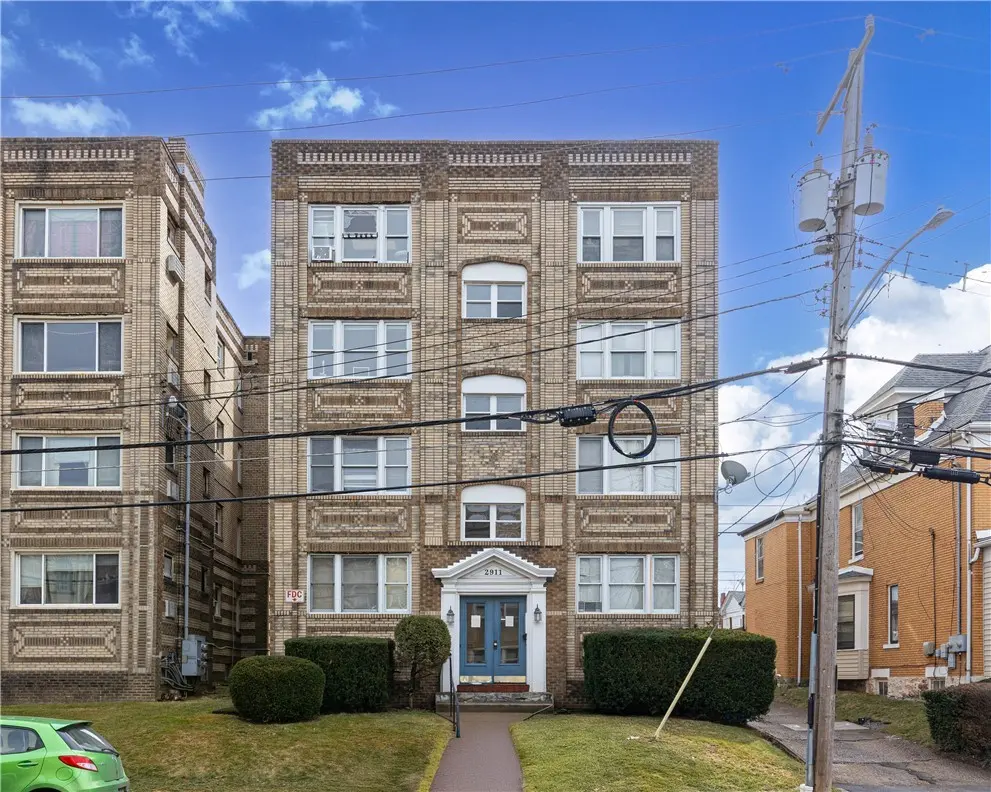
2911 Voelkel Ave · Dormont, PA
Flood risk 1/10 · Minimal
- FEMA flood zone
- X (unshaded)
- Chance of flooding over 30 yrs
- 0.0%
- Est. flood insurance / yr
- $507 – $1,088
Fire risk 1/10 · Minimal
- Est. fire insurance / yr
- $511 – $949
Heat risk 3/10 · Minor
- Hot days now (above 97°F)
- 7 days/yr
- Hot days in 30 yrs
- 16 days/yr
Wind risk 2/10 · Minimal
- Chance of severe wind over 30 yrs
- —
Air-quality risk 3/10 · Minor
- Unhealthy air days now
- 3 days/yr
- Unhealthy air days in 30 yrs
- 5 days/yr
Risk factors via First Street. Map © Google.
Why this score? — see what drove the C grade
The composite is a weighted blend of 9 inputs, each scored 0–100. Each bar is that input's sub-score; the figure is the points it added to the 100-point composite (weight × sub-score).
- Cash flow +21.9/30.0
- ARV discount +7.5/15.0
- DSCR +7.0/10.0
- 1% rule +5.3/10.0
- Livability +4.8/5.0
- Schools +4.7/10.0
- Rent growth +3.4/5.0
- Condition / age +2.5/5.0
- Appreciation +0.0/10.0
$850,000
🖨 Deal sheet 📄 Offer letter ✓ Due diligence
Multi-family units
County records classify this as Multi-Family (5+ Unit). Listing-text estimate: 1 unit. estimate disagrees with records
5+ unit building — per-unit beds/baths from public records are typically unavailable; the breakdown below (if shown) is an estimate from the listing text.
Listing remarks
2911 Voelkel Avenue offers investors the opportunity to acquire 8 one bedroom, one bath units in a great Pittsburgh neighborhood, Dormont. The property has been very well-maintained with 6 of the 8 units updated, a new hot water tank and zero deferred maintenance. 2911 Voelkel Avenue has a coin operated laundry in basement and each unit has a dishwasher. Perhaps the most convenient amenity of the property is that it is steps away from the T transit stop. The property is less than 5 miles from Downtown Pittsburgh. Dormont is a prime rental neighborhood due to its tree-lined streets, bustling business district and proximity to the city. Dormont has attracted younger professionals in recent ye
Key facts
- 3,179 sq ft lot
- Built 1920
- Listed 20 days
Neighborhood map
What this means for you Summary
Snapshot
- This is a 8-bed/?-bath multifamily listed at $850k.
Deal economics
- At list price, monthly cash flow is $1k ($16k/yr) — positive.
- The deal already cash-flows at list — no discount required.
- Meets the 1% rule at list price ($9k rent vs $850k).
- Recommended offer: $837k (1.5% below list) — sets the bar for market timing.
- Cap rate 8.2% vs local median 3.7% in Dormont — top-decile yield for the area; either an underpriced asset or a hidden risk that comps aren't pricing in. Stress-test before assuming the spread holds.
Location & tenants
- Location reads 95/100 on livability (#1 in PA, #1 nationally) — a professional / high-income tenant draw. Strengths: schools A+, crime A+, amenities A+.
- Keystone Oaks SD (suburban): math 45% / reading 65% proficiency, ranked #116 of 539 in PA (top 22%) — acceptable for families but not a draw, mixed tenant base, ~2y average lease.
- Market conditions: Rents rising (+3.6%/yr); 40 active listings in the ZIP; solid renter incomes; 2,996 units permitted in Allegheny County in 2024 (1,588 in 5+ unit buildings).
- At $8,758/mo this rent would consume 131% of the median local household income ($80k/yr) (locally 512% of renters already pay >50% of income on rent) — very limited rent-growth headroom before tenants either downsize or default.
Forward outlook
- Local home prices are declining (-3.0%/yr); year-one equity from $6k of loan paydown is wiped out by about $26k of value loss. Plan a longer hold.
Negotiation context
- It's been on market 20 days — a 2% lower offer ($837k) is reasonable based on typical stale-listing flexibility.
- Current owner paid $275k; list at $850k implies a 209% gain — meaningful room to come down on a strong offer.
Risks & watch-outs
- Watch-outs: built in 1920 — expect roof / HVAC / electrical / plumbing capex.
Questions for the listing agent
- Built in 1920 — when were the roof, HVAC, electrical panel, plumbing, and water heater last replaced?
- Is there a deadline driving the sale (1031 exchange, divorce, estate, relocation)? That informs how much negotiation room exists.
- Schools are A-rated — typically a magnet for longer-tenancy family renters. What's the average tenant stay here, and is there a school-zone premium baked into asking?
- What's the average days-on-market for RENTAL listings here right now (not sales)? A rising rental-DOM trend means longer vacancies and softer asking-rent achievability than the comps imply.
- What's the recent tenant-quality profile in this submarket — average credit score on applications, eviction rate, late-payment / NSF rate, and stable-employment percentage? A property-management company in the area should have these aggregated.
- How much new apartment / multifamily construction is in the pipeline within 1–3 miles? Heavy new supply (>2% of stock underway) typically softens rents 12–24 months out; light construction supports rent growth.
Investment metrics
- 1% rule
- 1.03% ✓
- Cap rate
- 8.19%
- Cash-on-cash
- 6.76%
- DSCR
- 1.30
- GRM
- 8.1
CMA / ARV
No comps found within radius.
Show comp detail 3 sales within ~0.75 mi
| Address | Dist | Beds/Ba | Sqft | Sold | Price | $/sf | Match |
|---|---|---|---|---|---|---|---|
| 2846-2848 Broadway Ave | 0.06mi | 7/5.0 (-1) | — | 18mo | $370,000 | — | 65 |
| 2237 Broadway Ave | 0.50mi | 8/4.0 | — | 12mo | $420,000 | — | 55 |
| 3230 Wainbell Ave | 0.58mi | 8/8.0 | — | 8mo | $590,000 | — | 54 |
Match score weights: distance 35% · size 25% · config 20% · recency 20%. Top-matched comps best support the ARV.
Projected returns pro-forma
-3.0% appreciation · 3.61% rent growth · sell at horizon
- IRR
- -5.3%
- Equity multiple
- 0.80×
- Total profit
- $-46,949
- Equity at exit
- $126,738
- IRR
- 5.1%
- Equity multiple
- 1.38×
- Total profit
- $91,387
- Equity at exit
- $73,492
Cash invested: $238,000 (down + closing). Projections, not guarantees.
Landlord ↔ Tenant lean methodology
- Overall (STATE)
- 62 Landlord-Friendly
- State Pennsylvania
- 62 Landlord-Friendly · EVEN
- County
- — inherits STATE
- City
- — inherits STATE
ZIP-level market 15216
- Rents YoY
- 3.6%
- Active inventory
- 40
- Price-to-rent
- 64.7×
Monthly cashflow live
- Estimated rent
- $8,758 high interval (Pro) →
- Mortgage (P&I)
- −$4,457
- Tax from tax record
- −$766 /mo · $9,190/yr
- Insurance
- −$354
- HOA
- −$0
- Vacancy / Maint / Mgmt
- −$1,839
- Net cashflow
- $1,341
Break-even live
8-unit breakdown (identical units grouped — click to expand)
| Units | Beds | Baths | Est. rent |
|---|---|---|---|
| 8× units | 1 | 1 | $8,760 |
| #1 | 1 | 1 | $1,095 |
| #2 | 1 | 1 | $1,095 |
| #3 | 1 | 1 | $1,095 |
| #4 | 1 | 1 | $1,095 |
| #5 | 1 | 1 | $1,095 |
| #6 | 1 | 1 | $1,095 |
| #7 | 1 | 1 | $1,095 |
| #8 | 1 | 1 | $1,095 |
| Total (8 units) | $8,758 | ||
UW: 25.0% down · 7.5% · 30yr · 1.5% tax · 5.0% vac · 8.0% maint · 8.0% mgmt
Financing live
Cash to close
- Down payment
- $212,500
- Closing costs
- $25,500
- Reserves months
- —
- Total cash needed
- —
Loan-product check · same deal, 3 products live
Conventional
25% down · 7.5% · 30yr
- Down + closing
- —
- Monthly P&I
- —
- Monthly cashflow
- —
- DSCR
- —
- Eligible?
- —
Personal DTI + credit; lowest rate.
DSCR
20% down · 8.5% · 30yr
- Down + closing
- —
- Monthly P&I
- —
- Monthly cashflow
- —
- DSCR
- —
- Eligible?
- —
No personal income docs; deal must DSCR.
Hard money
10% down · 12.0% · 12mo
- Down + closing
- —
- Monthly P&I
- —
- Monthly cashflow
- —
- DSCR
- —
- Eligible?
- —
Short-term bridge; refi at stabilization.
Listing history 5 events
-
2026-04-28status Pending
-
2026-04-08$850,000 Active
-
2016-02-10soldstatus $275,000
-
2008-06-06soldstatus $225,000
-
1992-08-03soldstatus $62,600
ⓘ Source: listings_history table (triggers on properties + properties_extension) + one-shot
backfill from property_details.listing_events for pre-trigger history.
Tax reassessment forecast PA · Partial reset (capped growth)
- Current annual tax
- $9,190 · $766/mo
- Projected year-2 tax
- $11,310 · $942/mo
- Expected delta
- +$2,120/yr (+$177/mo · 23.1%)
ⓘ Screening estimate from a state-policy table — verify with the county assessor before closing.
Climate risk First Street
- Flood 1/10 Low FEMA zone X (unshaded) · 0% chance over 30 yrs
- Wildfire 1/10 Low
- Heat 3/10 Moderate 7 d/yr ≥97°F today · 16 d/yr by 30 yrs out
- Wind 2/10 Low
- Air quality 3/10 Moderate 3 unhealthy d/yr today · 5 by 30 yrs out
Nearby sold comps map
Loading sold comps map…
Walkable amenities ~0.75 mi
Loading nearby amenities…
Taxation est. · year 1
- Rental income
- $105,096
- − Mortgage interest
- −$47,613
- − Property taxes
- −$9,190
- − Insurance
- −$4,250
- − Repairs & maintenance
- −$8,408
- − Management
- −$8,408
- − Depreciation
- −$24,727
- Taxable income
- $2,500
- Est. tax owed @ 24.0%
- −$600
- After-tax cash flow
- $15,496/yr
For passive investors: Depreciation is non-cash, so a rental often shows a tax loss while cash-flowing — sheltering income. Rental losses are passive: they offset passive income freely, and up to $25,000/yr can offset ordinary (W-2) income if you actively participate and your MAGI is under $100k (phasing out to $0 by $150k); unused losses carry forward. On sale, claimed depreciation is recaptured at up to 25%, and gains may owe capital-gains tax (a 1031 exchange can defer both). Figures are a year-1 estimate at your 24.0% rate — not tax advice; consult a CPA.
Schools (NCES district)
- District
- Keystone Oaks SD
- NCES district ID
- 4212750
- Math proficiency
- 45% ▼ -15.00%
- Reading proficiency
- 65% ▼ -8.00%
- Median HH income
- $54,066
- Composite
- 47.24/100
- National rank
- #2314
- State rank
- #116 of 539 in PA
Livability — Dormont
- Score
- 95/100
- State rank
- #1
- US rank
- #1
Category grades
Schools grade is shown separately in the Schools card above.
Census & demographics
- Census place
- Dormont, PA
- County
- Allegheny County · 1,022,028 people
- Metro
- Pittsburgh, PA
- Population (ZIP)
- 21,471
- Household income
- $80,313
- Rent vs Own
- Severe rent burden
- 512.0
Population outlook (Allegheny County) Hauer SSP2
- Today (2025)
- 1,250,282 people
- By 2030
- 1,256,482 · +0.5%
- By 2040
- 1,256,318 · +0.5%
- By 2050
- 1,244,169 · -0.5%
- By 2075
- 1,197,693 · -4.2%
- By 2100
- 1,093,187 · -12.6%
Race, ethnicity, and origin ACS 2023
- Neighborhood character
- Predominantly White (81%)
- Race & ethnicity
- White 81% Black 9% Two or more races 4% Hispanic / Latino 3% Asian 2%
- Common ancestry
- Romanian 8% Slovak 2% Serbian 2%
- Foreign-born
- 4% · Canada, China, Vietnam
- Languages at home
- 93% English-only · Spanish 3% Other Indo-European 1% Other Asian/Pacific 1%
Political lean MEDSL · Allegheny
- 2024 margin
- Strong D (+20.3) · D 59.7% · R 39.4%
- 2008→2024 swing
- +4.8pp toward D · 2008: 15.5pp · 2024: 20.3pp
- All cycles
- 2024: D+20.3 2020: D+20.4 2016: D+16.4 2012: D+14.4 2008: D+15.5
Not yet ingested
- Civics
- —
Market trends
- HPI YoY
- ▼ -154.58%
- Current HPI
- 272.8301
- Rent YoY
- ▲ 3.61%
- Metro
- Pittsburgh, PA
- State GDP YoY
- ▲ 1.68%
- F500 in state
- 34
Industry mix (Fortune 500 HQ in PA)
| Industry | F500 HQs | Revenue |
|---|---|---|
| Healthcare | 2 | $309B |
|
||
| Insurance | 2 | $27B |
|
||
| Telecommunications / Media | 1 | $124B |
|
||
| Industrial Distribution | 1 | $22B |
|
||
| Financial Services | 1 | $20B |
|
||
| Chemicals / Materials | 1 | $18B |
|
||
Price history
+1257.8% since first listed5 events — show timeline
- 2026-04-28 Pending — West Penn MLS
- 2026-04-08 Listed $850,000 West Penn MLS
- 2016-02-10 Sold (Public Records) $275,000 Public Records
- 2008-06-06 Sold (Public Records) $225,000 Public Records
- 1992-08-03 Sold (Public Records) $62,600 Public Records
Property tax history
+2.1%/yrLatest (2026): $9,190 · +6.1% YoY. Source: county tax records.
Cash-flow waterfall
monthlySold comps — $/sqft
last 12 mo · ≤1 miLoading sold comps…