None · Morrow, GA
Flood risk 1/10 · Minimal
- FEMA flood zone
- X (unshaded)
- Chance of flooding over 30 yrs
- 0.0%
- Est. flood insurance / yr
- $507 – $1,088
Fire risk 1/10 · Minimal
- Est. fire insurance / yr
- $963 – $1,789
Heat risk 6/10 · Moderate
- Hot days now (above 105°F)
- 7 days/yr
- Hot days in 30 yrs
- 18 days/yr
Wind risk 6/10 · Moderate
- Chance of severe wind over 30 yrs
- 27.0%
Air-quality risk 4/10 · Minor
- Unhealthy air days now
- 4 days/yr
- Unhealthy air days in 30 yrs
- 6 days/yr
Risk factors via First Street. Map © Google.
Why this score? — see what drove the C- grade
The composite is a weighted blend of 9 inputs, each scored 0–100. Each bar is that input's sub-score; the figure is the points it added to the 100-point composite (weight × sub-score).
- Cash flow +18.2/30.0
- ARV discount +15.0/15.0
- DSCR +5.7/10.0
- 1% rule +4.0/10.0
- Livability +3.2/5.0
- Condition / age +2.5/5.0
- Rent growth +2.2/5.0
- Schools +1.3/10.0
- Appreciation +0.0/10.0
$195,000
🖨 Deal sheet (PDF) 📄 Offer letter ✓ Due diligence
Listing remarks MLS
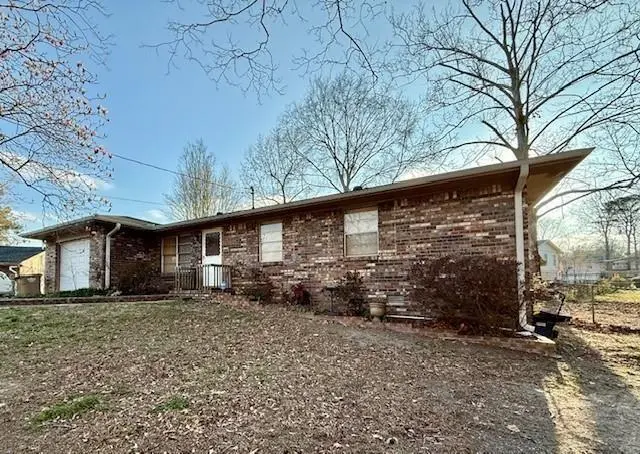
Great Opportunity for Investors or a Starter Home. Property has had some upgrades, new kitchen roofing and some flooring. Covered back porch/sunroom and fenced backyard with two storage buildings. Convenient Morrow location and easy access to I-75.
Key facts
- New kitchen
- Fenced backyard
- Covered back porch
Tags
Neighborhood map
What this means for you Summary
Snapshot
- This is a 3-bed/2.0-bath single-family listed at $195k.
Deal economics
- At list price, monthly cash flow is $175 ($2k/yr) — positive.
- The deal already cash-flows at list — no discount required.
- To meet the 1% rule (rent ≥ 1% of price), the offer needs to be $175k (10.1% below list).
- Recommended offer: $175k (10.1% below list) — sets the bar for 1% rule.
- Cap rate 7.4% vs local median 5.0% in Morrow — top-decile yield for the area; either an underpriced asset or a hidden risk that comps aren't pricing in. Stress-test before assuming the spread holds.
Location & tenants
- Location reads 65/100 on livability (#229 in GA) — a middle-class / working-renter tenant base. Strengths: cost of living A+, housing A+; Watch: amenities D, employment D, schools F.
- Clayton County (suburban): math 11% / reading 20% proficiency, ranked #155 of 174 in GA (top 89%) — low school quality limits family demand, transient renter base, plan for 1-2y turnover; 78% free/reduced lunch — lower-income household profile, screen leases tightly.
- Market conditions: Rents soft (-1.0%/yr); 166 active listings in the ZIP; 38 comparable units currently listed for rent nearby; rentals at typical pace (median 20d on market — plan ~3-4 weeks tenant-placement turnaround); 865 units permitted in Clayton County in 2024 (448 in 5+ unit buildings).
- This rent runs 40% of the median local income ($53k/yr) — at the standard rent-burdened threshold; future hikes will face affordability resistance.
Forward outlook
- Local home prices are declining (-3.0%/yr); year-one equity from $1k of loan paydown is wiped out by about $6k of value loss. Plan a longer hold.
- Clayton County population projected at +29% by 2050 — long-run rental-demand tailwind backs the buy-and-hold thesis.
Negotiation context
- It's been on market 76 days — a 6% lower offer ($183k) is reasonable based on typical stale-listing flexibility.
- 4 sale attempts since 4y ago; this cycle's ask has dropped $25k (11%) from the opening price — seller is motivated, your offer sets the floor, not the list.
- Current owner paid $60k; list at $195k implies a 228% gain — meaningful room to come down on a strong offer.
Risks & watch-outs
- Climate carrying-cost: major wind risk, 27% chance of damaging wind over 30y; extreme-heat days projected 7→18/yr by 2055 (HVAC capex compounding) — expect insurance premiums to compound above CPI over the hold.
Questions for the listing agent
- It's been on market 76 days. Have you received any prior offers? Is the seller open to a 10% concession, seller financing, or rate buy-down credit?
- Built in 1971 — when were the roof, HVAC, electrical panel, plumbing, and water heater last replaced?
- Why hasn't it sold? Are there any deal-killer items the seller is aware of (foundation, flood, title, zoning, code violations)?
- Is there a deadline driving the sale (1031 exchange, divorce, estate, relocation)? That informs how much negotiation room exists.
- Schools are F-rated, which usually means shorter tenancies and higher turnover. Who's the typical renter profile here, and what's been the actual vacancy rate?
- Crime grade is F in this area — have there been break-ins, vandalism, or insurance claims at this property in the last 3 years? What carrier currently insures it and at what premium?
- What's the average days-on-market for RENTAL listings here right now (not sales)? A rising rental-DOM trend means longer vacancies and softer asking-rent achievability than the comps imply.
- What's the recent tenant-quality profile in this submarket — average credit score on applications, eviction rate, late-payment / NSF rate, and stable-employment percentage? A property-management company in the area should have these aggregated.
- How much new for-sale + rental construction is in the pipeline within 1–3 miles? Heavy new supply typically softens prices + rents 12–24 months out; constrained supply supports both.
Investment metrics
- 1% rule
- 0.90% ✗
- Cap rate
- 7.37%
- Cash-on-cash
- 3.85%
- DSCR
- 1.17
- GRM
- 9.3
CMA / ARV
- ARV (median comp)
- $241,831
- List price
- $195,000
- Delta
- -19.37%
- Verdict
- UNDERPRICED
- Comps
- 20 within 1.0 mi
Show comp detail 12 sales within ~0.75 mi
| Address | Dist | Beds/Ba | Sqft | Sold | Price | $/sf | Match |
|---|---|---|---|---|---|---|---|
| 2379 Prestige Sq | 0.15mi | 3/2.0 | 1,209 (-5%) | 0mo | $232,000 | $192 | 84 |
| 6071 Deerfield Ct | 0.19mi | 3/2.0 | 1,368 (+7%) | 11mo | $265,000 | $194 | 70 |
| 6075 Tabor Ave | 0.50mi | 3/1.5 | 1,312 (+3%) | 3mo | $201,500 | $154 | 67 |
| 6155 Landover Cir | 0.27mi | 3/2.0 | 1,434 (+12%) | 4mo | $150,000 | $105 | 64 |
| 6200 Fieldcrest Dr | 0.39mi | 3/2.0 | 1,100 (-14%) | 2mo | $228,000 | $207 | 57 |
| 6413 Maddox Rd | 0.73mi | 3/2.0 | 1,267 (-1%) | 10mo | $164,400 | $130 | 56 |
| 2436 Rex Rd | 0.37mi | 3/2.0 | 1,440 (+13%) | 8mo | $240,000 | $167 | 55 |
| 2313 Poplar Ave | 0.72mi | 4/2.0 (+1) | 1,324 (+4%) | 1mo | $95,000 | $72 | 54 |
| 2609 Lake Harbin Rd | 0.70mi | 3/1.5 | 1,216 (-5%) | 9mo | $187,000 | $154 | 50 |
| 5712 Wesson Dr | 0.66mi | 3/2.0 | 1,408 (+10%) | 7mo | $244,900 | $174 | 46 |
| 5725 Twain Dr | 0.71mi | 3/2.0 | 1,447 (+13%) | 11mo | $215,000 | $149 | 35 |
| 2711 Teal Landing Dr | 0.70mi | 3/3.0 | 1,444 (+13%) | 11mo | $229,900 | $159 | 32 |
Match score weights: distance 35% · size 25% · config 20% · recency 20%. Top-matched comps best support the ARV.
Projected returns pro-forma
-3.0% appreciation · 0.0% rent growth · sell at horizon
- IRR
- -13.4%
- Equity multiple
- 0.53×
- Total profit
- $-25,629
- Equity at exit
- $29,075
- IRR
- -9.5%
- Equity multiple
- 0.49×
- Total profit
- $-28,034
- Equity at exit
- $16,860
Cash invested: $54,600 (down + closing). Projections, not guarantees.
Landlord ↔ Tenant lean methodology
- Overall (STATE)
- 90 Strongly Landlord-Friendly
- State Georgia
- 90 Strongly Landlord-Friendly · R+3
- County
- — inherits STATE
- City
- — inherits STATE
ZIP-level market 30260
- Home prices YoY
- -33.8%
- Rents YoY
- -1.0%
- Active inventory
- 166
- Price-to-rent
- 9.3×
Monthly cashflow live
- Estimated rent
- $1,753 high interval (Pro) →
- Mortgage (P&I)
- −$1,023
- Tax from tax record
- −$106 /mo · $1,272/yr
- Insurance
- −$81
- HOA
- −$0
- Vacancy / Maint / Mgmt
- −$368
- Net cashflow
- $175
Break-even live
Sensitivity live
| Price | -10% $286 | -5% $231 | +0% $175 | +5% $120 | +10% $65 |
|---|---|---|---|---|---|
| Rent | -10% $37 | -5% $106 | +0% $175 | +5% $245 | +10% $314 |
| Rate | -1.0pp $274 | -0.5pp $225 | base $175 | +0.5pp $125 | +1.0pp $73 |
UW: 25.0% down · 7.5% · 30yr · 1.5% tax · 5.0% vac · 8.0% maint · 8.0% mgmt
Financing live
Cash to close
- Down payment
- $48,750
- Closing costs
- $5,850
- Reserves months
- —
- Total cash needed
- —
Loan-product check · same deal, 3 products live
Conventional
25% down · 7.5% · 30yr
- Down + closing
- —
- Monthly P&I
- —
- Monthly cashflow
- —
- DSCR
- —
- Eligible?
- —
Personal DTI + credit; lowest rate.
DSCR
20% down · 8.5% · 30yr
- Down + closing
- —
- Monthly P&I
- —
- Monthly cashflow
- —
- DSCR
- —
- Eligible?
- —
No personal income docs; deal must DSCR.
Hard money
10% down · 12.0% · 12mo
- Down + closing
- —
- Monthly P&I
- —
- Monthly cashflow
- —
- DSCR
- —
- Eligible?
- —
Short-term bridge; refi at stabilization.
Rent comps 38 comps
| Address | Beds | Baths | Sqft | Rent | $/sqft | DOM | Units | Dist |
|---|---|---|---|---|---|---|---|---|
| 6010 Fairfield Dr Morrow, GA | 3.0 | 1.5 | 1246 | $1,841 | $1.48 | 3d | 1 | 0.07mi |
| 2445 Rex Rd Ellenwood, GA | 1.0–3.0 | 1.0–2.0 | 1149 | $1,569 | $1.37 | 2d | 12 | 0.22mi |
| 5958 Sherwood Pl Ellenwood, GA | 2.0 | 2.5 | 1468 | $995 | $0.68 | 25d | 1 | 0.23mi |
| 5958 Sherwood Pl Unit 5958 Ellenwood, GA | 2.0 | 2.5 | 1468 | $995 | $0.68 | 44d | 1 | 0.23mi |
| 6068 Monica Dr Morrow, GA | 3.0 | 2.0 | 1210 | $1,700 | $1.40 | 22d | 1 | 0.32mi |
| 5868 Dan Dr Ellenwood, GA | 3.0 | 2.0 | 1854 | $2,300 | $1.24 | 44d | 1 | 0.45mi |
| 5731 Buck Ct Ellenwood, GA | 3.0 | 2.0 | 1242 | $1,525 | $1.23 | 13d | 1 | 0.59mi |
| 5720 Buck Ct Ellenwood, GA | 3.0 | 2.0 | 1232 | $1,850 | $1.50 | 25d | 1 | 0.61mi |
| 2260 Hammond Ct Ellenwood, GA | 3.0 | 2.0 | 1248 | $1,850 | $1.48 | 44d | 1 | 0.67mi |
| 2588 Monica Way Morrow, GA | 3.0 | 2.0 | 1706 | $1,650 | $0.97 | 3d | 1 | 0.68mi |
| 5704 Wesson Dr Ellenwood, GA | 3.0 | 2.0 | 1480 | $1,710 | $1.16 | 44d | 1 | 0.70mi |
| 5762 Northspring Dr Ellenwood, GA | 3.0 | 2.0 | 1577 | $1,705 | $1.08 | 13d | 1 | 0.73mi |
| 6437 Maddox Rd Morrow, GA | 3.0 | 2.0 | 1694 | $1,818 | $1.07 | 25d | 1 | 0.75mi |
| 2690 Lake Harbin Rd Morrow, GA | 3.0 | 1.0 | 980 | $1,683 | $1.72 | 5d | 1 | 0.76mi |
| 2401 Bethune Cir Morrow, GA | 3.0 | 2.5 | 1696 | $2,095 | $1.24 | 5d | 1 | 0.80mi |
| 6424 Monica Dr Morrow, GA | 3.0 | 2.0 | 1125 | $1,400 | $1.24 | 44d | 1 | 0.80mi |
| 2603 Old Rex Morrow Rd Ellenwood, GA | 4.0 | 3.0 | 1800 | $2,510 | $1.39 | 45d | 1 | 0.82mi |
| 2617 Old Rex Morrow Rd Ellenwood, GA | 4.0 | 3.0 | 1800 | $1,950 | $1.08 | 13d | 1 | 0.84mi |
| 6137 Harvard Ct Morrow, GA | 3.0 | 2.0 | 1320 | $1,556 | $1.18 | 22d | 1 | 0.86mi |
| 6234 Culver Dr Morrow, GA | 4.0 | 3.0 | 1748 | $2,350 | $1.34 | 5d | 1 | 0.92mi |
| 2128 Baden Ct #1 Morrow, GA | 3.0 | 1.5 | 1600 | $1,495 | $0.93 | 13d | 1 | 0.95mi |
| 6560 Maddox Rd Morrow, GA | 3.0 | 2.0 | 1350 | $1,781 | $1.32 | 13d | 1 | 0.98mi |
| 6572 Sleepy Hollow Ln Morrow, GA | 2.0 | 1.5 | 1152 | $1,400 | $1.22 | 25d | 1 | 1.01mi |
| 6593 Sleepy Hollow Ln Morrow, GA | 2.0 | 2.0 | 1152 | $1,550 | $1.35 | 44d | 1 | 1.02mi |
| 6595 Mount Zion Blvd Morrow, GA | 1.0–3.0 | 1.0–2.0 | 1175 | $1,749 | $1.49 | 5d | 12 | 1.04mi |
| 1932 Carla Dr Morrow, GA | 3.0 | 2.0 | 1324 | $1,730 | $1.31 | 2d | 1 | 1.05mi |
| 6596 Fleming Rd Morrow, GA | 4.0 | 2.5 | 1847 | $1,873 | $1.01 | 5d | 1 | 1.05mi |
| 6596 Fleming Rd Morrow, GA | 4.0 | 2.5 | 1847 | $1,873 | $1.01 | 21d | 1 | 1.05mi |
| 2958 Stone Creek Dr Rex, GA | 3.0 | 2.0 | 1506 | $1,800 | $1.20 | 13d | 1 | 1.10mi |
| 6511 Mill Ct Morrow, GA | 3.0 | 2.0 | 1454 | $1,881 | $1.29 | 44d | 1 | 1.11mi |
| 1885 Harper Dr Morrow, GA | 1.0–2.0 | 1.0 | 1025 | $1,415 | $1.38 | 3d | 6 | 1.13mi |
| 6655 Mount Zion Blvd Morrow, GA | 2.0–3.0 | 2.0 | 1102 | $1,499 | $1.36 | 13d | 7 | 1.16mi |
| 2941 Partin Pl Ellenwood, GA | 4.0 | 2.5 | 1874 | $2,155 | $1.15 | 15d | 1 | 1.18mi |
| 6498 Menlo Way Rex, GA | 4.0 | 2.0 | 1246 | $1,895 | $1.52 | 25d | 1 | 1.37mi |
| 6478 Bobolink Ct Rex, GA | 4.0 | 2.0 | 1626 | $1,911 | $1.18 | 20d | 1 | 1.41mi |
| 6494 Bobolink Ct Rex, GA | 3.0 | 2.0 | 1310 | $1,680 | $1.28 | 21d | 1 | 1.42mi |
| 6451 Carolyn Ct Rex, GA | 3.0 | 2.0 | 1523 | $1,665 | $1.09 | 44d | 1 | 1.46mi |
| 2271 Wentworth Park Dr Ellenwood, GA | 4.0 | 2.5 | 1705 | $2,119 | $1.24 | 17d | 1 | 1.47mi |
Listing history 12 events
-
2026-05-11status Under Contract 248-char remark
Show marketing remark (248 chars)
Great Opportunity for Investors or a Starter Home. Property has had some upgrades, new kitchen roofing and some flooring. Covered back porch/sunroom and fenced backyard with two storage buildings. Convenient Morrow location and easy access to I-75.
-
2026-05-11status Pending 248-char remark
Show marketing remark (248 chars)
Great Opportunity for Investors or a Starter Home. Property has had some upgrades, new kitchen roofing and some flooring. Covered back porch/sunroom and fenced backyard with two storage buildings. Convenient Morrow location and easy access to I-75.
-
2026-04-22price $195,000 248-char remark
Show marketing remark (248 chars)
Great Opportunity for Investors or a Starter Home. Property has had some upgrades, new kitchen roofing and some flooring. Covered back porch/sunroom and fenced backyard with two storage buildings. Convenient Morrow location and easy access to I-75.
-
2026-02-27$219,900 New 248-char remark
Show marketing remark (248 chars)
Great Opportunity for Investors or a Starter Home. Property has had some upgrades, new kitchen roofing and some flooring. Covered back porch/sunroom and fenced backyard with two storage buildings. Convenient Morrow location and easy access to I-75.
-
2026-02-27$219,900 Active 248-char remark
Show marketing remark (248 chars)
Great Opportunity for Investors or a Starter Home. Property has had some upgrades, new kitchen roofing and some flooring. Covered back porch/sunroom and fenced backyard with two storage buildings. Convenient Morrow location and easy access to I-75.
-
2023-01-10status Back On Market
-
2023-01-10historical
-
2022-11-07status Under Contract
-
2022-03-26$199,900 New
-
1997-09-10soldstatus $59,500
-
1982-12-31soldstatus $48,100
ⓘ Source: listings_history table (triggers on properties + properties_extension) + one-shot
backfill from property_details.listing_events for pre-trigger history.
Tax reassessment forecast GA · Resets to sale price
- Current annual tax
- $1,272 · $106/mo
- Projected year-2 tax
- $1,794 · $150/mo
- Expected delta
- +$522/yr (+$43/mo · 41.0%)
ⓘ Screening estimate from a state-policy table — verify with the county assessor before closing.
Climate risk First Street
- Flood 1/10 Low FEMA zone X (unshaded) · 0% chance over 30 yrs
- Wildfire 1/10 Low
- Heat 6/10 Major 7 d/yr ≥105°F today · 18 d/yr by 30 yrs out
- Wind 6/10 Major 27% chance of damaging wind over 30 yrs
- Air quality 4/10 Moderate 4 unhealthy d/yr today · 6 by 30 yrs out
Nearby sold comps map
Loading sold comps map…
Walkable amenities ~0.75 mi
Loading nearby amenities…
Taxation est. · year 1
- Rental income
- $21,041
- − Mortgage interest
- −$10,923
- − Property taxes
- −$1,272
- − Insurance
- −$975
- − Repairs & maintenance
- −$1,683
- − Management
- −$1,683
- − Depreciation
- −$5,673
- Taxable loss
- −$1,169
- Est. tax savings @ 24.0%
- +$280
- After-tax cash flow
- $2,384/yr
For passive investors: Depreciation is non-cash, so a rental often shows a tax loss while cash-flowing — sheltering income. Rental losses are passive: they offset passive income freely, and up to $25,000/yr can offset ordinary (W-2) income if you actively participate and your MAGI is under $100k (phasing out to $0 by $150k); unused losses carry forward. On sale, claimed depreciation is recaptured at up to 25%, and gains may owe capital-gains tax (a 1031 exchange can defer both). Figures are a year-1 estimate at your 24.0% rate — not tax advice; consult a CPA.
Schools (NCES district)
- District
- Clayton County
- NCES district ID
- 1301230
- Math proficiency
- 11% ▼ -13.00%
- Reading proficiency
- 20% ▼ -9.00%
- Median HH income
- $42,266
- Composite
- 13.41/100
- National rank
- #9527
- State rank
- #155 of 174 in GA
Livability — Morrow
- Score
- 65/100
- State rank
- #229
- US rank
- #13314
Category grades
Schools grade is shown separately in the Schools card above.
Census & demographics
- County
- Clayton County · 230,153 people
- City population
- 28,693
- Metro
- Atlanta-Sandy Springs-Alpharetta, GA
- Population (ZIP)
- 28,693
- Household income
- $52,666
- Rent vs Own
- Severe rent burden
- 1956.0
Population outlook (Clayton County) Hauer SSP2
- Today (2025)
- 310,777 people
- By 2030
- 329,762 · +6.1%
- By 2040
- 368,052 · +18.4%
- By 2050
- 401,196 · +29.1%
- By 2075
- 472,488 · +52.0%
- By 2100
- 500,446 · +61.0%
Race, ethnicity, and origin ACS 2023
- Neighborhood character
- Diverse neighborhood (Simpson 0.67)
- Race & ethnicity
- Black 50% Asian 20% Hispanic / Latino 19% Two or more races 7% White 7%
- Hispanic origin (detail)
- Mexican 11% Dominican 1%
- Foreign-born
- 24% · Vietnam, Canada, South Korea
- Languages at home
- 63% English-only · Spanish 17% Vietnamese 16% Other Asian/Pacific 1%
Political lean MEDSL · Clayton
- 2024 margin
- Solid D (+69.2) · D 84.3% · R 15.1%
- 2008→2024 swing
- +2.8pp toward D · 2008: 66.4pp · 2024: 69.2pp
- All cycles
- 2024: D+69.2 2020: D+70.9 2016: D+71.9 2012: D+70.1 2008: D+66.4
Not yet ingested
- Civics
- —
Market trends
- HPI YoY
- ▼ -98.24%
- Current HPI
- 192.3741
- Rent YoY
- ▼ -1.00%
- Metro
- Atlanta-Sandy Springs-Alpharetta, GA
- State GDP YoY
- ▲ 2.66%
- F500 in state
- 28
Industry mix (Fortune 500 HQ in GA)
| Industry | F500 HQs | Revenue |
|---|---|---|
| Paper / Packaging | 2 | $29B |
|
||
| Retail | 1 | $160B |
|
||
| Transportation / Logistics | 1 | $91B |
|
||
| Airlines | 1 | $62B |
|
||
| Consumer Goods | 1 | $47B |
|
||
| Utilities | 1 | $25B |
|
||
Price history
+305.4% since first listed12 events — show timeline
- 2026-05-11 Pending — GAMLS
- 2026-05-11 Pending — FMLS
- 2026-04-22 Price Changed $195,000 GAMLS
- 2026-04-22 Price Changed $195,000 FMLS
- 2026-02-27 Listed $219,900 FMLS
- 2026-02-27 Listed $219,900 GAMLS
- 2023-01-10 Relisted — GAMLS
- 2023-01-10 Listing Removed — GAMLS
- 2022-11-07 Pending — GAMLS
- 2022-03-26 Listed $199,900 GAMLS
- 1997-09-10 Sold (Public Records) $59,500 Public Records
- 1982-12-31 Sold (Public Records) $48,100 Public Records
Property tax history
+7.9%/yrLatest (2025): $1,272 · +10.9% YoY. Source: county tax records.
Cash-flow waterfall
monthlySold comps — $/sqft
last 12 mo · ≤1 miLoading sold comps…