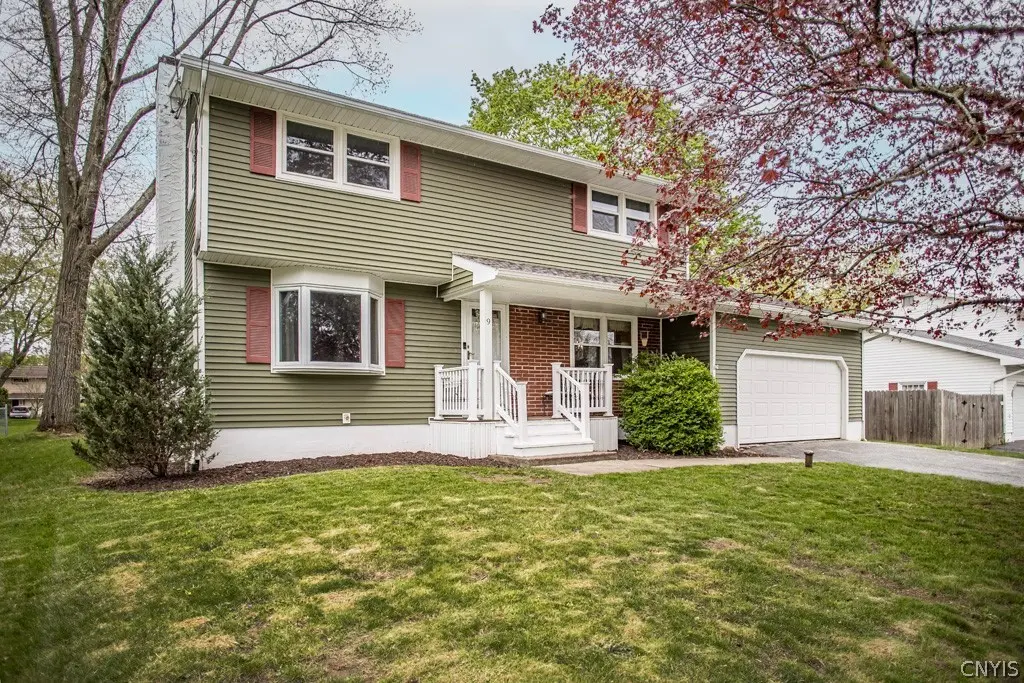
9 Nightingale · Liverpool, NY
Flood risk 1/10 · Minimal
- FEMA flood zone
- X (unshaded)
- Chance of flooding over 30 yrs
- 0.0%
- Est. flood insurance / yr
- $473 – $860
Fire risk 1/10 · Minimal
- Est. fire insurance / yr
- $691 – $1,283
Heat risk 3/10 · Minor
- Hot days now (above 95°F)
- 7 days/yr
- Hot days in 30 yrs
- 16 days/yr
Wind risk 1/10 · Minimal
- Chance of severe wind over 30 yrs
- 0.0%
Air-quality risk 2/10 · Minimal
- Unhealthy air days now
- 0 days/yr
- Unhealthy air days in 30 yrs
- 1 days/yr
Risk factors via First Street. Map © Google.
Why this score? — see what drove the F grade
The composite is a weighted blend of 9 inputs, each scored 0–100. Each bar is that input's sub-score; the figure is the points it added to the 100-point composite (weight × sub-score).
- ARV discount +9.7/15.0
- Cash flow +6.5/30.0
- Schools +4.3/10.0
- Livability +4.3/5.0
- 1% rule +2.7/10.0
- Rent growth +2.5/5.0
- Condition / age +2.5/5.0
- DSCR +0.8/10.0
- Appreciation +0.0/10.0
$285,000
🖨 Deal sheet (PDF) 📄 Offer letter ✓ Due diligence
Listing remarks
Nestled on a quiet neighborhood street in the desirable Bayberry community, 9 Nightingale Path offers the perfect blend of classic charm and everyday convenience. This well-maintained single-family home features approximately 1,749 square feet of living space with 4 bedrooms and 1.5 bathrooms, providing a comfortable and functional layout ideal for a variety of lifestyles. Built in the late 1950s, the home reflects timeless construction paired with the opportunity to personalize and modernize to your taste. Situated within the Liverpool School District, the property enjoys close proximity to local schools, parks, and neighborhood amenities, all contributing to its strong appeal for homeowne
Key facts
- Bayberry community
- Tree lined streets
- 7,650 sq ft lot
Tags
Property features AI
Exterior
- Parking: Attached garage with 2 garage spaces; Driveway; Garage door opener
- Utilities: Electricity connected (circuit breakers); Public water connected; Sewer connected; High speed internet available
- Home design: 2-story home; Existing (previously built/resale property); Rectangular residential lot with city street frontage
- Construction: Poured foundation; Vinyl siding; Attic/crawl hatchway(s) insulated; Blown-in insulation; Spray foam insulation; Structural insulated panels; Copper plumbing
- Exterior features: Blacktop driveway; Deck; Fence (partial); Covered porch/deck
Interior
- Kitchen: Kitchen island; Walk-in pantry; Dishwasher; Electric cooktop; Electric oven; Electric range; Microwave; Refrigerator; Disposal
- Bedrooms: Total rooms: 10 (includes laundry, living room, entry foyer, family room)
- Flooring: Carpet; Hardwood; Vinyl; Varied flooring
- Bathrooms: 1 full bathroom; 1 half bathroom; 1 main-level bathroom
- Heating & cooling: Forced air heating (gas and electric); Central air conditioning
- Interior features: Ceiling fan(s); Separate/formal dining room; Entrance foyer; Separate/formal living room; Kitchen island; Walk-in pantry; Window treatments; Programmable thermostat; Drapes; Thermal windows; Full basement
- Laundry & utility: Washer and dryer; Laundry located in basement; Gas water heater
Neighborhood map
What this means for you Summary
Snapshot
- This is a 3-bed/1.5-bath single-family listed at $285k.
Deal economics
- At list price, monthly cash flow is $-481 ($-6k/yr) — negative.
- To cash-flow at today's rent, offer at most $200k (29.8% below list).
- To meet the 1% rule (rent ≥ 1% of price), the offer needs to be $218k (23.4% below list).
- Recommended offer: $200k (29.8% below list) — sets the bar for cash-flow.
Location & tenants
- Location reads 86/100 on livability (#16 in NY, #363 nationally) — a professional / high-income tenant draw. Strengths: commute A+, housing A+, health & safety A+.
- Liverpool Central School District (suburban): math 49% / reading 49% proficiency, ranked #381 of 590 in NY (top 65%) — families likely to look elsewhere, expect single-tenant / working-renter base with shorter leases.
- Zoned schools: Elmcrest Elementary School (math 45% / reading 53%, grade D, #1,177 of 2,108 statewide, top 56%, 408 students, 38% FRL); Liverpool Middle School (math 47% / reading 62%, grade B-, #214 of 729 statewide, top 31%, 313 students, 51% FRL); Liverpool High School (math 94% / reading 54%, grade B+, #658 of 1,100 statewide, top 60%, 2,124 students, 42% FRL) — zoned schools average 44% FRL vs 28% district-wide (16 pts higher); higher-poverty schools than district average — tighter screening recommended.
- Market conditions: 94 active listings in the ZIP; 3 comparable units currently listed for rent nearby; rentals at typical pace (median 16d on market — plan ~3-4 weeks tenant-placement turnaround); solid renter incomes; 616 units permitted in Onondaga County in 2024 (256 in 5+ unit buildings).
Forward outlook
- Local home prices are declining (-3.0%/yr); year-one equity from $2k of loan paydown is wiped out by about $9k of value loss. Plan a longer hold.
- Onondaga County population projected to shrink 9% by 2050 — rents likely to lag national; underwrite the cash flow, not the appreciation.
Negotiation context
- Only 11 days on market — expect competitive offers; lowballing is unlikely to land.
- Current owner paid $225k; 27% above their basis — modest negotiation headroom, anchor on the comps not their cost.
Risks & watch-outs
- Watch-outs: built in 1958 — expect roof / HVAC / electrical / plumbing capex.
Questions for the listing agent
- What do current leases actually rent for vs. the listed asking? Can we see a recent rent roll and the last 12 months of T-12 income?
- Built in 1958 — when were the roof, HVAC, electrical panel, plumbing, and water heater last replaced?
- Is there a deadline driving the sale (1031 exchange, divorce, estate, relocation)? That informs how much negotiation room exists.
- The area grade is low — what's the realistic commute time and amenity access for the typical tenant pool here? Any planned neighborhood developments (good or bad) we should know about?
- What's the average days-on-market for RENTAL listings here right now (not sales)? A rising rental-DOM trend means longer vacancies and softer asking-rent achievability than the comps imply.
- What's the recent tenant-quality profile in this submarket — average credit score on applications, eviction rate, late-payment / NSF rate, and stable-employment percentage? A property-management company in the area should have these aggregated.
- How much new for-sale + rental construction is in the pipeline within 1–3 miles? Heavy new supply typically softens prices + rents 12–24 months out; constrained supply supports both.
Investment metrics
- 1% rule
- 0.77% ✗
- Cap rate
- 4.27%
- Cash-on-cash
- -7.24%
- DSCR
- 0.68
- GRM
- 10.9
CMA / ARV
- ARV (median comp)
- $299,520
- List price
- $285,000
- Delta
- -4.85%
- Verdict
- FAIR
- Comps
- 20 within 1.0 mi
Show comp detail 12 sales within ~0.75 mi
| Address | Dist | Beds/Ba | Sqft | Sold | Price | $/sf | Match |
|---|---|---|---|---|---|---|---|
| 12 Kiwi Path | 0.19mi | 3/1.5 | 1,804 (+3%) | 1mo | $276,500 | $153 | 85 |
| 63 Bayberry Cir | 0.12mi | 4/1.5 (+1) | 1,712 (-2%) | 8mo | $173,000 | $101 | 79 |
| 4250 Forestbrook Dr | 0.67mi | 3/1.5 | 1,804 (+3%) | 1mo | $320,000 | $177 | 63 |
| 17 Dove | 0.26mi | 4/2.0 (+1) | 1,594 (-9%) | 5mo | $280,900 | $176 | 62 |
| 11 Damson Ln | 0.33mi | 4/2.5 (+1) | 1,836 (+5%) | 7mo | $270,000 | $147 | 61 |
| 13 Kingman Rd | 0.50mi | 4/2.5 (+1) | 1,792 (+2%) | 5mo | $285,000 | $159 | 60 |
| 419 Branchwood Dr | 0.64mi | 3/3.0 | 1,814 (+4%) | 5mo | $325,000 | $179 | 54 |
| 122 Riverdale Rd | 0.67mi | 4/1.5 (+1) | 1,678 (-4%) | 7mo | $285,000 | $170 | 51 |
| 4324 Forestbrook Dr | 0.70mi | 3/2.0 | 1,848 (+6%) | 9mo | $330,000 | $179 | 48 |
| 27 Nectarine Ln | 0.55mi | 4/2.5 (+1) | 1,862 (+6%) | 8mo | $301,500 | $162 | 47 |
| 7 Berrywood Rd | 0.40mi | 4/2.5 (+1) | 1,980 (+13%) | 5mo | $315,000 | $159 | 46 |
| 4201 Fireside Dr | 0.65mi | 4/2.5 (+1) | 1,996 (+14%) | 8mo | $266,600 | $134 | 30 |
Match score weights: distance 35% · size 25% · config 20% · recency 20%. Top-matched comps best support the ARV.
Projected returns pro-forma
-3.0% appreciation · 3.0% rent growth · sell at horizon
- IRR
- -28.8%
- Equity multiple
- 0.04×
- Total profit
- $-76,650
- Equity at exit
- $42,494
- IRR
- -28.2%
- Equity multiple
- -0.32×
- Total profit
- $-105,484
- Equity at exit
- $24,642
Cash invested: $79,800 (down + closing). Projections, not guarantees.
Landlord ↔ Tenant lean methodology
- Overall (STATE)
- 15 Strongly Tenant-Friendly
- State New York
- 15 Strongly Tenant-Friendly · D+10
- County
- — inherits STATE
- City
- — inherits STATE
ZIP-level market 13090
- Active inventory
- 94
- Price-to-rent
- 10.9×
Monthly cashflow live
- Estimated rent
- $2,183 medium interval (Pro) →
- Mortgage (P&I)
- −$1,495
- Tax from tax record
- −$593 /mo · $7,112/yr
- Insurance
- −$119
- HOA
- −$0
- Vacancy / Maint / Mgmt
- −$458
- Net cashflow
- $-481
Break-even live
Sensitivity live
| Price | -10% $-320 | -5% $-401 | +0% $-481 | +5% $-562 | +10% $-643 |
|---|---|---|---|---|---|
| Rent | -10% $-654 | -5% $-567 | +0% $-481 | +5% $-395 | +10% $-309 |
| Rate | -1.0pp $-338 | -0.5pp $-409 | base $-481 | +0.5pp $-555 | +1.0pp $-630 |
UW: 25.0% down · 7.5% · 30yr · 1.5% tax · 5.0% vac · 8.0% maint · 8.0% mgmt
Financing live
Cash to close
- Down payment
- $71,250
- Closing costs
- $8,550
- Reserves months
- —
- Total cash needed
- —
Loan-product check · same deal, 3 products live
Conventional
25% down · 7.5% · 30yr
- Down + closing
- —
- Monthly P&I
- —
- Monthly cashflow
- —
- DSCR
- —
- Eligible?
- —
Personal DTI + credit; lowest rate.
DSCR
20% down · 8.5% · 30yr
- Down + closing
- —
- Monthly P&I
- —
- Monthly cashflow
- —
- DSCR
- —
- Eligible?
- —
No personal income docs; deal must DSCR.
Hard money
10% down · 12.0% · 12mo
- Down + closing
- —
- Monthly P&I
- —
- Monthly cashflow
- —
- DSCR
- —
- Eligible?
- —
Short-term bridge; refi at stabilization.
Rent comps 3 comps
| Address | Beds | Baths | Sqft | Rent | $/sqft | DOM | Units | Dist |
|---|---|---|---|---|---|---|---|---|
| 1 Gallowgate Ct Liverpool, NY | 3.0 | 1.5 | 1585 | $1,698 | $1.07 | 15d | 1 | 0.60mi |
| 108 Parker Ave Liverpool, NY | 4.0 | 1.0 | 1152 | $1,875 | $1.63 | 45d | 1 | 1.46mi |
| 364 Cameco Cir Liverpool, NY | 2.0 | 1.5 | 1072 | $2,200 | $2.05 | 15d | 1 | 1.50mi |
Listing history 3 events
-
2026-05-13status Pending 1600-char remark
-
2026-05-02$285,000 Active 1600-char remark
-
2023-11-02soldstatus $225,000
ⓘ Source: listings_history table (triggers on properties + properties_extension) + one-shot
backfill from property_details.listing_events for pre-trigger history.
Tax reassessment forecast NY · Partial reset (capped growth)
- Current annual tax
- $7,112 · $593/mo
- Projected year-2 tax
- $7,112 · $593/mo
- Expected delta
- $0/yr ($0/mo · 0.0%)
ⓘ Screening estimate from a state-policy table — verify with the county assessor before closing.
Climate risk First Street
- Flood 1/10 Low FEMA zone X (unshaded) · 0% chance over 30 yrs
- Wildfire 1/10 Low
- Heat 3/10 Moderate 7 d/yr ≥95°F today · 16 d/yr by 30 yrs out
- Wind 1/10 Low 0% chance of damaging wind over 30 yrs
- Air quality 2/10 Low 0 unhealthy d/yr today · 1 by 30 yrs out
Nearby sold comps map
Loading sold comps map…
Walkable amenities ~0.75 mi
Loading nearby amenities…
Taxation est. · year 1
- Rental income
- $26,200
- − Mortgage interest
- −$15,964
- − Property taxes
- −$7,112
- − Insurance
- −$1,425
- − Repairs & maintenance
- −$2,096
- − Management
- −$2,096
- − Depreciation
- −$8,291
- Taxable loss
- −$10,785
- Est. tax savings @ 24.0%
- +$2,588
- After-tax cash flow
- $-3,186/yr
For passive investors: Depreciation is non-cash, so a rental often shows a tax loss while cash-flowing — sheltering income. Rental losses are passive: they offset passive income freely, and up to $25,000/yr can offset ordinary (W-2) income if you actively participate and your MAGI is under $100k (phasing out to $0 by $150k); unused losses carry forward. On sale, claimed depreciation is recaptured at up to 25%, and gains may owe capital-gains tax (a 1031 exchange can defer both). Figures are a year-1 estimate at your 24.0% rate — not tax advice; consult a CPA.
Schools (NCES district)
- District
- Liverpool Central School District
- NCES district ID
- 3617520
- Math proficiency
- 49% ▼ -6.00%
- Reading proficiency
- 49% ▲ 1.00%
- Median HH income
- $59,134
- Composite
- 42.84/100
- National rank
- #3134
- State rank
- #381 of 590 in NY
Livability — Liverpool
- Score
- 86/100
- State rank
- #16
- US rank
- #363
Category grades
Schools grade is shown separately in the Schools card above.
Census & demographics
- County
- Onondaga County · 247,257 people
- City population
- 29,004
- Metro
- Syracuse, NY
- Population (ZIP)
- 29,004
- Household income
- $88,492
- Rent vs Own
- Severe rent burden
- 733.0
Population outlook (Onondaga County) Hauer SSP2
- Today (2025)
- 467,894 people
- By 2030
- 463,381 · -1.0%
- By 2040
- 447,697 · -4.3%
- By 2050
- 426,399 · -8.9%
- By 2075
- 373,661 · -20.1%
- By 2100
- 307,967 · -34.2%
Race, ethnicity, and origin ACS 2023
- Neighborhood character
- Predominantly White (79%)
- Race & ethnicity
- White 79% Two or more races 9% Hispanic / Latino 7% Black 6% Asian 3%
- Hispanic origin (detail)
- Mexican 1% Puerto Rican 4%
- Common ancestry
- Romanian 7% Lithuanian 4% Italian 2%
- Foreign-born
- 6% · Canada, China, South Korea
- Languages at home
- 93% English-only · Other Indo-European 2% Spanish 1% Russian/Polish/Slavic 1%
Political lean MEDSL · Onondaga
- 2024 margin
- D (+17.3) · D 58.6% · R 41.4%
- 2008→2024 swing
- -3.0pp toward R · 2008: 20.3pp · 2024: 17.3pp
- All cycles
- 2024: D+17.3 2020: D+20.6 2016: D+12.8 2012: D+21.1 2008: D+20.3
Not yet ingested
- Civics
- —
Market trends
- HPI YoY
- ▼ -228.53%
- Current HPI
- 320.4989
- Rent YoY
- —
- Metro
- Syracuse, NY
- State GDP YoY
- ▲ 2.60%
- F500 in state
- 92
Industry mix (Fortune 500 HQ in NY)
| Industry | F500 HQs | Revenue |
|---|---|---|
| Financial Services | 10 | $950B |
|
||
| Consumer Goods | 9 | $162B |
|
||
| Insurance | 4 | $225B |
|
||
| Telecommunications | 2 | $144B |
|
||
| Pharmaceuticals | 2 | $112B |
|
||
| Media / Entertainment | 2 | $69B |
|
||
Price history
+26.7% since first listed3 events — show timeline
- 2026-05-13 Pending — CNYIS
- 2026-05-02 Listed $285,000 CNYIS
- 2023-11-02 Sold (Public Records) $225,000 Public Records
Property tax history
+4.5%/yrLatest (2025): $7,112 · +5.3% YoY. Source: county tax records.
Cash-flow waterfall
monthlySold comps — $/sqft
last 12 mo · ≤1 miLoading sold comps…