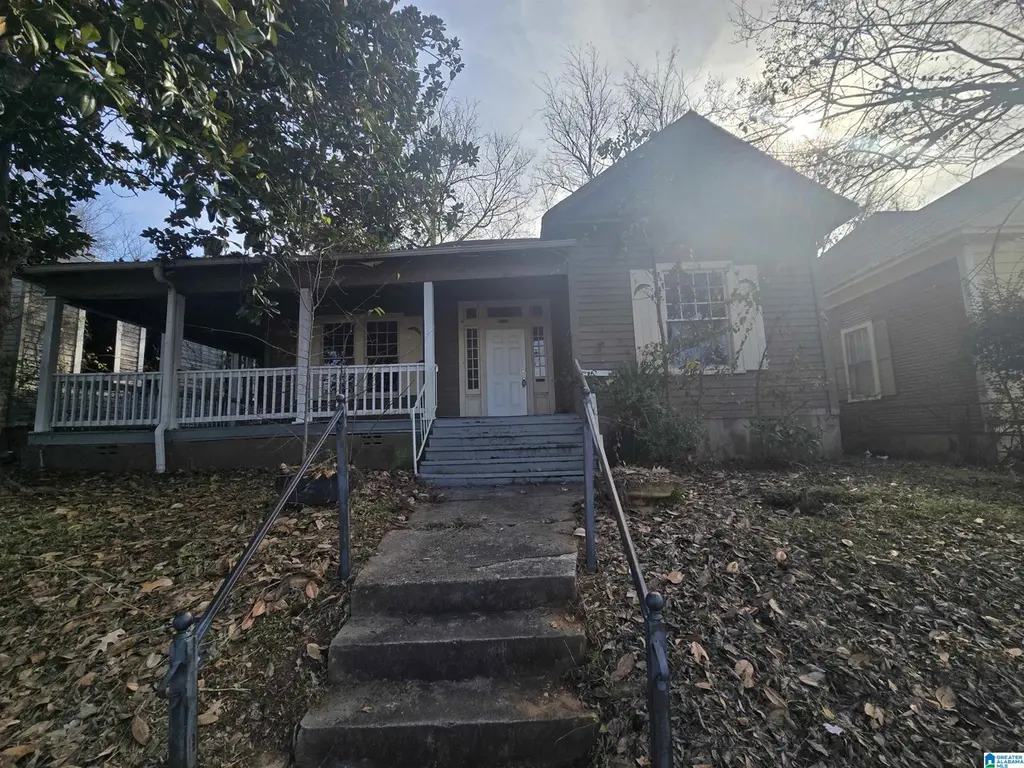
1515 Arlington Ave · Bessemer, AL
Flood risk 1/10 · Minimal
- FEMA flood zone
- X (unshaded)
- Chance of flooding over 30 yrs
- 0.0%
- Est. flood insurance / yr
- $507 – $1,088
Fire risk 2/10 · Minimal
- Est. fire insurance / yr
- $916 – $1,700
Heat risk 7/10 · Major
- Hot days now (above 108°F)
- 7 days/yr
- Hot days in 30 yrs
- 20 days/yr
Wind risk 6/10 · Moderate
- Chance of severe wind over 30 yrs
- 35.0%
Air-quality risk 3/10 · Minor
- Unhealthy air days now
- 2 days/yr
- Unhealthy air days in 30 yrs
- 5 days/yr
Risk factors via First Street. Map © Google.
Why this score? — see what drove the B grade
The composite is a weighted blend of 9 inputs, each scored 0–100. Each bar is that input's sub-score; the figure is the points it added to the 100-point composite (weight × sub-score).
- Cash flow +30.0/30.0
- ARV discount +15.0/15.0
- 1% rule +10.0/10.0
- DSCR +10.0/10.0
- Livability +3.0/5.0
- Condition / age +2.5/5.0
- Rent growth +1.7/5.0
- Schools +0.8/10.0
- Appreciation +0.0/10.0
$59,900
🖨 Deal sheet 📄 Offer letter ✓ Due diligence
Listing remarks MLS
Great Investment Opportunity! This 3-bedroom home offers strong potential for rental income or value-add renovation. Featuring a functional floor plan, spacious bedrooms, and solid bones, this property is ideal for investors looking to rehab.
Key facts
- 6,534 sq ft lot
- Built 1900
- Listed 181 days
Neighborhood map
What this means for you Summary
Snapshot
- This is a 3-bed/1.0-bath single-family listed at $60k.
Deal economics
- At list price, monthly cash flow is $472 ($6k/yr) — positive.
- The deal already cash-flows at list — no discount required.
- Meets the 1% rule at list price ($1k rent vs $60k).
- Recommended offer: $53k (12.0% below list) — sets the bar for market timing.
- Cap rate 15.8% vs local median 5.9% in Bessemer — top-decile yield for the area; either an underpriced asset or a hidden risk that comps aren't pricing in. Stress-test before assuming the spread holds.
Location & tenants
- Location reads 59/100 on livability (#331 in AL) — a working-class tenant base; expect higher turnover. Strengths: commute A+, cost of living A+, housing A; Watch: schools D-, crime F, amenities F.
- Bessemer City (suburban): math 3% / reading 19% proficiency, ranked #120 of 129 in AL (top 93%) — low school quality limits family demand, transient renter base, plan for 1-2y turnover; 87% free/reduced lunch — lower-income household profile, screen leases tightly.
- Market conditions: Rents falling (-3.1%/yr); 115 active listings in the ZIP; 28 comparable units currently listed for rent nearby; rentals at typical pace (median 24d on market — plan ~3-4 weeks tenant-placement turnaround); lower-income renter base — watch delinquency; 2,114 units permitted in Jefferson County in 2024 (556 in 5+ unit buildings).
- This rent runs 38% of the median local income ($35k/yr) — at the standard rent-burdened threshold; future hikes will face affordability resistance.
Forward outlook
- Local home prices are declining (-3.0%/yr); year-one equity from $414 of loan paydown is wiped out by about $2k of value loss. Plan a longer hold.
- Jefferson County population projected to shrink 4% by 2050 — rents likely to lag national; underwrite the cash flow, not the appreciation.
- At projected returns (-3.0% appreciation + 0.0% rent growth), your $17k cash investment doubles in ~4 years — after that, you're playing with house money.
Negotiation context
- It's been on market 181 days — a 12% lower offer ($53k) is reasonable based on typical stale-listing flexibility.
- 3 sale attempts since 5y ago; this cycle's ask has dropped $15k (20%) from the opening price — seller is motivated, your offer sets the floor, not the list.
Risks & watch-outs
- Watch-outs: built in 1900 — expect roof / HVAC / electrical / plumbing capex.
- Climate carrying-cost: major wind risk, 35% chance of damaging wind over 30y; extreme-heat days projected 7→20/yr by 2055 (HVAC capex compounding) — expect insurance premiums to compound above CPI over the hold.
Questions for the listing agent
- It's been on market 181 days. Have you received any prior offers? Is the seller open to a 12% concession, seller financing, or rate buy-down credit?
- Built in 1900 — when were the roof, HVAC, electrical panel, plumbing, and water heater last replaced?
- Why hasn't it sold? Are there any deal-killer items the seller is aware of (foundation, flood, title, zoning, code violations)?
- Is there a deadline driving the sale (1031 exchange, divorce, estate, relocation)? That informs how much negotiation room exists.
- Schools are D-rated, which usually means shorter tenancies and higher turnover. Who's the typical renter profile here, and what's been the actual vacancy rate?
- Crime grade is F in this area — have there been break-ins, vandalism, or insurance claims at this property in the last 3 years? What carrier currently insures it and at what premium?
- What's the average days-on-market for RENTAL listings here right now (not sales)? A rising rental-DOM trend means longer vacancies and softer asking-rent achievability than the comps imply.
- What's the recent tenant-quality profile in this submarket — average credit score on applications, eviction rate, late-payment / NSF rate, and stable-employment percentage? A property-management company in the area should have these aggregated.
- How much new for-sale + rental construction is in the pipeline within 1–3 miles? Heavy new supply typically softens prices + rents 12–24 months out; constrained supply supports both.
Investment metrics
- 1% rule
- 1.88% ✓
- Cap rate
- 15.76%
- Cash-on-cash
- 33.80%
- DSCR
- 2.50
- GRM
- 4.4
CMA / ARV
- ARV (median comp)
- $81,505
- List price
- $59,900
- Delta
- -26.51%
- Verdict
- UNDERPRICED
- Comps
- 20 within 1.0 mi
Show comp detail 12 sales within ~0.75 mi
| Address | Dist | Beds/Ba | Sqft | Sold | Price | $/sf | Match |
|---|---|---|---|---|---|---|---|
| 1615 Dartmouth Ave | 0.27mi | 3/1.0 | 1,186 (-11%) | 4mo | $47,500 | $40 | 65 |
| 419 19th St S | 0.46mi | 3/2.0 | 1,430 (+7%) | 1mo | $28,000 | $20 | 62 |
| 529 12th St N | 0.61mi | 3/2.0 | 1,347 (+1%) | 10mo | $90,000 | $67 | 58 |
| 1607 Holbrook Ave | 0.62mi | 3/2.0 | 1,264 (-5%) | 5mo | $31,000 | $25 | 54 |
| 1506 Avenue I | 0.64mi | 3/2.0 | 1,312 (-2%) | 12mo | $141,000 | $107 | 53 |
| 1711 Holbrook Ave | 0.64mi | 3/2.0 | 1,300 (-3%) | 11mo | $124,000 | $95 | 53 |
| 1500 7th Ave N | 0.67mi | 3/2.0 | 1,421 (+6%) | 3mo | $46,000 | $32 | 52 |
| 1625 Holbrook Ave | 0.63mi | 3/2.0 | 1,288 (-4%) | 14mo | $123,500 | $96 | 49 |
| 820 N 3rd Ave | 0.71mi | 3/1.5 | 1,288 (-4%) | 17mo | $23,200 | $18 | 45 |
| 802 Clarendon Ave | 0.67mi | 2/2.0 (-1) | 1,214 (-9%) | 5mo | $106,000 | $87 | 40 |
| 2306 Clarendon Ave | 0.73mi | 3/2.0 | 1,492 (+12%) | 5mo | $10,000 | $7 | 38 |
| 2232 Dartmouth Ave | 0.72mi | 3/1.0 | 1,176 (-12%) | 16mo | $79,900 | $68 | 33 |
Match score weights: distance 35% · size 25% · config 20% · recency 20%. Top-matched comps best support the ARV.
Projected returns pro-forma
-3.0% appreciation · 0.0% rent growth · sell at horizon
- IRR
- 25.7%
- Equity multiple
- 2.02×
- Total profit
- $17,099
- Equity at exit
- $8,931
- IRR
- 31.5%
- Equity multiple
- 3.44×
- Total profit
- $40,953
- Equity at exit
- $5,179
Cash invested: $16,772 (down + closing). Projections, not guarantees.
Landlord ↔ Tenant lean methodology
- Overall (STATE)
- 90 Strongly Landlord-Friendly
- State Alabama
- 90 Strongly Landlord-Friendly · R+15
- County
- — inherits STATE
- City
- — inherits STATE
ZIP-level market 35020
- Home prices YoY
- -24.2%
- Rents YoY
- -3.1%
- Active inventory
- 115
- Price-to-rent
- 4.4×
Monthly cashflow live
- Estimated rent
- $1,126 high interval (Pro) →
- Mortgage (P&I)
- −$314
- Tax from tax record
- −$78 /mo · $940/yr
- Insurance
- −$25
- HOA
- −$0
- Vacancy / Maint / Mgmt
- −$237
- Net cashflow
- $472
Break-even live
UW: 25.0% down · 7.5% · 30yr · 1.5% tax · 5.0% vac · 8.0% maint · 8.0% mgmt
Financing live
Cash to close
- Down payment
- $14,975
- Closing costs
- $1,797
- Reserves months
- —
- Total cash needed
- —
Loan-product check · same deal, 3 products live
Conventional
25% down · 7.5% · 30yr
- Down + closing
- —
- Monthly P&I
- —
- Monthly cashflow
- —
- DSCR
- —
- Eligible?
- —
Personal DTI + credit; lowest rate.
DSCR
20% down · 8.5% · 30yr
- Down + closing
- —
- Monthly P&I
- —
- Monthly cashflow
- —
- DSCR
- —
- Eligible?
- —
No personal income docs; deal must DSCR.
Hard money
10% down · 12.0% · 12mo
- Down + closing
- —
- Monthly P&I
- —
- Monthly cashflow
- —
- DSCR
- —
- Eligible?
- —
Short-term bridge; refi at stabilization.
Rent comps 28 comps
| Address | Beds | Baths | Sqft | Rent | $/sqft | DOM | Units | Dist |
|---|---|---|---|---|---|---|---|---|
| 320 16th St S Bessemer, AL | 3.0 | 1.5 | 1792 | $950 | $0.53 | 43d | 1 | 0.21mi |
| 1307 3rd Ave N Bessemer, AL | 4.0 | 1.0 | 960 | $1,200 | $1.25 | 43d | 1 | 0.37mi |
| 1622 Fairfax Ave Bessemer, AL | 2.0 | 2.0 | 1104 | $995 | $0.90 | 2d | 1 | 0.42mi |
| 420 19th St S Bessemer, AL | 2.0 | 1.0 | 910 | $850 | $0.93 | 43d | 1 | 0.42mi |
| 1830 Exeter Ave Bessemer, AL | 2.0 | 1.0 | 913 | $850 | $0.93 | 43d | 1 | 0.44mi |
| 419 19th St S Bessemer, AL | 3.0 | 2.0 | 1200 | $1,050 | $0.88 | 11d | 1 | 0.45mi |
| 1811 Fairfax Ave Bessemer, AL | 4.0 | 2.0 | 1732 | $1,350 | $0.78 | 23d | 1 | 0.52mi |
| 931 Dartmouth Ave Bessemer, AL | 3.0 | 1.0 | 984 | $925 | $0.94 | 43d | 1 | 0.56mi |
| 1600 Holbrook Ave Bessemer, AL | 3.0 | 1.0 | 885 | $999 | $1.13 | 2d | 1 | 0.58mi |
| 1909 Holbrook Ave Bessemer, AL | 2.0 | 1.0 | 1064 | $930 | $0.87 | 43d | 1 | 0.71mi |
| 719 16th St N Bessemer, AL | 3.0 | 1.5 | 1085 | $1,075 | $0.99 | 23d | 1 | 0.72mi |
| 810 Fairfax Ave Bessemer, AL | 3.0 | 1.0 | 1042 | $1,050 | $1.01 | 23d | 1 | 0.74mi |
| 808 Fairfax Ave Bessemer, AL | 3.0 | 1.0 | 1042 | $1,050 | $1.01 | 23d | 1 | 0.75mi |
| 830 5th Ave N Bessemer, AL | 3.0 | 1.0 | 1072 | $1,000 | $0.93 | 43d | 1 | 0.77mi |
| 806 4th Ave N Bessemer, AL | 3.0 | 1.0 | 1092 | $1,050 | $0.96 | 23d | 1 | 0.79mi |
| 817 15th St N Bessemer, AL | 3.0 | 2.0 | 1116 | $1,125 | $1.01 | 3d | 1 | 0.80mi |
| 434 Bryant St Bessemer, AL | 4.0 | 2.0 | 1540 | $1,523 | $0.99 | 3d | 1 | 0.95mi |
| 704 Avenue I Bessemer, AL | 3.0 | 1.0 | 1232 | $1,200 | $0.97 | 23d | 1 | 0.97mi |
| 1015 11th St N Bessemer, AL | 2.0 | 1.0 | 876 | $975 | $1.11 | 11d | 1 | 1.05mi |
| 300 Norwood Ave Bessemer, AL | 3.0 | 1.0 | 966 | $900 | $0.93 | 11d | 1 | 1.20mi |
| 300 Norwood Ave Bessemer, AL | 3.0 | 1.0 | 966 | $1,000 | $1.04 | 23d | 1 | 1.20mi |
| 200 Center St Bessemer, AL | 3.0 | 1.5 | 1826 | $1,200 | $0.66 | 10d | 1 | 1.22mi |
| 531 W Lake Dr Bessemer, AL | 3.0 | 1.0 | 1014 | $1,200 | $1.18 | 3d | 1 | 1.25mi |
| 510 W Lake Dr Bessemer, AL | 3.0 | 1.0 | 950 | $1,025 | $1.08 | 16d | 1 | 1.27mi |
| 512 W Lake Dr Bessemer, AL | 3.0 | 1.0 | 944 | $1,125 | $1.19 | 11d | 1 | 1.27mi |
| 18 Center St Bessemer, AL | 3.0 | 1.0 | 1418 | $1,100 | $0.78 | 43d | 1 | 1.28mi |
| 10 Center St Bessemer, AL | 3.0 | 1.0 | 1152 | $1,000 | $0.87 | 43d | 1 | 1.30mi |
| 236 Clifton St Bessemer, AL | 3.0 | 1.0 | 1450 | $1,100 | $0.76 | 43d | 1 | 1.32mi |
Listing history 30 events
-
2026-06-18days on market $59,900 Active 181 DOM
-
2026-06-17days on market $59,900 Active 180 DOM
-
2026-06-16days on market $59,900 Active 179 DOM
-
2026-06-15days on market $59,900 Active 178 DOM
-
2026-06-13days on market $59,900 Active 176 DOM
-
2026-06-10days on market $59,900 Active 173 DOM
-
2026-06-09days on market $59,900 Active 172 DOM
-
2026-06-08days on market $59,900 Active 171 DOM
-
2026-06-07days on market $59,900 Active 170 DOM
-
2026-06-05days on market $59,900 Active 167 DOM
-
2026-06-03days on market $59,900 Active 166 DOM
-
2026-06-02days on market $59,900 Active 165 DOM
-
2026-06-01days on market $59,900 Active 164 DOM
-
2026-05-31days on market $59,900 Active 163 DOM
-
2026-05-09price $59,900 242-char remark
Show marketing remark (242 chars)
Great Investment Opportunity! This 3-bedroom home offers strong potential for rental income or value-add renovation. Featuring a functional floor plan, spacious bedrooms, and solid bones, this property is ideal for investors looking to rehab.
-
2026-02-12price $69,000 242-char remark
Show marketing remark (242 chars)
Great Investment Opportunity! This 3-bedroom home offers strong potential for rental income or value-add renovation. Featuring a functional floor plan, spacious bedrooms, and solid bones, this property is ideal for investors looking to rehab.
-
2025-12-19$74,900 Active 242-char remark
Show marketing remark (242 chars)
Great Investment Opportunity! This 3-bedroom home offers strong potential for rental income or value-add renovation. Featuring a functional floor plan, spacious bedrooms, and solid bones, this property is ideal for investors looking to rehab.
-
2025-03-11soldstatus $65,500
-
2022-12-27soldstatus $49,500
-
2021-05-17soldstatus $36,000 Sold 228-char remark
Show marketing remark (228 chars)
NEW PRICE!! INVESTORS! If you are looking for an instant cash flowing investment, look no further. This property is currently rented for $675 per month. Current lease will expire on 5/31/21. 48 hour notice required for showings.
-
2021-04-23historical Contingent 228-char remark
Show marketing remark (228 chars)
NEW PRICE!! INVESTORS! If you are looking for an instant cash flowing investment, look no further. This property is currently rented for $675 per month. Current lease will expire on 5/31/21. 48 hour notice required for showings.
-
2021-04-10price $40,000 228-char remark
Show marketing remark (228 chars)
NEW PRICE!! INVESTORS! If you are looking for an instant cash flowing investment, look no further. This property is currently rented for $675 per month. Current lease will expire on 5/31/21. 48 hour notice required for showings.
-
2021-04-09status Active 228-char remark
Show marketing remark (228 chars)
NEW PRICE!! INVESTORS! If you are looking for an instant cash flowing investment, look no further. This property is currently rented for $675 per month. Current lease will expire on 5/31/21. 48 hour notice required for showings.
-
2021-03-09historical Contingent 228-char remark
Show marketing remark (228 chars)
NEW PRICE!! INVESTORS! If you are looking for an instant cash flowing investment, look no further. This property is currently rented for $675 per month. Current lease will expire on 5/31/21. 48 hour notice required for showings.
-
2021-02-26$55,000 Active 228-char remark
Show marketing remark (228 chars)
NEW PRICE!! INVESTORS! If you are looking for an instant cash flowing investment, look no further. This property is currently rented for $675 per month. Current lease will expire on 5/31/21. 48 hour notice required for showings.
-
2021-02-20historical $55,000 228-char remark
Show marketing remark (228 chars)
NEW PRICE!! INVESTORS! If you are looking for an instant cash flowing investment, look no further. This property is currently rented for $675 per month. Current lease will expire on 5/31/21. 48 hour notice required for showings.
-
2016-06-01soldstatus $47,500
-
2015-07-23soldstatus $49,000
-
1992-11-25soldstatus $27,000
-
1979-04-01soldstatus $21,000
ⓘ Source: listings_history table (triggers on properties + properties_extension) + one-shot
backfill from property_details.listing_events for pre-trigger history.
Tax reassessment forecast AL · Resets to sale price
- Current annual tax
- $940 · $78/mo
- Projected year-2 tax
- $940 · $78/mo
- Expected delta
- $0/yr ($0/mo · 0.0%)
ⓘ Screening estimate from a state-policy table — verify with the county assessor before closing.
Climate risk First Street
- Flood 1/10 Low FEMA zone X (unshaded) · 0% chance over 30 yrs
- Wildfire 2/10 Low
- Heat 7/10 Severe 7 d/yr ≥108°F today · 20 d/yr by 30 yrs out
- Wind 6/10 Major 35% chance of damaging wind over 30 yrs
- Air quality 3/10 Moderate 2 unhealthy d/yr today · 5 by 30 yrs out
Nearby sold comps map
Loading sold comps map…
Walkable amenities ~0.75 mi
Loading nearby amenities…
Taxation est. · year 1
- Rental income
- $13,516
- − Mortgage interest
- −$3,355
- − Property taxes
- −$940
- − Insurance
- −$300
- − Repairs & maintenance
- −$1,081
- − Management
- −$1,081
- − Depreciation
- −$1,743
- Taxable income
- $5,016
- Est. tax owed @ 24.0%
- −$1,204
- After-tax cash flow
- $4,465/yr
For passive investors: Depreciation is non-cash, so a rental often shows a tax loss while cash-flowing — sheltering income. Rental losses are passive: they offset passive income freely, and up to $25,000/yr can offset ordinary (W-2) income if you actively participate and your MAGI is under $100k (phasing out to $0 by $150k); unused losses carry forward. On sale, claimed depreciation is recaptured at up to 25%, and gains may owe capital-gains tax (a 1031 exchange can defer both). Figures are a year-1 estimate at your 24.0% rate — not tax advice; consult a CPA.
Schools (NCES district)
- District
- Bessemer City
- NCES district ID
- 0100330
- Math proficiency
- 3% ▼ -18.00%
- Reading proficiency
- 19% ▼ -3.00%
- Median HH income
- $29,721
- Composite
- 8.45/100
- National rank
- #9905
- State rank
- #120 of 129 in AL
Livability — Bessemer
- Score
- 59/100
- State rank
- #331
- US rank
- #20078
Category grades
Schools grade is shown separately in the Schools card above.
Census & demographics
- Census place
- Bessemer, AL
- County
- Jefferson County · 527,445 people
- City population
- 48,018
- Metro
- Birmingham-Hoover, AL
- Population (ZIP)
- 24,892
- Household income
- $35,362
- Rent vs Own
- Severe rent burden
- 1001.0
Population outlook (Jefferson County) Hauer SSP2
- Today (2025)
- 669,185 people
- By 2030
- 669,694 · +0.1%
- By 2040
- 661,388 · -1.2%
- By 2050
- 643,086 · -3.9%
- By 2075
- 577,267 · -13.7%
- By 2100
- 474,758 · -29.1%
Race, ethnicity, and origin ACS 2023
- Neighborhood character
- Predominantly Black (74%)
- Race & ethnicity
- Black 74% Hispanic / Latino 13% White 11% Two or more races 6%
- Hispanic origin (detail)
- Mexican 10%
- Foreign-born
- 5% · Canada
- Languages at home
- 89% English-only · Spanish 11%
Political lean MEDSL · Jefferson
- 2024 margin
- D (+10.4) · D 54.6% · R 44.2% · Other 1.2%
- 2008→2024 swing
- +5.4pp toward D · 2008: 5.1pp · 2024: 10.4pp
- All cycles
- 2024: D+10.4 2020: D+13.2 2016: D+7.2 2012: D+6.0 2008: D+5.1
Not yet ingested
- Civics
- —
Market trends
- HPI YoY
- ▼ -57.54%
- Current HPI
- 179.7702
- Rent YoY
- ▼ -3.12%
- Metro
- Birmingham-Hoover, AL
- State GDP YoY
- ▲ 2.94%
- F500 in state
- 4
Industry mix (Fortune 500 HQ in AL)
| Industry | F500 HQs | Revenue |
|---|---|---|
| Financial Services | 1 | $8B |
|
||
| Healthcare | 1 | $5B |
|
||
Price history
+185.2% since first listed16 events — show timeline
- 2026-05-09 Price Changed $59,900 Greater Alabama MLS
- 2026-02-12 Price Changed $69,000 Greater Alabama MLS
- 2025-12-19 Listed $74,900 Greater Alabama MLS
- 2025-03-11 Sold (Public Records) $65,500 Public Records
- 2022-12-27 Sold (Public Records) $49,500 Public Records
- 2021-05-17 Sold (MLS) $36,000 Greater Alabama MLS
- 2021-04-23 Contingent — Greater Alabama MLS
- 2021-04-10 Price Changed $40,000 Greater Alabama MLS
- 2021-04-09 Relisted — Greater Alabama MLS
- 2021-03-09 Contingent — Greater Alabama MLS
- 2021-02-26 Listed $55,000 Greater Alabama MLS
- 2021-02-20 Coming Soon $55,000 Greater Alabama MLS
- 2016-06-01 Sold (Public Records) $47,500 Public Records
- 2015-07-23 Sold (Public Records) $49,000 Public Records
- 1992-11-25 Sold (Public Records) $27,000 Public Records
- 1979-04-01 Sold (Public Records) $21,000 Public Records
Property tax history
+4.0%/yrLatest (2025): $940 · +4.4% YoY. Source: county tax records.
Cash-flow waterfall
monthlySold comps — $/sqft
last 12 mo · ≤1 miLoading sold comps…