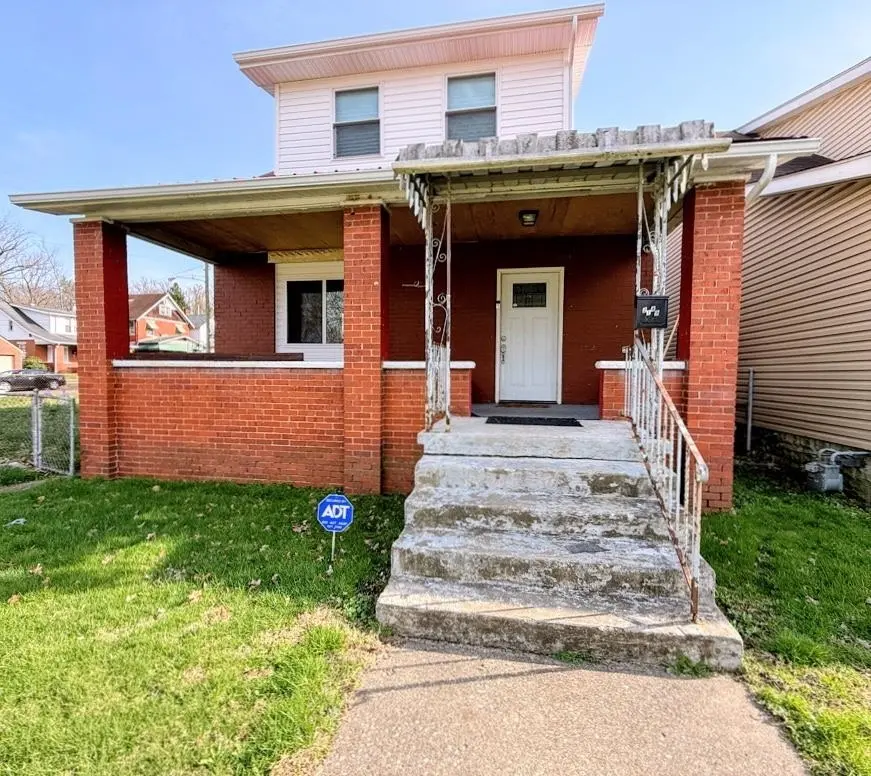
2149 9th Ave · Huntington, WV
Flood risk 6/10 · Moderate
- FEMA flood zone
- X (unshaded)
- Chance of flooding over 30 yrs
- 0.75%
- Est. flood insurance / yr
- $507 – $1,088
Fire risk 2/10 · Minimal
- Est. fire insurance / yr
- $787 – $1,461
Heat risk 5/10 · Moderate
- Hot days now (above 102°F)
- 7 days/yr
- Hot days in 30 yrs
- 19 days/yr
Wind risk 2/10 · Minimal
- Chance of severe wind over 30 yrs
- 1.0%
Air-quality risk 2/10 · Minimal
- Unhealthy air days now
- 0 days/yr
- Unhealthy air days in 30 yrs
- 1 days/yr
Risk factors via First Street. Map © Google.
Why this score? — see what drove the C- grade
The composite is a weighted blend of 9 inputs, each scored 0–100. Each bar is that input's sub-score; the figure is the points it added to the 100-point composite (weight × sub-score).
- Cash flow +17.5/30.0
- ARV discount +7.5/15.0
- Appreciation +7.5/10.0
- DSCR +5.5/10.0
- Livability +4.0/5.0
- 1% rule +3.4/10.0
- Schools +3.0/10.0
- Rent growth +2.5/5.0
- Condition / age +2.5/5.0
$115,000
🖨 Deal sheet (PDF) 📄 Offer letter ✓ Due diligence
Listing remarks
Charming 1.5 story brick home on a spacious double lot, featuring a fully fenced yard and a detached garage. Recently renovated within the last five years, the home offers updated plumbing, electrical, and new windows throughout. Inside, you'll find an open concept kitchen, dining, and living area, along with two bedrooms and two full bathrooms, including one conveniently located on the main floor. A welcoming front porch and a well designed laundry room complete the space, making this home move in ready.
Key facts
- Updated electrical
- Open concept kitchen
- Fully fenced yard
Tags
Property features AI
Exterior
- Parking: On-street parking; Detached parking
- Utilities: Public water; Public sewer
- Home design: Single-family residence; Single-story
- Construction: Brick and vinyl siding exterior; Metal roof; Crawl space foundation
- Exterior features: Porch; Chain link fencing; Level lot
Interior
- Kitchen: Range; Oven
- Flooring: Tile; Carpet
- Bathrooms: 2 full bathrooms
- Heating & cooling: Central heating (natural gas); Central air; Ceiling fan(s)
- Interior features: Insulated windows; Storm door(s)
Neighborhood map
What this means for you Summary
Snapshot
- This is a 2-bed/1.0-bath single-family listed at $115k.
Deal economics
- At list price, monthly cash flow is $88 ($1k/yr) — positive.
- The deal already cash-flows at list — no discount required.
- To meet the 1% rule (rent ≥ 1% of price), the offer needs to be $97k (15.7% below list).
- Recommended offer: $97k (15.7% below list) — sets the bar for 1% rule.
Location & tenants
- Location reads 79/100 on livability (#16 in WV, #2,045 nationally) — a middle-class / working-renter tenant base. Strengths: amenities A+, commute A+, cost of living A+; Watch: crime F, employment F.
- Cabell County Schools (urban): math 31% / reading 42% proficiency, ranked #13 of 55 in WV (top 24%) — families likely to look elsewhere, expect single-tenant / working-renter base with shorter leases.
- Zoned schools: Spring Hill Elementary School (math 17% / reading 22%, grade F, #350 of 377 statewide, top 95%, 381 students, 0% FRL); Huntington East Middle School (math 18% / reading 32%, grade F, #81 of 109 statewide, top 76%, 585 students, 0% FRL); Huntington High School (math 26% / reading 50%, grade F, #31 of 110 statewide, top 28%, 1,704 students, 0% FRL) — zoned schools average 0% FRL vs 47% district-wide (47 pts lower); this property's tenant base skews higher-income than the district average.
- Market conditions: 16 active listings in the ZIP; 3 comparable units currently listed for rent nearby; rentals lingering (median 45d on market — plan ~5-8 weeks vacancy on turnover, expect pricing pressure); 100% of comp listings sitting > 30 days — soft ceiling on asking rent; lower-income renter base — watch delinquency; 61 units permitted in Cabell County in 2024 (5 in 5+ unit buildings).
- At $969/mo this rent would consume 48% of the median local household income ($24k/yr) (locally 813% of renters already pay >50% of income on rent) — very limited rent-growth headroom before tenants either downsize or default.
Forward outlook
- In year one you build about $6k of equity ($795 loan paydown + $6k appreciation (4.9% local appreciation)).
- At projected returns (4.9% appreciation + 3.0% rent growth), your $32k cash investment doubles in ~4 years — after that, you're playing with house money.
- By year 6, paydown + projected appreciation supports a ~$35k cash-out refi (75% LTV) — recoverable capital for the next deal without selling this one.
Negotiation context
- It's been on market 77 days — a 6% lower offer ($108k) is reasonable based on typical stale-listing flexibility.
Risks & watch-outs
- Watch-outs: built in 1914 — expect roof / HVAC / electrical / plumbing capex.
- Climate carrying-cost: major flood risk; extreme-heat days projected 7→19/yr by 2055 (HVAC capex compounding) — expect insurance premiums to compound above CPI over the hold.
Questions for the listing agent
- It's been on market 77 days. Have you received any prior offers? Is the seller open to a 16% concession, seller financing, or rate buy-down credit?
- Built in 1914 — when were the roof, HVAC, electrical panel, plumbing, and water heater last replaced?
- Why hasn't it sold? Are there any deal-killer items the seller is aware of (foundation, flood, title, zoning, code violations)?
- Is there a deadline driving the sale (1031 exchange, divorce, estate, relocation)? That informs how much negotiation room exists.
- Crime grade is F in this area — have there been break-ins, vandalism, or insurance claims at this property in the last 3 years? What carrier currently insures it and at what premium?
- What's the average days-on-market for RENTAL listings here right now (not sales)? A rising rental-DOM trend means longer vacancies and softer asking-rent achievability than the comps imply.
- What's the recent tenant-quality profile in this submarket — average credit score on applications, eviction rate, late-payment / NSF rate, and stable-employment percentage? A property-management company in the area should have these aggregated.
- How much new for-sale + rental construction is in the pipeline within 1–3 miles? Heavy new supply typically softens prices + rents 12–24 months out; constrained supply supports both.
Investment metrics
- 1% rule
- 0.84% ✗
- Cap rate
- 7.21%
- Cash-on-cash
- 3.27%
- DSCR
- 1.15
- GRM
- 9.9
CMA / ARV
- ARV (on-the-fly)
- $66,906
- Comps found
- 12
Show comp detail 12 sales within ~0.75 mi
| Address | Dist | Beds/Ba | Sqft | Sold | Price | $/sf | Match |
|---|---|---|---|---|---|---|---|
| 916 23rd St | 0.13mi | 3/2.0 (+1) | 1,143 (+1%) | 1mo | $106,900 | $94 | 83 |
| 2204 9th Ave | 0.04mi | 2/1.0 | 1,218 (+7%) | 11mo | $101,000 | $83 | 76 |
| 1837 Rural Ave | 0.50mi | 3/1.0 (+1) | 1,112 (-2%) | 14mo | $98,000 | $88 | 57 |
| 1743 Buffington Ave | 0.48mi | 3/1.0 (+1) | 1,008 (-11%) | 3mo | $32,500 | $32 | 51 |
| 616 John Marshall Dr | 0.63mi | 3/1.0 (+1) | 1,056 (-7%) | 4mo | $57,500 | $54 | 50 |
| 1211 26th St | 0.50mi | 2/2.0 | 1,077 (-5%) | 17mo | $63,555 | $59 | 50 |
| 403 Cabell Ct | 0.59mi | 3/1.0 (+1) | 1,167 (+3%) | 18mo | $34,500 | $30 | 47 |
| 174 Oney Ave | 0.71mi | 2/1.0 | 1,030 (-9%) | 14mo | $29,000 | $28 | 40 |
| 104 Oney Ave | 0.60mi | 2/2.0 | 1,212 (+7%) | 20mo | $85,500 | $71 | 40 |
| 9 Kirk Pl | 0.65mi | 3/1.0 (+1) | 1,248 (+10%) | 14mo | $25,000 | $20 | 36 |
| 616 John Marshall St | 0.71mi | 3/1.0 (+1) | 1,056 (-7%) | 18mo | $100,000 | $95 | 35 |
| 1239 25th St | 0.58mi | 3/2.0 (+1) | 1,224 (+8%) | 19mo | $18,000 | $15 | 35 |
Match score weights: distance 35% · size 25% · config 20% · recency 20%. Top-matched comps best support the ARV.
Projected returns pro-forma
4.91% appreciation · 3.0% rent growth · sell at horizon
- IRR
- 15.4%
- Equity multiple
- 1.98×
- Total profit
- $31,438
- Equity at exit
- $64,538
- IRR
- 15.9%
- Equity multiple
- 3.81×
- Total profit
- $90,408
- Equity at exit
- $110,866
Cash invested: $32,200 (down + closing). Projections, not guarantees.
Landlord ↔ Tenant lean methodology
- Overall (STATE)
- 83 Strongly Landlord-Friendly
- State West Virginia
- 83 Strongly Landlord-Friendly · R+22
- County
- — inherits STATE
- City
- — inherits STATE
ZIP-level market 25703
- Home prices YoY
- 3.0%
- Active inventory
- 16
- Price-to-rent
- 9.9×
Monthly cashflow live
- Estimated rent
- $969 medium interval (Pro) →
- Mortgage (P&I)
- −$603
- Tax from tax record
- −$27 /mo · $324/yr
- Insurance
- −$48
- HOA
- −$0
- Vacancy / Maint / Mgmt
- −$204
- Net cashflow
- $88
Break-even live
Sensitivity live
| Price | -10% $153 | -5% $120 | +0% $88 | +5% $55 | +10% $23 |
|---|---|---|---|---|---|
| Rent | -10% $11 | -5% $49 | +0% $88 | +5% $126 | +10% $164 |
| Rate | -1.0pp $146 | -0.5pp $117 | base $88 | +0.5pp $58 | +1.0pp $28 |
UW: 25.0% down · 7.5% · 30yr · 1.5% tax · 5.0% vac · 8.0% maint · 8.0% mgmt
Financing live
Cash to close
- Down payment
- $28,750
- Closing costs
- $3,450
- Reserves months
- —
- Total cash needed
- —
Loan-product check · same deal, 3 products live
Conventional
25% down · 7.5% · 30yr
- Down + closing
- —
- Monthly P&I
- —
- Monthly cashflow
- —
- DSCR
- —
- Eligible?
- —
Personal DTI + credit; lowest rate.
DSCR
20% down · 8.5% · 30yr
- Down + closing
- —
- Monthly P&I
- —
- Monthly cashflow
- —
- DSCR
- —
- Eligible?
- —
No personal income docs; deal must DSCR.
Hard money
10% down · 12.0% · 12mo
- Down + closing
- —
- Monthly P&I
- —
- Monthly cashflow
- —
- DSCR
- —
- Eligible?
- —
Short-term bridge; refi at stabilization.
Rent comps 3 comps
| Address | Beds | Baths | Sqft | Rent | $/sqft | DOM | Units | Dist |
|---|---|---|---|---|---|---|---|---|
| 1739 6th Ave Huntington, WV | 1.0–2.0 | 1.0 | 825 | $925 | $1.12 | 45d | 1 | 0.48mi |
| 2489 1st Ave Unit 101 A Huntington, WV | 1.0 | 1.0 | 750 | $925 | $1.23 | 45d | 1 | 0.84mi |
| 605 9th St Huntington, WV | 1.0 | 1.0 | 672 | $838 | $1.25 | 45d | 1 | 1.38mi |
Listing history 5 events
-
2026-06-02status $115,000 Pending 77 DOM
-
2026-06-01days on market $115,000 Active 77 DOM
-
2026-05-31days on market $115,000 Active 76 DOM
-
2026-05-30days on market $115,000 Active 75 DOM
-
2026-03-16$115,000 Active
ⓘ Source: listings_history table (triggers on properties + properties_extension) + one-shot
backfill from property_details.listing_events for pre-trigger history.
Tax reassessment forecast WV · Resets to sale price
- Current annual tax
- $324 · $27/mo
- Projected year-2 tax
- $678 · $57/mo
- Expected delta
- +$354/yr (+$30/mo · 109.3%)
ⓘ Screening estimate from a state-policy table — verify with the county assessor before closing.
Climate risk First Street
- Flood 6/10 Major FEMA zone X (unshaded) · 75% chance over 30 yrs
- Wildfire 2/10 Low
- Heat 5/10 Major 7 d/yr ≥102°F today · 19 d/yr by 30 yrs out
- Wind 2/10 Low 100% chance of damaging wind over 30 yrs
- Air quality 2/10 Low 0 unhealthy d/yr today · 1 by 30 yrs out
Nearby sold comps map
Loading sold comps map…
Walkable amenities ~0.75 mi
Loading nearby amenities…
Taxation est. · year 1
- Rental income
- $11,630
- − Mortgage interest
- −$6,442
- − Property taxes
- −$324
- − Insurance
- −$575
- − Repairs & maintenance
- −$930
- − Management
- −$930
- − Depreciation
- −$3,345
- Taxable loss
- −$917
- Est. tax savings @ 24.0%
- +$220
- After-tax cash flow
- $1,272/yr
For passive investors: Depreciation is non-cash, so a rental often shows a tax loss while cash-flowing — sheltering income. Rental losses are passive: they offset passive income freely, and up to $25,000/yr can offset ordinary (W-2) income if you actively participate and your MAGI is under $100k (phasing out to $0 by $150k); unused losses carry forward. On sale, claimed depreciation is recaptured at up to 25%, and gains may owe capital-gains tax (a 1031 exchange can defer both). Figures are a year-1 estimate at your 24.0% rate — not tax advice; consult a CPA.
Schools (NCES district)
- District
- Cabell County Schools
- NCES district ID
- 5400180
- Math proficiency
- 31% ▼ -7.00%
- Reading proficiency
- 42% ▼ -6.00%
- Median HH income
- $36,426
- Composite
- 30.26/100
- National rank
- #6285
- State rank
- #13 of 55 in WV
Livability — Huntington
- Score
- 79/100
- State rank
- #16
- US rank
- #2045
Category grades
Schools grade is shown separately in the Schools card above.
Census & demographics
- Census place
- Huntington, WV
- County
- Cabell County · 30,893 people
- City population
- 25,795
- Metro
- Huntington-Ashland, WV-KY-OH
- Population (ZIP)
- 4,598
- Household income
- $24,139
- Rent vs Own
- Severe rent burden
- 813.0
Population outlook (Cabell County) Hauer SSP2
- Today (2025)
- 97,574 people
- By 2030
- 98,060 · +0.5%
- By 2040
- 98,817 · +1.3%
- By 2050
- 100,185 · +2.7%
- By 2075
- 105,895 · +8.5%
- By 2100
- 105,948 · +8.6%
Race, ethnicity, and origin ACS 2023
- Neighborhood character
- Predominantly White (82%)
- Race & ethnicity
- White 82% Black 9% Two or more races 6% Asian 2% Hispanic / Latino 1%
- Common ancestry
- Slovak 3% Romanian 1% Lithuanian 1%
- Foreign-born
- 2% · Philippines, Canada, China
- Languages at home
- 98% English-only · Spanish 1%
Political lean MEDSL · Cabell
- 2024 margin
- Strong R (+21.9) · D 38.0% · R 59.9% · Other 2.0%
- 2008→2024 swing
- -11.8pp toward R · 2008: -10.1pp · 2024: -21.9pp
- All cycles
- 2024: R+21.9 2020: R+18.0 2016: R+25.5 2012: R+13.9 2008: R+10.1
Not yet ingested
- Civics
- —
Market trends
- HPI YoY
- ▲ 4.91%
- Current HPI
- 166.7429
- Rent YoY
- —
- Metro
- Huntington-Ashland, WV-KY-OH
- State GDP YoY
- —
- F500 in state
- 0
Price history
1 event — show timeline
- 2026-03-16 Listed $115,000 HBRMLS
Property tax history
+34.0%/yrLatest (2025): $324 · +10.3% YoY. Source: county tax records.
Cash-flow waterfall
monthlySold comps — $/sqft
last 12 mo · ≤1 miLoading sold comps…