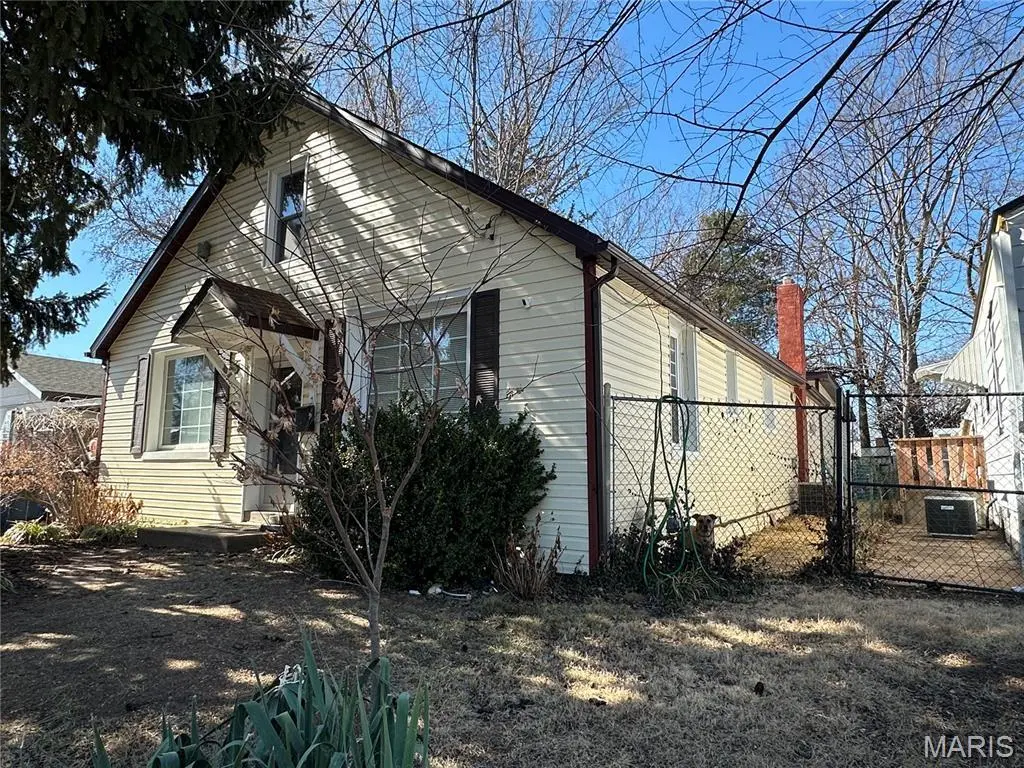
6255 Hancock Ave · Berkeley, MO
Flood risk 1/10 · Minimal
- FEMA flood zone
- X (unshaded)
- Chance of flooding over 30 yrs
- 0.0%
- Est. flood insurance / yr
- $507 – $1,088
Fire risk 1/10 · Minimal
- Est. fire insurance / yr
- $1,054 – $1,958
Heat risk 4/10 · Minor
- Hot days now (above 106°F)
- 7 days/yr
- Hot days in 30 yrs
- 21 days/yr
Wind risk 2/10 · Minimal
- Chance of severe wind over 30 yrs
- 1.0%
Air-quality risk 3/10 · Minor
- Unhealthy air days now
- 3 days/yr
- Unhealthy air days in 30 yrs
- 5 days/yr
Risk factors via First Street. Map © Google.
Why this score? — see what drove the B grade
The composite is a weighted blend of 9 inputs, each scored 0–100. Each bar is that input's sub-score; the figure is the points it added to the 100-point composite (weight × sub-score).
- Cash flow +30.0/30.0
- ARV discount +15.0/15.0
- 1% rule +10.0/10.0
- DSCR +10.0/10.0
- Rent growth +2.9/5.0
- Livability +2.7/5.0
- Condition / age +2.5/5.0
- Schools +1.2/10.0
- Appreciation +0.0/10.0
$69,900
🖨 Deal sheet (PDF) 📄 Offer letter ✓ Due diligence
Listing remarks MLS
2100 sq ft of living space! This would be a great rental or flip. Let's find this home a new owner. New Siding and soffit! Wood floors. Beautifully updated main bath. The furnace is 6 years old. Privacy Fence. Newer vinyl windows. The Roof is 10 years old. 6255 Hancock Ave is a diamond that still needs to be cut and polished. Please read agent-only notes. Please reach out for more details. I have a video I can share.
Key facts
- New siding
- Newer vinyl windows
- Wood floors
Tags
Neighborhood map
What this means for you Summary
Snapshot
- This is a 4-bed/1.0-bath single-family listed at $70k.
Deal economics
- At list price, monthly cash flow is $717 ($9k/yr) — positive.
- The deal already cash-flows at list — no discount required.
- Meets the 1% rule at list price ($2k rent vs $70k).
- Recommended offer: $66k (6.0% below list) — sets the bar for market timing.
- Cap rate 18.6% vs local median 9.9% in Berkeley — top-decile yield for the area; either an underpriced asset or a hidden risk that comps aren't pricing in. Stress-test before assuming the spread holds.
Location & tenants
- Location reads 54/100 on livability (#774 in MO) — a working-class tenant base; expect higher turnover. Strengths: cost of living A+, housing A; Watch: health & safety C-, crime F, amenities F.
- Ferguson-Florissant R-II (suburban): math 7% / reading 20% proficiency, ranked #311 of 324 in MO (top 96%) — low school quality limits family demand, transient renter base, plan for 1-2y turnover; 70% free/reduced lunch — lower-income household profile, screen leases tightly.
- Zoned schools: Johnson Wabash 6Th Grade Ctr (math 2% / reading 8%, grade F, #387 of 391 statewide, top 99%, 323 students, 99% FRL); Ferguson Middle (math 3% / reading 14%, grade F, #376 of 391 statewide, top 96%, 615 students, 100% FRL); Mccluer High (math 0% / reading 17%, grade F, #511 of 521 statewide, top 98%, 1,181 students, 100% FRL) — zoned schools average 99% FRL vs 70% district-wide (30 pts higher); higher-poverty schools than district average — tighter screening recommended.
- Market conditions: Rents rising (+1.6%/yr); 71 active listings in the ZIP; 17 comparable units currently listed for rent nearby; rentals at typical pace (median 25d on market — plan ~3-4 weeks tenant-placement turnaround); lower-income renter base — watch delinquency; 920 units permitted in St. Louis County in 2024 (250 in 5+ unit buildings).
- This rent runs 40% of the median local income ($45k/yr) — at the standard rent-burdened threshold; future hikes will face affordability resistance.
Forward outlook
- Local home prices are declining (-3.0%/yr); year-one equity from $483 of loan paydown is wiped out by about $2k of value loss. Plan a longer hold.
- At projected returns (-3.0% appreciation + 1.6% rent growth), your $20k cash investment doubles in ~3 years — after that, you're playing with house money.
Negotiation context
- It's been on market 82 days — a 6% lower offer ($66k) is reasonable based on typical stale-listing flexibility.
Risks & watch-outs
- Watch-outs: built in 1949 — expect roof / HVAC / electrical / plumbing capex.
Questions for the listing agent
- It's been on market 82 days. Have you received any prior offers? Is the seller open to a 6% concession, seller financing, or rate buy-down credit?
- Built in 1949 — when were the roof, HVAC, electrical panel, plumbing, and water heater last replaced?
- Why hasn't it sold? Are there any deal-killer items the seller is aware of (foundation, flood, title, zoning, code violations)?
- Is there a deadline driving the sale (1031 exchange, divorce, estate, relocation)? That informs how much negotiation room exists.
- Schools are F-rated, which usually means shorter tenancies and higher turnover. Who's the typical renter profile here, and what's been the actual vacancy rate?
- Crime grade is F in this area — have there been break-ins, vandalism, or insurance claims at this property in the last 3 years? What carrier currently insures it and at what premium?
- What's the average days-on-market for RENTAL listings here right now (not sales)? A rising rental-DOM trend means longer vacancies and softer asking-rent achievability than the comps imply.
- What's the recent tenant-quality profile in this submarket — average credit score on applications, eviction rate, late-payment / NSF rate, and stable-employment percentage? A property-management company in the area should have these aggregated.
- How much new for-sale + rental construction is in the pipeline within 1–3 miles? Heavy new supply typically softens prices + rents 12–24 months out; constrained supply supports both.
Investment metrics
- 1% rule
- 2.15% ✓
- Cap rate
- 18.60%
- Cash-on-cash
- 43.94%
- DSCR
- 2.96
- GRM
- 3.9
CMA / ARV
- ARV (median comp)
- $139,756
- List price
- $69,900
- Delta
- -46.33%
- Verdict
- UNDERPRICED
- Comps
- 20 within 1.0 mi
Show comp detail 12 sales within ~0.75 mi
| Address | Dist | Beds/Ba | Sqft | Sold | Price | $/sf | Match |
|---|---|---|---|---|---|---|---|
| 8408 Buckthorn Dr | 0.32mi | 4/2.0 | 1,648 (+5%) | 10mo | $89,900 | $55 | 65 |
| 6239 Evergreen Blvd | 0.06mi | 3/2.0 (-1) | 1,469 (-7%) | 19mo | $75,000 | $51 | 61 |
| 6539 Alder Ave | 0.46mi | 3/2.0 (-1) | 1,588 (+1%) | 13mo | $64,000 | $40 | 58 |
| 6701 Alder Ave | 0.61mi | 4/1.5 | 1,536 (-2%) | 10mo | $145,400 | $95 | 57 |
| 6515 Alder Ave | 0.41mi | 4/1.5 | 1,498 (-5%) | 19mo | $129,950 | $87 | 55 |
| 8340 Pepperidge Dr | 0.41mi | 3/2.0 (-1) | 1,540 (-2%) | 16mo | $75,000 | $49 | 55 |
| 6136 Jefferson Ave | 0.31mi | 3/1.0 (-1) | 1,389 (-12%) | 8mo | $85,000 | $61 | 54 |
| 6612 Bitteroot Ln | 0.45mi | 3/2.0 (-1) | 1,488 (-6%) | 20mo | $105,000 | $71 | 44 |
| 6706 Alder Ave | 0.62mi | 3/2.0 (-1) | 1,428 (-9%) | 3mo | $155,500 | $109 | 44 |
| 8531 Midwood Ave | 0.57mi | 3/2.0 (-1) | 1,468 (-7%) | 15mo | $154,900 | $106 | 40 |
| 8018 Aline Ave | 0.66mi | 3/2.0 (-1) | 1,445 (-8%) | 19mo | $114,900 | $80 | 30 |
| 6616 Dunwold Dr | 0.71mi | 3/2.0 (-1) | 1,348 (-14%) | 8mo | $155,000 | $115 | 27 |
Match score weights: distance 35% · size 25% · config 20% · recency 20%. Top-matched comps best support the ARV.
Projected returns pro-forma
-3.0% appreciation · 1.61% rent growth · sell at horizon
- IRR
- 39.3%
- Equity multiple
- 2.65×
- Total profit
- $32,259
- Equity at exit
- $10,422
- IRR
- 45.0%
- Equity multiple
- 5.02×
- Total profit
- $78,649
- Equity at exit
- $6,044
Cash invested: $19,572 (down + closing). Projections, not guarantees.
Landlord ↔ Tenant lean methodology
- Overall (STATE)
- 81 Strongly Landlord-Friendly
- State Missouri
- 81 Strongly Landlord-Friendly · R+10
- County
- — inherits STATE
- City
- — inherits STATE
ZIP-level market 63134
- Rents YoY
- 1.6%
- Active inventory
- 71
- Price-to-rent
- 3.9×
Monthly cashflow live
- Estimated rent
- $1,505 high interval (Pro) →
- Mortgage (P&I)
- −$367
- Tax from tax record
- −$76 /mo · $915/yr
- Insurance
- −$29
- HOA
- −$0
- Vacancy / Maint / Mgmt
- −$316
- Net cashflow
- $717
Break-even live
Sensitivity live
| Price | -10% $756 | -5% $736 | +0% $717 | +5% $697 | +10% $677 |
|---|---|---|---|---|---|
| Rent | -10% $598 | -5% $657 | +0% $717 | +5% $776 | +10% $836 |
| Rate | -1.0pp $752 | -0.5pp $734 | base $717 | +0.5pp $699 | +1.0pp $680 |
UW: 25.0% down · 7.5% · 30yr · 1.5% tax · 5.0% vac · 8.0% maint · 8.0% mgmt
Financing live
Cash to close
- Down payment
- $17,475
- Closing costs
- $2,097
- Reserves months
- —
- Total cash needed
- —
Loan-product check · same deal, 3 products live
Conventional
25% down · 7.5% · 30yr
- Down + closing
- —
- Monthly P&I
- —
- Monthly cashflow
- —
- DSCR
- —
- Eligible?
- —
Personal DTI + credit; lowest rate.
DSCR
20% down · 8.5% · 30yr
- Down + closing
- —
- Monthly P&I
- —
- Monthly cashflow
- —
- DSCR
- —
- Eligible?
- —
No personal income docs; deal must DSCR.
Hard money
10% down · 12.0% · 12mo
- Down + closing
- —
- Monthly P&I
- —
- Monthly cashflow
- —
- DSCR
- —
- Eligible?
- —
Short-term bridge; refi at stabilization.
Rent comps 17 comps
| Address | Beds | Baths | Sqft | Rent | $/sqft | DOM | Units | Dist |
|---|---|---|---|---|---|---|---|---|
| 8439 Alder Ave Saint Louis, MO | 3.0 | 1.5 | 1176 | $1,425 | $1.21 | 25d | 1 | 0.32mi |
| 6452 Evergreen Blvd Saint Louis, MO | 3.0 | 2.0 | 1288 | $1,500 | $1.16 | 25d | 1 | 0.35mi |
| 8437 January Ave Saint Louis, MO | 3.0 | 2.0 | 1288 | $1,350 | $1.05 | 45d | 1 | 0.46mi |
| 8418 Bayberry Dr Saint Louis, MO | 3.0 | 2.0 | 1288 | $1,350 | $1.05 | 23d | 1 | 0.59mi |
| 6698 Amora Ave Berkeley, MO | 2.0–3.0 | 1.5 | 1625 | $1,500 | $0.92 | 45d | 1 | 0.63mi |
| 8412 Chalons Ct Saint Louis, MO | 3.0 | 1.0 | 1380 | $1,370 | $0.99 | 25d | 1 | 0.75mi |
| 8330 Woodhurst Dr Saint Louis, MO | 3.0 | 1.0 | 1120 | $1,000 | $0.89 | 9d | 1 | 0.77mi |
| 8330 Woodhurst Dr Saint Louis, MO | 3.0 | 1.0 | 1120 | $1,000 | $0.89 | 0d | 1 | 0.77mi |
| 6867 Thurston Ave Saint Louis, MO | 3.0 | 2.0 | 1243 | $1,580 | $1.27 | 45d | 1 | 0.97mi |
| 260 Sadonia Ave Saint Louis, MO | 3.0 | 2.0 | 1088 | $1,623 | $1.49 | 22d | 1 | 1.11mi |
| 153 Bascom Dr Saint Louis, MO | 3.0 | 1.0 | 1076 | $1,195 | $1.11 | 21d | 1 | 1.18mi |
| 1131 N Florissant Rd Saint Louis, MO | 3.0 | 1.0 | 1580 | $1,390 | $0.88 | 25d | 1 | 1.28mi |
| 1131 N Florissant Rd Saint Louis, MO | 3.0 | 1.0 | 1580 | $1,390 | $0.88 | 0d | 1 | 1.28mi |
| 324 Emmett Ave Saint Louis, MO | 3.0 | 2.0 | 1357 | $1,650 | $1.22 | 25d | 1 | 1.36mi |
| 406 Tiffin Ave Ferguson, MO | 4.0 | 1.0 | 1888 | $1,525 | $0.81 | 45d | 1 | 1.40mi |
| 265 S Harvey Ave Saint Louis, MO | 3.0 | 1.5 | 1240 | $1,350 | $1.09 | 45d | 1 | 1.42mi |
| 11 Anistasia Dr Saint Louis, MO | 3.0 | 1.5 | 1120 | $1,345 | $1.20 | 25d | 1 | 1.46mi |
Listing history 19 events
-
2026-06-22price $69,900 Active 82 DOM
-
2026-06-21days on market $75,000 Active 82 DOM
-
2026-06-18days on market $75,000 Active 79 DOM
-
2026-06-17days on market $75,000 Active 78 DOM
-
2026-06-16days on market $75,000 Active 77 DOM
-
2026-06-15days on market $75,000 Active 76 DOM
-
2026-06-13days on market $75,000 Active 74 DOM
-
2026-06-13days on market $75,000 Active 73 DOM
-
2026-06-09days on market $75,000 Active 70 DOM
-
2026-06-08days on market $75,000 Active 69 DOM
-
2026-06-07days on market $75,000 Active 68 DOM
-
2026-06-05days on market $75,000 Active 65 DOM
-
2026-06-03days on market $75,000 Active 64 DOM
-
2026-06-02days on market $75,000 Active 63 DOM
-
2026-06-01days on market $75,000 Active 62 DOM
-
2026-05-31days on market $75,000 Active 61 DOM
-
2026-04-29price $75,000 420-char remark
Show marketing remark (420 chars)
2100 sq ft of living space! This would be a great rental or flip. Let's find this home a new owner. New Siding and soffit! Wood floors. Beautifully updated main bath. The furnace is 6 years old. Privacy Fence. Newer vinyl windows. The Roof is 10 years old. 6255 Hancock Ave is a diamond that still needs to be cut and polished. Please read agent-only notes. Please reach out for more details. I have a video I can share.
-
2026-04-10price $90,000 420-char remark
Show marketing remark (420 chars)
2100 sq ft of living space! This would be a great rental or flip. Let's find this home a new owner. New Siding and soffit! Wood floors. Beautifully updated main bath. The furnace is 6 years old. Privacy Fence. Newer vinyl windows. The Roof is 10 years old. 6255 Hancock Ave is a diamond that still needs to be cut and polished. Please read agent-only notes. Please reach out for more details. I have a video I can share.
-
2026-03-31$97,500 Active 420-char remark
Show marketing remark (420 chars)
2100 sq ft of living space! This would be a great rental or flip. Let's find this home a new owner. New Siding and soffit! Wood floors. Beautifully updated main bath. The furnace is 6 years old. Privacy Fence. Newer vinyl windows. The Roof is 10 years old. 6255 Hancock Ave is a diamond that still needs to be cut and polished. Please read agent-only notes. Please reach out for more details. I have a video I can share.
ⓘ Source: listings_history table (triggers on properties + properties_extension) + one-shot
backfill from property_details.listing_events for pre-trigger history.
Tax reassessment forecast MO · Resets to sale price
- Current annual tax
- $915 · $76/mo
- Projected year-2 tax
- $915 · $76/mo
- Expected delta
- $0/yr ($0/mo · 0.0%)
ⓘ Screening estimate from a state-policy table — verify with the county assessor before closing.
Climate risk First Street
- Flood 1/10 Low FEMA zone X (unshaded) · 0% chance over 30 yrs
- Wildfire 1/10 Low
- Heat 4/10 Moderate 7 d/yr ≥106°F today · 21 d/yr by 30 yrs out
- Wind 2/10 Low 100% chance of damaging wind over 30 yrs
- Air quality 3/10 Moderate 3 unhealthy d/yr today · 5 by 30 yrs out
Nearby sold comps map
Loading sold comps map…
Walkable amenities ~0.75 mi
Loading nearby amenities…
Taxation est. · year 1
- Rental income
- $18,055
- − Mortgage interest
- −$3,915
- − Property taxes
- −$915
- − Insurance
- −$350
- − Repairs & maintenance
- −$1,444
- − Management
- −$1,444
- − Depreciation
- −$2,033
- Taxable income
- $7,953
- Est. tax owed @ 24.0%
- −$1,909
- After-tax cash flow
- $6,691/yr
For passive investors: Depreciation is non-cash, so a rental often shows a tax loss while cash-flowing — sheltering income. Rental losses are passive: they offset passive income freely, and up to $25,000/yr can offset ordinary (W-2) income if you actively participate and your MAGI is under $100k (phasing out to $0 by $150k); unused losses carry forward. On sale, claimed depreciation is recaptured at up to 25%, and gains may owe capital-gains tax (a 1031 exchange can defer both). Figures are a year-1 estimate at your 24.0% rate — not tax advice; consult a CPA.
Schools (NCES district)
- District
- Ferguson-Florissant R-II
- NCES district ID
- 2912010
- Math proficiency
- 7% ▼ -9.00%
- Reading proficiency
- 20% ▼ -6.00%
- Median HH income
- $44,610
- Composite
- 11.96/100
- National rank
- #9666
- State rank
- #311 of 324 in MO
Livability — Berkeley
- Score
- 54/100
- State rank
- #774
- US rank
- #23800
Category grades
Schools grade is shown separately in the Schools card above.
Census & demographics
- Census place
- Berkeley, MO
- County
- Saint Louis County · 888,823 people
- City population
- 13,059
- Metro
- St. Louis, MO-IL
- Population (ZIP)
- 13,059
- Household income
- $44,680
- Rent vs Own
- Severe rent burden
- 655.0
Population outlook (St. Louis County) Hauer SSP2
- Today (2025)
- 1,025,227 people
- By 2030
- 1,028,023 · +0.3%
- By 2040
- 1,020,940 · -0.4%
- By 2050
- 1,007,280 · -1.8%
- By 2075
- 987,277 · -3.7%
- By 2100
- 921,984 · -10.1%
Race, ethnicity, and origin ACS 2023
- Neighborhood character
- Predominantly Black (66%)
- Race & ethnicity
- Black 66% White 17% Hispanic / Latino 13% Two or more races 7%
- Hispanic origin (detail)
- Mexican 8%
- Common ancestry
- Lithuanian 1%
- Foreign-born
- 6% · Canada
- Languages at home
- 86% English-only · Spanish 11%
Political lean MEDSL · St. Louis
- 2024 margin
- Strong D (+23.4) · D 60.8% · R 37.4% · Other 1.7%
- 2008→2024 swing
- +3.5pp toward D · 2008: 19.9pp · 2024: 23.4pp
- All cycles
- 2024: D+23.4 2020: D+24.0 2016: D+16.2 2012: D+13.7 2008: D+19.9
Not yet ingested
- Civics
- —
Market trends
- HPI YoY
- ▼ -164.02%
- Current HPI
- 226.9524
- Rent YoY
- ▲ 1.61%
- Metro
- St. Louis, MO-IL
- State GDP YoY
- ▲ 1.84%
- F500 in state
- 20
Industry mix (Fortune 500 HQ in MO)
| Industry | F500 HQs | Revenue |
|---|---|---|
| Healthcare | 1 | $163B |
|
||
| Insurance | 1 | $21B |
|
||
| Industrial Technology | 1 | $17B |
|
||
| Retail | 1 | $16B |
|
||
| Industrial Distribution | 1 | $10B |
|
||
| Utilities | 1 | $9B |
|
||
Price history
-23.1% since first listed3 events — show timeline
- 2026-04-29 Price Changed $75,000 MARIS as Distributed by MLS Grid
- 2026-04-10 Price Changed $90,000 MARIS as Distributed by MLS Grid
- 2026-03-31 Listed $97,500 MARIS as Distributed by MLS Grid
Property tax history
+7.1%/yrLatest (2022): $915 · +0.7% YoY. Source: county tax records.
Cash-flow waterfall
monthlySold comps — $/sqft
last 12 mo · ≤1 miLoading sold comps…