 🏷️ Likely Rental
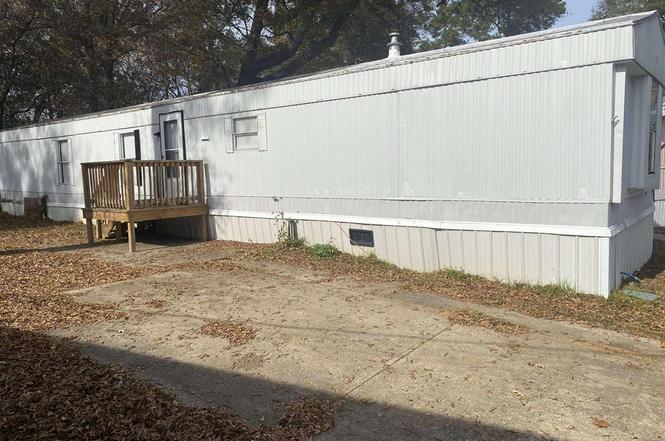
3110 Victory Dr #2036 · Columbus, GA
Flood risk No data
- FEMA flood zone
- —
- Chance of flooding over 30 yrs
- —
- Est. flood insurance / yr
- —
Fire risk No data
- Est. fire insurance / yr
- —
Heat risk No data
- Hot days now (above threshold)
- —
- Hot days in 30 yrs
- —
Wind risk No data
- Chance of severe wind over 30 yrs
- —
Air-quality risk No data
- Unhealthy air days now
- —
- Unhealthy air days in 30 yrs
- —
Risk factors via First Street. Map © Google.
Why this score? — see what drove the D grade
The composite is a weighted blend of 9 inputs, each scored 0–100. Each bar is that input's sub-score; the figure is the points it added to the 100-point composite (weight × sub-score).
- Cash flow +15.0/30.0
- ARV discount +7.5/15.0
- 1% rule +5.0/10.0
- DSCR +5.0/10.0
- Livability +3.2/5.0
- Rent growth +3.0/5.0
- Condition / age +2.5/5.0
- Schools +2.2/10.0
- Appreciation +0.0/10.0
$10,000
🖨 Deal sheet 📄 Offer letter ✓ Due diligence
Listing remarks
This updated home offers a clean and comfortable interior with fresh paint, vinyl plank flooring, and updated lighting throughout. The open living and dining area leads into a practical kitchen with stainless steel appliances, painted cabinets, and a tile backsplash. The split floorplan provides added privacy, with a spacious primary suite featuring sliding double doors and a large bathroom with a garden tub, separate shower, and updated vanity. The second bedroom is on the opposite end of the home with its own full bath nearby. The home also includes an indoor laundry nook with shelving, a small front deck, a level lot, and a concrete parking area. Move-in ready and low-maintenance, this p
Key facts
- Split floorplan
- Primary suite
- Vinyl plank flooring
Tags
Property features AI
Finance
- Other: Directions provided to the property
Exterior
- Utilities: Public water; Public sewer
- Home design: Single-family residential; Residential property
- Construction: Aluminum siding
Interior
- Kitchen: Electric range
- Bathrooms: 2 full bathrooms
- Heating & cooling: Electric heating; Cooling with ceiling fan(s)
- Interior features: Ceiling fans
- Laundry & utility: Dedicated laundry room
Neighborhood map
What this means for you Summary
Snapshot
- This is a 2-bed/2.0-bath single-family listed at $10k.
Deal economics
- At list price, monthly cash flow is $688 ($8k/yr) — positive.
- The deal already cash-flows at list — no discount required.
- Meets the 1% rule at list price ($959 rent vs $10k).
- Recommended offer: $9k (9.0% below list) — sets the bar for market timing.
- Cap rate 88.9% vs local median 4.7% in Columbus — top-decile yield for the area; either an underpriced asset or a hidden risk that comps aren't pricing in. Stress-test before assuming the spread holds.
Location & tenants
- Location reads 64/100 on livability (#254 in GA) — a middle-class / working-renter tenant base. Strengths: cost of living A+, housing A+, health & safety B; Watch: amenities D+, schools F, crime F.
- Muscogee County (urban): math 21% / reading 30% proficiency, ranked #120 of 174 in GA (top 69%) — low school quality limits family demand, transient renter base, plan for 1-2y turnover; 61% free/reduced lunch — lower-income household profile, screen leases tightly.
- Market conditions: Rents rising (+1.8%/yr); 100 active listings in the ZIP; 12 comparable units currently listed for rent nearby; rentals leasing fast (median 14d on market — plan ~1-2 weeks tenant-placement turnaround); lower-income renter base — watch delinquency; 291 units permitted in Muscogee County in 2024 (30 in 5+ unit buildings).
- This rent runs 36% of the median local income ($32k/yr) — at the standard rent-burdened threshold; future hikes will face affordability resistance.
Forward outlook
- Local home prices are declining (-3.0%/yr); year-one equity from $69 of loan paydown is wiped out by about $300 of value loss. Plan a longer hold.
- Muscogee County population projected at +15% by 2050 — modest demand growth; plan on rents tracking national, not racing it.
- At projected returns (-3.0% appreciation + 1.8% rent growth), your $3k cash investment doubles in ~1 year — after that, you're playing with house money.
Negotiation context
- It's been on market 99 days — a 9% lower offer ($9k) is reasonable based on typical stale-listing flexibility.
- 2 sale attempts; this cycle's ask has dropped $2k (17%) from the opening price — seller is motivated, your offer sets the floor, not the list.
Questions for the listing agent
- It's been on market 99 days. Have you received any prior offers? Is the seller open to a 9% concession, seller financing, or rate buy-down credit?
- Why hasn't it sold? Are there any deal-killer items the seller is aware of (foundation, flood, title, zoning, code violations)?
- Is there a deadline driving the sale (1031 exchange, divorce, estate, relocation)? That informs how much negotiation room exists.
- Schools are F-rated, which usually means shorter tenancies and higher turnover. Who's the typical renter profile here, and what's been the actual vacancy rate?
- Crime grade is F in this area — have there been break-ins, vandalism, or insurance claims at this property in the last 3 years? What carrier currently insures it and at what premium?
- The area grade is low — what's the realistic commute time and amenity access for the typical tenant pool here? Any planned neighborhood developments (good or bad) we should know about?
- What's the average days-on-market for RENTAL listings here right now (not sales)? A rising rental-DOM trend means longer vacancies and softer asking-rent achievability than the comps imply.
- What's the recent tenant-quality profile in this submarket — average credit score on applications, eviction rate, late-payment / NSF rate, and stable-employment percentage? A property-management company in the area should have these aggregated.
- How much new for-sale + rental construction is in the pipeline within 1–3 miles? Heavy new supply typically softens prices + rents 12–24 months out; constrained supply supports both.
Investment metrics
- 1% rule
- 9.59% ✓
- Cap rate
- 88.88%
- Cash-on-cash
- 294.96%
- DSCR
- 14.12
- GRM
- 0.9
CMA / ARV
- ARV (on-the-fly)
- $139,000
- Comps found
- 9
Show comp detail 9 sales within ~0.75 mi
| Address | Dist | Beds/Ba | Sqft | Sold | Price | $/sf | Match |
|---|---|---|---|---|---|---|---|
| 3110 Victory Dr | 0.14mi | 3/2.0 (+1) | 1,000 (0%) | 3mo | $12,000 | $12 | 86 |
| 2916 Lee St | 0.68mi | 2/1.0 | 1,021 (+2%) | 2mo | $42,000 | $41 | 59 |
| 184 30th Ave | 0.54mi | 3/1.0 (+1) | 961 (-4%) | 7mo | $105,000 | $109 | 53 |
| 270 32nd Ave | 0.72mi | 2/1.0 | 1,053 (+5%) | 3mo | $19,900 | $19 | 51 |
| 2463 Brownie Dr | 0.56mi | 3/2.0 (+1) | 1,137 (+14%) | 6mo | $170,000 | $150 | 41 |
| 1229 SW Elliotts Ave | 0.50mi | 3/2.0 (+1) | 1,137 (+14%) | 15mo | $157,810 | $139 | 36 |
| 1240 Elliotts Ave | 0.53mi | 3/2.0 (+1) | 1,137 (+14%) | 15mo | $157,810 | $139 | 35 |
| 1257 Elliotts Ave | 0.50mi | 3/2.0 (+1) | 1,137 (+14%) | 24mo | $157,810 | $139 | 29 |
| 1291 Providence Ln | 0.56mi | 3/2.0 (+1) | 1,137 (+14%) | 22mo | $158,000 | $139 | 28 |
Match score weights: distance 35% · size 25% · config 20% · recency 20%. Top-matched comps best support the ARV.
Projected returns pro-forma
-3.0% appreciation · 1.82% rent growth · sell at horizon
- IRR
- —
- Equity multiple
- 15.68×
- Total profit
- $41,103
- Equity at exit
- $1,491
- IRR
- —
- Equity multiple
- 32.35×
- Total profit
- $87,787
- Equity at exit
- $865
Cash invested: $2,800 (down + closing). Projections, not guarantees.
Landlord ↔ Tenant lean methodology
- Overall (STATE)
- 90 Strongly Landlord-Friendly
- State Georgia
- 90 Strongly Landlord-Friendly · R+3
- County
- — inherits STATE
- City
- — inherits STATE
ZIP-level market 31903
- Home prices YoY
- -14.5%
- Rents YoY
- 1.8%
- Active inventory
- 100
- Price-to-rent
- 0.9×
Monthly cashflow live
- Estimated rent
- $959 high interval (Pro) →
- Mortgage (P&I)
- −$52
- Tax est. 1.5%
- −$12 /mo · $150/yr
- Insurance
- −$4
- HOA
- −$0
- Vacancy / Maint / Mgmt
- −$201
- Net cashflow
- $688
Break-even live
UW: 25.0% down · 7.5% · 30yr · 1.5% tax · 5.0% vac · 8.0% maint · 8.0% mgmt
Financing live
Cash to close
- Down payment
- $2,500
- Closing costs
- $300
- Reserves months
- —
- Total cash needed
- —
Loan-product check · same deal, 3 products live
Conventional
25% down · 7.5% · 30yr
- Down + closing
- —
- Monthly P&I
- —
- Monthly cashflow
- —
- DSCR
- —
- Eligible?
- —
Personal DTI + credit; lowest rate.
DSCR
20% down · 8.5% · 30yr
- Down + closing
- —
- Monthly P&I
- —
- Monthly cashflow
- —
- DSCR
- —
- Eligible?
- —
No personal income docs; deal must DSCR.
Hard money
10% down · 12.0% · 12mo
- Down + closing
- —
- Monthly P&I
- —
- Monthly cashflow
- —
- DSCR
- —
- Eligible?
- —
Short-term bridge; refi at stabilization.
Rent comps 12 comps
| Address | Beds | Baths | Sqft | Rent | $/sqft | DOM | Units | Dist |
|---|---|---|---|---|---|---|---|---|
| 3390 N Lumpkin Rd Columbus, GA | 2.0–3.0 | 2.0 | 1073 | $999 | $0.93 | 13d | 14 | 0.37mi |
| 3320 N Lumpkin Rd Columbus, GA | 2.0–3.0 | 2.0 | 1098 | $999 | $0.91 | 13d | 8 | 0.38mi |
| 3213 Lee St Unit 3 Columbus, GA | 2.0 | 1.0 | 1100 | $925 | $0.84 | 13d | 1 | 0.79mi |
| 1048 Brooks Rd Columbus, GA | 2.0 | 1.0 | 942 | $925 | $0.98 | 21d | 1 | 0.87mi |
| 2106 S Andrews Cir Unit A Columbus, GA | 1.0 | 1.0 | 700 | $575 | $0.82 | 13d | 1 | 0.89mi |
| 2829 Ramsey Rd Columbus, GA | 3.0 | 1.0 | 1252 | $1,100 | $0.88 | 13d | 1 | 0.90mi |
| 2885 Ramsey Rd Columbus, GA | 3.0 | 2.0 | 1290 | $1,075 | $0.83 | 13d | 1 | 0.94mi |
| 2602 Garden Dr Columbus, GA | 3.0 | 2.0 | 1250 | $1,175 | $0.94 | 21d | 1 | 0.97mi |
| 2630 Garden Dr Columbus, GA | 2.0 | 1.0 | 1008 | $755 | $0.75 | 43d | 1 | 0.98mi |
| 1206 Winston Rd Columbus, GA | 2.0 | 1.0 | 868 | $750 | $0.86 | 43d | 1 | 1.03mi |
| 3909 Baker Plaza Dr Columbus, GA | 1.0–2.0 | 1.0–2.0 | 869 | $1,010 | $1.16 | 13d | 1 | 1.38mi |
| 2051 Somerset Ave Columbus, GA | 3.0 | 1.0 | 1092 | $1,100 | $1.01 | 43d | 1 | 1.38mi |
Listing history 22 events
-
2026-06-18days on market $10,000 Active 99 DOM
-
2026-06-17days on market $10,000 Active 98 DOM
-
2026-06-16days on market $10,000 Active 97 DOM
-
2026-06-15days on market $10,000 Active 96 DOM
-
2026-06-14days on market $10,000 Active 94 DOM
-
2026-06-13days on market $10,000 Active 93 DOM
-
2026-06-10days on market $10,000 Active 91 DOM
-
2026-06-09days on market $10,000 Active 90 DOM
-
2026-06-08days on market $10,000 Active 89 DOM
-
2026-06-07days on market $10,000 Active 88 DOM
-
2026-06-05days on market $10,000 Active 85 DOM
-
2026-06-03days on market $10,000 Active 84 DOM
-
2026-06-02days on market $10,000 Active 83 DOM
-
2026-06-01days on market $10,000 Active 82 DOM
-
2026-05-31days on market $10,000 Active 81 DOM
-
2026-05-30days on market $10,000 Active 80 DOM
-
2026-04-29status Pending
-
2026-04-23$12,000 Active
-
2026-03-10soldstatus Closed
-
2026-02-06status Pending
-
2026-02-02price $12,000
-
2025-11-20$35,000 Active
ⓘ Source: listings_history table (triggers on properties + properties_extension) + one-shot
backfill from property_details.listing_events for pre-trigger history.
Nearby sold comps map
Loading sold comps map…
Walkable amenities ~0.75 mi
Loading nearby amenities…
Taxation est. · year 1
- Rental income
- $11,504
- − Mortgage interest
- −$560
- − Property taxes
- −$150
- − Insurance
- −$50
- − Repairs & maintenance
- −$920
- − Management
- −$920
- − Depreciation
- −$291
- Taxable income
- $8,612
- Est. tax owed @ 24.0%
- −$2,067
- After-tax cash flow
- $6,192/yr
For passive investors: Depreciation is non-cash, so a rental often shows a tax loss while cash-flowing — sheltering income. Rental losses are passive: they offset passive income freely, and up to $25,000/yr can offset ordinary (W-2) income if you actively participate and your MAGI is under $100k (phasing out to $0 by $150k); unused losses carry forward. On sale, claimed depreciation is recaptured at up to 25%, and gains may owe capital-gains tax (a 1031 exchange can defer both). Figures are a year-1 estimate at your 24.0% rate — not tax advice; consult a CPA.
Schools (NCES district)
- District
- Muscogee County
- NCES district ID
- 1303870
- Math proficiency
- 21% ▼ -11.00%
- Reading proficiency
- 30% ▼ -7.00%
- Median HH income
- $41,176
- Composite
- 21.6/100
- National rank
- #8297
- State rank
- #120 of 174 in GA
Livability — Columbus
- Score
- 64/100
- State rank
- #254
- US rank
- #14102
Category grades
Schools grade is shown separately in the Schools card above.
Census & demographics
- Census place
- Columbus, GA
- County
- Muscogee County · 180,764 people
- City population
- 180,764
- Metro
- Columbus, GA-AL
- Population (ZIP)
- 20,644
- Household income
- $32,401
- Rent vs Own
- Severe rent burden
- 1878.0
Population outlook (Muscogee County) Hauer SSP2
- Today (2025)
- 216,729 people
- By 2030
- 224,504 · +3.6%
- By 2040
- 238,318 · +10.0%
- By 2050
- 249,027 · +14.9%
- By 2075
- 264,862 · +22.2%
- By 2100
- 254,786 · +17.6%
Race, ethnicity, and origin ACS 2023
- Neighborhood character
- Predominantly Black (77%)
- Race & ethnicity
- Black 77% Hispanic / Latino 11% White 9% Two or more races 3% Asian 1%
- Hispanic origin (detail)
- Mexican 6% Puerto Rican 2%
- Foreign-born
- 6% · Canada
- Languages at home
- 88% English-only · Spanish 10% Other Indo-European 1%
Political lean MEDSL · Muscogee
- 2024 margin
- Strong D (+23.4) · D 61.4% · R 38.0%
- 2008→2024 swing
- +3.7pp toward D · 2008: 19.7pp · 2024: 23.4pp
- All cycles
- 2024: D+23.4 2020: D+24.0 2016: D+18.6 2012: D+21.3 2008: D+19.7
Not yet ingested
- Civics
- —
Market trends
- HPI YoY
- ▼ -22.30%
- Current HPI
- 131.4761
- Rent YoY
- ▲ 1.82%
- Metro
- Columbus, GA-AL
- State GDP YoY
- ▲ 2.66%
- F500 in state
- 28
Industry mix (Fortune 500 HQ in GA)
| Industry | F500 HQs | Revenue |
|---|---|---|
| Paper / Packaging | 2 | $29B |
|
||
| Retail | 1 | $160B |
|
||
| Transportation / Logistics | 1 | $91B |
|
||
| Airlines | 1 | $62B |
|
||
| Consumer Goods | 1 | $47B |
|
||
| Utilities | 1 | $25B |
|
||
Price history
-65.7% since first listed6 events — show timeline
- 2026-04-29 Pending — CBOR
- 2026-04-23 Listed $12,000 CBOR
- 2026-03-10 Sold (MLS) — CBOR
- 2026-02-06 Pending — CBOR
- 2026-02-02 Price Changed $12,000 CBOR
- 2025-11-20 Listed $35,000 CBOR
Cash-flow waterfall
monthlySold comps — $/sqft
last 12 mo · ≤1 miLoading sold comps…