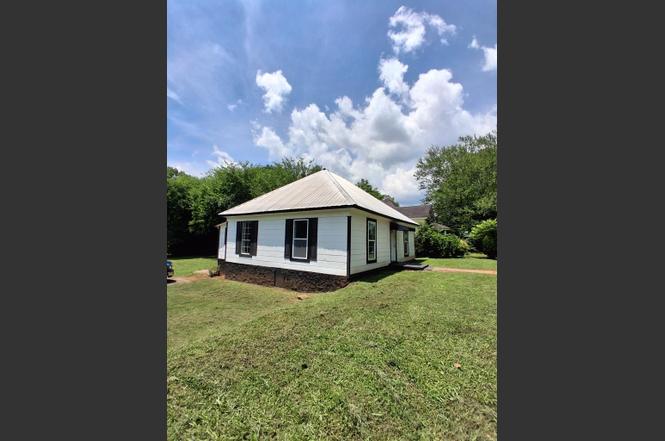
210 E 14th St St SW · Rome, GA
Flood risk 1/10 · Minimal
- FEMA flood zone
- X (unshaded)
- Chance of flooding over 30 yrs
- 0.0%
- Est. flood insurance / yr
- $507 – $1,088
Fire risk 3/10 · Minor
- Est. fire insurance / yr
- $963 – $1,789
Heat risk 6/10 · Moderate
- Hot days now (above 104°F)
- 7 days/yr
- Hot days in 30 yrs
- 21 days/yr
Wind risk 4/10 · Minor
- Chance of severe wind over 30 yrs
- 18.0%
Air-quality risk 2/10 · Minimal
- Unhealthy air days now
- 2 days/yr
- Unhealthy air days in 30 yrs
- 2 days/yr
Risk factors via First Street. Map © Google.
Why this score? — see what drove the C grade
The composite is a weighted blend of 9 inputs, each scored 0–100. Each bar is that input's sub-score; the figure is the points it added to the 100-point composite (weight × sub-score).
- Cash flow +19.5/30.0
- ARV discount +14.9/15.0
- DSCR +6.1/10.0
- 1% rule +4.3/10.0
- Rent growth +4.1/5.0
- Livability +3.2/5.0
- Condition / age +2.5/5.0
- Schools +2.3/10.0
- Appreciation +0.0/10.0
$149,000
🖨 Deal sheet 📄 Offer letter ✓ Due diligence
Listing remarks MLS
Seller is motivated! Are you looking into getting into income producing rentals or adding to your current portfolio? Then this property would be a good one to do that with. Steady tenant already in place. Property does need some TLC, but the price does reflect that. Schedule your appointment today.
Key facts
- 0.3 acre lot
- Listed 3 days
Property features AI
Finance
- Financial info: Annual tax amount listed
Exterior
- Parking: Concrete parking
- Security: Smoke detector(s)
- Utilities: Public water; Public sewer
- Home design: Single-family residence, site-built; One level / single story
- Construction: Metal roof; Crawl space foundation
- Exterior features: Deck; Lot approximately 100 x 133 (0.3 acre)
Interior
- Kitchen: Electric oven; Electric range; Refrigerator
- Flooring: Vinyl
- Bathrooms: 1 full bathroom
- Heating & cooling: Central heating; Central air; Ceiling fans
- Interior features: Electric oven and electric range; Refrigerator; Electric water heater; Vinyl flooring; Smoke detectors
- Laundry & utility: Dedicated laundry room
Neighborhood map
What this means for you Summary
Snapshot
- This is a 3-bed/1.0-bath single-family listed at $149k.
Deal economics
- At list price, monthly cash flow is $168 ($2k/yr) — positive.
- The deal already cash-flows at list — no discount required.
- To meet the 1% rule (rent ≥ 1% of price), the offer needs to be $138k (7.4% below list).
- Recommended offer: $138k (7.4% below list) — sets the bar for 1% rule.
- Cap rate 7.6% vs local median 3.3% in Rome — top-decile yield for the area; either an underpriced asset or a hidden risk that comps aren't pricing in. Stress-test before assuming the spread holds.
Location & tenants
- Location reads 64/100 on livability (#266 in GA) — a middle-class / working-renter tenant base. Strengths: cost of living A+, housing A+, health & safety A+; Watch: crime F, amenities F, commute F.
- Rome City (urban): math 27% / reading 29% proficiency, ranked #112 of 174 in GA (top 64%) — low school quality limits family demand, transient renter base, plan for 1-2y turnover; 71% free/reduced lunch — lower-income household profile, screen leases tightly.
- Zoned schools: Anna K. Davie Elementary (math 2% / reading 8%, grade F, #1,160 of 1,228 statewide, top 98%, 434 students, 94% FRL); Rome Middle School (math 32% / reading 35%, grade F, #206 of 470 statewide, top 45%, 966 students, 55% FRL); Rome High School (math 12% / reading 15%, grade F, #325 of 424 statewide, top 78%, 2,095 students, 66% FRL) — zoned schools at 72% FRL track the district average.
- Market conditions: Rents rising fast (+6.3%/yr); 411 active listings in the ZIP; 5 comparable units currently listed for rent nearby; rentals lingering (median 44d on market — plan ~5-8 weeks vacancy on turnover, expect pricing pressure); 80% of comp listings sitting > 30 days — soft ceiling on asking rent; 355 units permitted in Floyd County in 2024 (0 in 5+ unit buildings).
Forward outlook
- Local home prices are declining (-3.0%/yr); year-one equity from $1k of loan paydown is wiped out by about $4k of value loss. Plan a longer hold.
- Floyd County population projected to shrink 6% by 2050 — rents likely to lag national; underwrite the cash flow, not the appreciation.
Negotiation context
- Only 4 days on market — expect competitive offers; lowballing is unlikely to land.
- 8 sale attempts since 4y ago with the ask held roughly flat each time — persistent listings suggest the price (not the market) is what's stuck; bring a comps-based counter.
- Current owner paid $45k; list at $149k implies a 231% gain — meaningful room to come down on a strong offer.
Risks & watch-outs
- Watch-outs: built in 1935 — expect roof / HVAC / electrical / plumbing capex.
- Climate carrying-cost: extreme-heat days projected 7→21/yr by 2055 (HVAC capex compounding) — expect insurance premiums to compound above CPI over the hold.
Questions for the listing agent
- Built in 1935 — when were the roof, HVAC, electrical panel, plumbing, and water heater last replaced?
- Is there a deadline driving the sale (1031 exchange, divorce, estate, relocation)? That informs how much negotiation room exists.
- Schools are F-rated, which usually means shorter tenancies and higher turnover. Who's the typical renter profile here, and what's been the actual vacancy rate?
- Crime grade is F in this area — have there been break-ins, vandalism, or insurance claims at this property in the last 3 years? What carrier currently insures it and at what premium?
- What's the average days-on-market for RENTAL listings here right now (not sales)? A rising rental-DOM trend means longer vacancies and softer asking-rent achievability than the comps imply.
- What's the recent tenant-quality profile in this submarket — average credit score on applications, eviction rate, late-payment / NSF rate, and stable-employment percentage? A property-management company in the area should have these aggregated.
- How much new for-sale + rental construction is in the pipeline within 1–3 miles? Heavy new supply typically softens prices + rents 12–24 months out; constrained supply supports both.
Investment metrics
- 1% rule
- 0.93% ✗
- Cap rate
- 7.65%
- Cash-on-cash
- 4.83%
- DSCR
- 1.21
- GRM
- 9.0
CMA / ARV
- ARV (on-the-fly)
- $178,476
- Comps found
- 12
Show comp detail 12 sales within ~0.75 mi
| Address | Dist | Beds/Ba | Sqft | Sold | Price | $/sf | Match |
|---|---|---|---|---|---|---|---|
| 414 E 17th St SW | 0.31mi | 3/2.0 | 1,304 (+2%) | 5mo | $222,000 | $170 | 75 |
| 419 E 13th St SW | 0.29mi | 3/1.0 | 1,185 (-8%) | 3mo | $175,000 | $148 | 71 |
| 525 E 14th St | 0.38mi | 3/1.0 | 1,362 (+6%) | 3mo | $110,000 | $81 | 69 |
| 407 E 19th St SW | 0.36mi | 3/2.5 | 1,355 (+6%) | 1mo | $180,000 | $133 | 68 |
| 308 E 20th St SW | 0.45mi | 3/1.0 | 1,360 (+6%) | 12mo | $84,900 | $62 | 59 |
| 2 Fair SW | 0.61mi | 2/1.0 (-1) | 1,246 (-3%) | 4mo | $190,000 | $152 | 58 |
| 1901 Hull Ave SW | 0.39mi | 3/2.5 | 1,444 (+12%) | 3mo | $200,000 | $139 | 52 |
| 19 N Blanche Ave SW | 0.67mi | 2/1.0 (-1) | 1,236 (-4%) | 12mo | $145,000 | $117 | 48 |
| 210 E Main St SW | 0.54mi | 3/2.0 | 1,458 (+14%) | 3mo | $85,000 | $58 | 45 |
| 2512 Callier Springs Rd | 0.67mi | 3/1.0 | 1,100 (-14%) | 6mo | $87,000 | $79 | 40 |
| 115 E Boundary | 0.67mi | 3/2.0 | 1,104 (-14%) | 3mo | $210,000 | $190 | 39 |
| 117 E Boundary St | 0.67mi | 3/2.0 | 1,104 (-14%) | 3mo | $214,900 | $195 | 39 |
Match score weights: distance 35% · size 25% · config 20% · recency 20%. Top-matched comps best support the ARV.
Projected returns pro-forma
-3.0% appreciation · 6.28% rent growth · sell at horizon
- IRR
- -5.5%
- Equity multiple
- 0.79×
- Total profit
- $-8,793
- Equity at exit
- $22,216
- IRR
- 7.4%
- Equity multiple
- 1.64×
- Total profit
- $26,579
- Equity at exit
- $12,883
Cash invested: $41,720 (down + closing). Projections, not guarantees.
Landlord ↔ Tenant lean methodology
- Overall (STATE)
- 90 Strongly Landlord-Friendly
- State Georgia
- 90 Strongly Landlord-Friendly · R+3
- County
- — inherits STATE
- City
- — inherits STATE
ZIP-level market 30161
- Rents YoY
- 6.3%
- Active inventory
- 411
- Price-to-rent
- 9.0×
Monthly cashflow live
- Estimated rent
- $1,380 medium interval (Pro) →
- Mortgage (P&I)
- −$781
- Tax from tax record
- −$79 /mo · $946/yr
- Insurance
- −$62
- HOA
- −$0
- Vacancy / Maint / Mgmt
- −$290
- Net cashflow
- $168
Break-even live
UW: 25.0% down · 7.5% · 30yr · 1.5% tax · 5.0% vac · 8.0% maint · 8.0% mgmt
Financing live
Cash to close
- Down payment
- $37,250
- Closing costs
- $4,470
- Reserves months
- —
- Total cash needed
- —
Loan-product check · same deal, 3 products live
Conventional
25% down · 7.5% · 30yr
- Down + closing
- —
- Monthly P&I
- —
- Monthly cashflow
- —
- DSCR
- —
- Eligible?
- —
Personal DTI + credit; lowest rate.
DSCR
20% down · 8.5% · 30yr
- Down + closing
- —
- Monthly P&I
- —
- Monthly cashflow
- —
- DSCR
- —
- Eligible?
- —
No personal income docs; deal must DSCR.
Hard money
10% down · 12.0% · 12mo
- Down + closing
- —
- Monthly P&I
- —
- Monthly cashflow
- —
- DSCR
- —
- Eligible?
- —
Short-term bridge; refi at stabilization.
Rent comps 5 comps
| Address | Beds | Baths | Sqft | Rent | $/sqft | DOM | Units | Dist |
|---|---|---|---|---|---|---|---|---|
| 331 S McLin St SW Rome, GA | 3.0 | 1.0 | 1108 | $1,250 | $1.13 | 43d | 1 | 0.40mi |
| 202 E 19th St SW Rome, GA | 2.0 | 2.0 | 1308 | $1,250 | $0.96 | 43d | 1 | 0.40mi |
| 413 E 2nd St Rome, GA | 2.0 | 1.5 | 1328 | $1,275 | $0.96 | 43d | 1 | 1.30mi |
| 48 Chateau Dr SE Rome, GA | 1.0–2.0 | 1.0–1.5 | 802 | $2,200 | $2.74 | 43d | 5 | 1.41mi |
| 50 Chateau Dr SE Rome, GA | 2.0–3.0 | 1.5–2.0 | 1255 | $1,599 | $1.27 | 2d | 4 | 1.46mi |
Listing history 5 events
-
2026-06-19days on market $149,000 Active 4 DOM
-
2026-06-18days on market $149,000 Active 3 DOM
-
2026-06-17days on market $149,000 Active 2 DOM
-
2026-06-15remarks 699-char remark
-
2026-06-15$149,000 Active 1 DOM
ⓘ Source: listings_history table (triggers on properties + properties_extension) + one-shot
backfill from property_details.listing_events for pre-trigger history.
Tax reassessment forecast GA · Resets to sale price
- Current annual tax
- $946 · $79/mo
- Projected year-2 tax
- $1,371 · $114/mo
- Expected delta
- +$424/yr (+$35/mo · 44.9%)
ⓘ Screening estimate from a state-policy table — verify with the county assessor before closing.
Climate risk First Street
- Flood 1/10 Low FEMA zone X (unshaded) · 0% chance over 30 yrs
- Wildfire 3/10 Moderate
- Heat 6/10 Major 7 d/yr ≥104°F today · 21 d/yr by 30 yrs out
- Wind 4/10 Moderate 18% chance of damaging wind over 30 yrs
- Air quality 2/10 Low 2 unhealthy d/yr today · 2 by 30 yrs out
Nearby sold comps map
Loading sold comps map…
Walkable amenities ~0.75 mi
Loading nearby amenities…
Taxation est. · year 1
- Rental income
- $16,560
- − Mortgage interest
- −$8,346
- − Property taxes
- −$946
- − Insurance
- −$745
- − Repairs & maintenance
- −$1,325
- − Management
- −$1,325
- − Depreciation
- −$4,335
- Taxable loss
- −$462
- Est. tax savings @ 24.0%
- +$111
- After-tax cash flow
- $2,125/yr
For passive investors: Depreciation is non-cash, so a rental often shows a tax loss while cash-flowing — sheltering income. Rental losses are passive: they offset passive income freely, and up to $25,000/yr can offset ordinary (W-2) income if you actively participate and your MAGI is under $100k (phasing out to $0 by $150k); unused losses carry forward. On sale, claimed depreciation is recaptured at up to 25%, and gains may owe capital-gains tax (a 1031 exchange can defer both). Figures are a year-1 estimate at your 24.0% rate — not tax advice; consult a CPA.
Schools (NCES district)
- District
- Rome City
- NCES district ID
- 1304440
- Math proficiency
- 27% ▼ -14.00%
- Reading proficiency
- 29% ▼ -4.00%
- Median HH income
- $34,889
- Composite
- 23.1/100
- National rank
- #7963
- State rank
- #112 of 174 in GA
Livability — Rome
- Score
- 64/100
- State rank
- #266
- US rank
- #14459
Category grades
Schools grade is shown separately in the Schools card above.
Census & demographics
- Census place
- Rome, GA
- County
- Floyd County · 77,706 people
- City population
- 77,706
- Metro
- Rome, GA
- Population (ZIP)
- 34,705
- Household income
- $61,667
- Rent vs Own
- Severe rent burden
- 1104.0
Population outlook (Floyd County) Hauer SSP2
- Today (2025)
- 96,321 people
- By 2030
- 95,532 · -0.8%
- By 2040
- 93,332 · -3.1%
- By 2050
- 90,850 · -5.7%
- By 2075
- 84,989 · -11.8%
- By 2100
- 76,097 · -21.0%
Race, ethnicity, and origin ACS 2023
- Neighborhood character
- Predominantly White (68%)
- Race & ethnicity
- White 68% Black 20% Hispanic / Latino 7% Two or more races 6% Asian 1%
- Hispanic origin (detail)
- Mexican 2%
- Common ancestry
- Slovak 3% Serbian 2% Italian 2%
- Foreign-born
- 5% · Canada
- Languages at home
- 91% English-only · Spanish 5% Other Indo-European 1%
Political lean MEDSL · Floyd
- 2024 margin
- Solid R (+42.0) · D 28.8% · R 70.7%
- 2008→2024 swing
- -5.6pp toward R · 2008: -36.4pp · 2024: -42.0pp
- All cycles
- 2024: R+42.0 2020: R+41.1 2016: R+43.5 2012: R+39.9 2008: R+36.4
Not yet ingested
- Civics
- —
Market trends
- HPI YoY
- ▼ -186.06%
- Current HPI
- 257.8168
- Rent YoY
- ▲ 6.28%
- Metro
- Rome, GA
- State GDP YoY
- ▲ 2.66%
- F500 in state
- 28
Industry mix (Fortune 500 HQ in GA)
| Industry | F500 HQs | Revenue |
|---|---|---|
| Paper / Packaging | 2 | $29B |
|
||
| Retail | 1 | $160B |
|
||
| Transportation / Logistics | 1 | $91B |
|
||
| Airlines | 1 | $62B |
|
||
| Consumer Goods | 1 | $47B |
|
||
| Utilities | 1 | $25B |
|
||
Price history
+65.6% since first listed29 events — show timeline
- 2026-06-13 Listed $149,000 CCARMLS
- 2025-06-03 Sold (Public Records) $45,000 Public Records
- 2025-05-30 Sold (MLS) $45,000 GAMLS
- 2025-05-30 Sold (MLS) $45,000 FMLS
- 2025-05-04 Pending — GAMLS
- 2025-05-04 Pending — FMLS
- 2025-04-16 Price Changed $59,900 GAMLS
- 2025-04-16 Price Changed $59,900 FMLS
- 2025-03-20 Relisted — GAMLS
- 2025-03-20 Relisted — FMLS
- 2025-03-20 Price Changed $68,900 GAMLS
- 2025-03-20 Price Changed $68,900 FMLS
- 2025-03-15 Pending — GAMLS
- 2025-03-15 Pending — FMLS
- 2025-02-10 Price Changed $75,000 GAMLS
- 2025-02-10 Price Changed $75,000 FMLS
- 2025-01-06 Listed $80,000 GAMLS
- 2025-01-06 Listed $80,000 FMLS
- 2023-03-03 Sold (Public Records) $290,000 Public Records
- 2023-03-01 Sold (MLS) $60,000 REALTRACS as Distributed by MLS Grid
- 2023-03-01 Sold (MLS) $60,000 GCAR
- 2023-01-03 Delisted — GCAR
- 2022-11-07 Price Changed $65,000 GCAR
- 2022-11-07 Relisted — GCAR
- 2022-10-10 Delisted — GCAR
- 2022-09-22 Price Changed $85,000 GCAR
- 2022-09-18 Relisted — GCAR
- 2022-08-19 Contingent — GCAR
- 2022-07-09 Listed $90,000 GCAR
Property tax history
+8.9%/yrLatest (2025): $946 · +10.1% YoY. Source: county tax records.
Cash-flow waterfall
monthlySold comps — $/sqft
last 12 mo · ≤1 miLoading sold comps…