10033 SW County Road 225 · Starke, FL
Flood risk 3/10 · Minor
- FEMA flood zone
- X (unshaded)
- Chance of flooding over 30 yrs
- 0.2%
- Est. flood insurance / yr
- $507 – $1,088
Fire risk 5/10 · Moderate
- Est. fire insurance / yr
- $947 – $1,759
Heat risk 8/10 · Major
- Hot days now (above 107°F)
- 7 days/yr
- Hot days in 30 yrs
- 20 days/yr
Wind risk 9/10 · Severe
- Chance of severe wind over 30 yrs
- 99.0%
Air-quality risk 4/10 · Minor
- Unhealthy air days now
- 5 days/yr
- Unhealthy air days in 30 yrs
- 5 days/yr
Risk factors via First Street. Map © Google.
Why this score? — see what drove the B- grade
The composite is a weighted blend of 9 inputs, each scored 0–100. Each bar is that input's sub-score; the figure is the points it added to the 100-point composite (weight × sub-score).
- Cash flow +30.0/30.0
- DSCR +10.0/10.0
- 1% rule +8.7/10.0
- ARV discount +7.5/15.0
- Schools +3.6/10.0
- Livability +3.6/5.0
- Rent growth +2.5/5.0
- Condition / age +2.5/5.0
- Appreciation +0.0/10.0
$115,900
🖨 Deal sheet 📄 Offer letter ✓ Due diligence
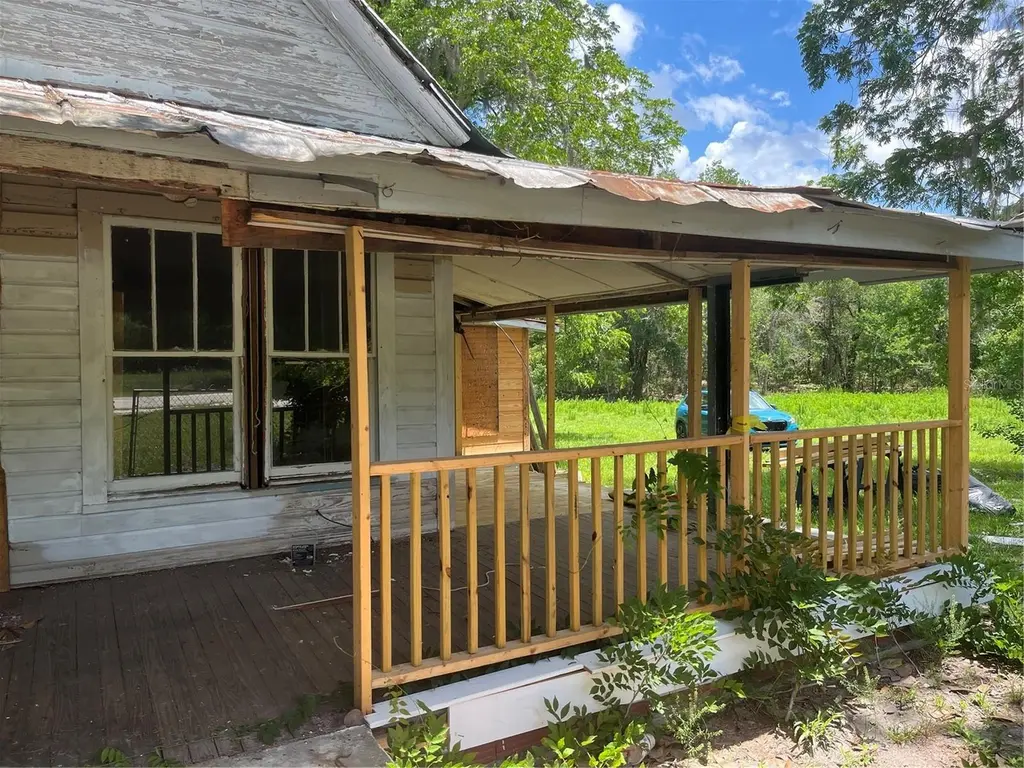
Listing remarks
Step back in time to the year "1900" before contractors, Home Depot and Power tools, in an era where homes were built to last for generations and come tour this historical Cracker-style homestead that sits on a sprawling 1.28-acre cleared lot in Samson City, offering an incredible opportunity to restore a piece of old Florida history. Boasting 1,898 square feet of heated living space and a total of 2,290 square feet under roof, this three-bedroom, three-bathroom single-family residence stands tall with a century of stories and memories of a much simpler time. The practical front and side porches top off the classic style of the times. Features a traditional brick wood-burning fire
Key facts
- 1.28 acre lot
- 2 garage spots
- Built 1900
Tags
Property features AI
Finance
- Other: Zoned AG (agricultural)
- Financial info: Homestead status indicated
- HOA & community: No homeowners association
Exterior
- Parking: 2-car garage
- Utilities: Private well water; Septic tank sewer; Electricity connected; Water connected
- Home design: Single-family residence; One story; Faces south; Fixer condition
- Construction: Frame construction with wood siding; Metal roof; Crawlspace foundation; Built on a 1.28-acre parcel
- Exterior features: Covered front, side and wrap-around porch; Wire fencing; Shed(s); Cleared lot; On a creek with creek frontage and water access; Asphalt road access
Interior
- Kitchen: No appliances listed
- Bedrooms: 3 bedrooms
- Flooring: Wood
- Bathrooms: 3 full bathrooms
- Heating & cooling: No heating specified; No cooling specified
- Interior features: Other interior features; Wood flooring; Living room wood-burning fireplace
- Laundry & utility: Dedicated laundry room
Neighborhood map
What this means for you Summary
Snapshot
- This is a 3-bed/1.0-bath single-family listed at $116k.
Deal economics
- At list price, monthly cash flow is $504 ($6k/yr) — positive.
- The deal already cash-flows at list — no discount required.
- Meets the 1% rule at list price ($2k rent vs $116k).
- Recommended offer: $114k (1.5% below list) — sets the bar for market timing.
- Cap rate 11.5% vs local median 3.5% in Starke — top-decile yield for the area; either an underpriced asset or a hidden risk that comps aren't pricing in. Stress-test before assuming the spread holds.
Location & tenants
- Location reads 72/100 on livability (#336 in FL) — a middle-class / working-renter tenant base. Strengths: cost of living A+, housing A+, health & safety A+; Watch: amenities D, commute F, employment F.
- Bradford (town): math 43% / reading 42% proficiency, ranked #57 of 73 in FL (top 78%) — families likely to look elsewhere, expect single-tenant / working-renter base with shorter leases; 60% free/reduced lunch — lower-income household profile, screen leases tightly.
- Market conditions: 153 active listings in the ZIP; 93 units permitted in Bradford County in 2024 (0 in 5+ unit buildings).
Forward outlook
- Local home prices are declining (-3.0%/yr); year-one equity from $801 of loan paydown is wiped out by about $3k of value loss. Plan a longer hold.
- Bradford County population projected at -25% by 2050 — secular population decline; favor cash flow + early exit over multi-decade hold.
- At projected returns (-3.0% appreciation + 3.0% rent growth), your $32k cash investment doubles in ~7 years — after that, you're playing with house money.
Negotiation context
- It's been on market 30 days — a 2% lower offer ($114k) is reasonable based on typical stale-listing flexibility.
Risks & watch-outs
- Watch-outs: built in 1900 — expect roof / HVAC / electrical / plumbing capex.
- Climate carrying-cost: severe wind risk, 99% chance of damaging wind over 30y; moderate wildfire risk; extreme-heat days projected 7→20/yr by 2055 (HVAC capex compounding) — expect insurance premiums to compound above CPI over the hold.
Questions for the listing agent
- Built in 1900 — when were the roof, HVAC, electrical panel, plumbing, and water heater last replaced?
- Is there a deadline driving the sale (1031 exchange, divorce, estate, relocation)? That informs how much negotiation room exists.
- What's the average days-on-market for RENTAL listings here right now (not sales)? A rising rental-DOM trend means longer vacancies and softer asking-rent achievability than the comps imply.
- What's the recent tenant-quality profile in this submarket — average credit score on applications, eviction rate, late-payment / NSF rate, and stable-employment percentage? A property-management company in the area should have these aggregated.
- How much new for-sale + rental construction is in the pipeline within 1–3 miles? Heavy new supply typically softens prices + rents 12–24 months out; constrained supply supports both.
Investment metrics
- 1% rule
- 1.37% ✓
- Cap rate
- 11.51%
- Cash-on-cash
- 18.64%
- DSCR
- 1.83
- GRM
- 6.1
CMA / ARV
No comps found within radius.
Projected returns pro-forma
-3.0% appreciation · 3.0% rent growth · sell at horizon
- IRR
- 10.4%
- Equity multiple
- 1.41×
- Total profit
- $13,323
- Equity at exit
- $17,281
- IRR
- 19.5%
- Equity multiple
- 2.63×
- Total profit
- $52,913
- Equity at exit
- $10,021
Cash invested: $32,452 (down + closing). Projections, not guarantees.
Landlord ↔ Tenant lean methodology
- Overall (STATE)
- 87 Strongly Landlord-Friendly
- State Florida
- 87 Strongly Landlord-Friendly · R+3
- County
- — inherits STATE
- City
- — inherits STATE
ZIP-level market 32091
- Home prices YoY
- -10.6%
- Active inventory
- 153
- Price-to-rent
- 6.1×
Monthly cashflow live
- Estimated rent
- $1,583 medium interval (Pro) →
- Mortgage (P&I)
- −$608
- Tax from tax record
- −$90 /mo · $1,084/yr
- Insurance
- −$48
- HOA
- −$0
- Vacancy / Maint / Mgmt
- −$332
- Net cashflow
- $504
Break-even live
UW: 25.0% down · 7.5% · 30yr · 1.5% tax · 5.0% vac · 8.0% maint · 8.0% mgmt
Financing live
Cash to close
- Down payment
- $28,975
- Closing costs
- $3,477
- Reserves months
- —
- Total cash needed
- —
Loan-product check · same deal, 3 products live
Conventional
25% down · 7.5% · 30yr
- Down + closing
- —
- Monthly P&I
- —
- Monthly cashflow
- —
- DSCR
- —
- Eligible?
- —
Personal DTI + credit; lowest rate.
DSCR
20% down · 8.5% · 30yr
- Down + closing
- —
- Monthly P&I
- —
- Monthly cashflow
- —
- DSCR
- —
- Eligible?
- —
No personal income docs; deal must DSCR.
Hard money
10% down · 12.0% · 12mo
- Down + closing
- —
- Monthly P&I
- —
- Monthly cashflow
- —
- DSCR
- —
- Eligible?
- —
Short-term bridge; refi at stabilization.
Listing history 17 events
-
2026-06-18days on market $115,900 Active 30 DOM
-
2026-06-17days on market $115,900 Active 29 DOM
-
2026-06-16days on market $115,900 Active 28 DOM
-
2026-06-15days on market $115,900 Active 27 DOM
-
2026-06-14days on market $115,900 Active 25 DOM
-
2026-06-13days on market $115,900 Active 24 DOM
-
2026-06-10days on market $115,900 Active 22 DOM
-
2026-06-09days on market $115,900 Active 21 DOM
-
2026-06-08days on market $115,900 Active 20 DOM
-
2026-06-07days on market $115,900 Active 19 DOM
-
2026-06-03days on market $115,900 Active 15 DOM
-
2026-06-03price $115,900 Active 14 DOM
-
2026-06-02days on market $125,000 Active 14 DOM
-
2026-06-01days on market $125,000 Active 13 DOM
-
2026-05-31days on market $125,000 Active 12 DOM
-
2026-05-30days on market $125,000 Active 11 DOM
-
2026-05-20$125,000 Active
ⓘ Source: listings_history table (triggers on properties + properties_extension) + one-shot
backfill from property_details.listing_events for pre-trigger history.
Tax reassessment forecast FL · Resets to sale price
- Current annual tax
- $1,084 · $90/mo
- Projected year-2 tax
- $1,084 · $90/mo
- Expected delta
- $0/yr ($0/mo · 0.0%)
ⓘ Screening estimate from a state-policy table — verify with the county assessor before closing.
Climate risk First Street
- Flood 3/10 Moderate FEMA zone X (unshaded) · 20% chance over 30 yrs
- Wildfire 5/10 Major
- Heat 8/10 Severe 7 d/yr ≥107°F today · 20 d/yr by 30 yrs out
- Wind 9/10 Extreme 99% chance of damaging wind over 30 yrs
- Air quality 4/10 Moderate 5 unhealthy d/yr today · 5 by 30 yrs out
Nearby sold comps map
Loading sold comps map…
Walkable amenities ~0.75 mi
Loading nearby amenities…
Taxation est. · year 1
- Rental income
- $18,997
- − Mortgage interest
- −$6,492
- − Property taxes
- −$1,084
- − Insurance
- −$580
- − Repairs & maintenance
- −$1,520
- − Management
- −$1,520
- − Depreciation
- −$3,372
- Taxable income
- $4,430
- Est. tax owed @ 24.0%
- −$1,063
- After-tax cash flow
- $4,987/yr
For passive investors: Depreciation is non-cash, so a rental often shows a tax loss while cash-flowing — sheltering income. Rental losses are passive: they offset passive income freely, and up to $25,000/yr can offset ordinary (W-2) income if you actively participate and your MAGI is under $100k (phasing out to $0 by $150k); unused losses carry forward. On sale, claimed depreciation is recaptured at up to 25%, and gains may owe capital-gains tax (a 1031 exchange can defer both). Figures are a year-1 estimate at your 24.0% rate — not tax advice; consult a CPA.
Schools (NCES district)
- District
- Bradford
- NCES district ID
- 1200120
- Math proficiency
- 43% ▼ -9.00%
- Reading proficiency
- 42% ▼ -3.00%
- Median HH income
- $41,661
- Composite
- 35.78/100
- National rank
- #4840
- State rank
- #57 of 73 in FL
Livability — Starke
- Score
- 72/100
- State rank
- #336
- US rank
- #5839
Category grades
Schools grade is shown separately in the Schools card above.
Census & demographics
- City population
- 16,062
- Population (ZIP)
- 16,062
Population outlook (Bradford County) Hauer SSP2
- Today (2025)
- 24,999 people
- By 2030
- 23,895 · -4.4%
- By 2040
- 21,329 · -14.7%
- By 2050
- 18,681 · -25.3%
- By 2075
- 13,557 · -45.8%
- By 2100
- 9,228 · -63.1%
Race, ethnicity, and origin ACS 2023
- Neighborhood character
- Predominantly White (69%)
- Race & ethnicity
- White 69% Black 20% Hispanic / Latino 6% Two or more races 6%
- Hispanic origin (detail)
- Puerto Rican 4%
- Common ancestry
- Lithuanian 3% Serbian 1% Slovak 1%
- Foreign-born
- 3% · Canada, Mexico, Jamaica
- Languages at home
- 97% English-only · Spanish 2%
Political lean MEDSL · Bradford
- 2024 margin
- Solid R (+57.2) · D 21.1% · R 78.4%
- 2008→2024 swing
- -16.9pp toward R · 2008: -40.3pp · 2024: -57.2pp
- All cycles
- 2024: R+57.2 2020: R+52.6 2016: R+49.5 2012: R+42.1 2008: R+40.3
Not yet ingested
- Civics
- —
Market trends
- HPI YoY
- ▼ -36.09%
- Current HPI
- 305.3668
- Rent YoY
- —
- Metro
- —
- State GDP YoY
- ▲ 3.28%
- F500 in state
- 36
Industry mix (Fortune 500 HQ in FL)
| Industry | F500 HQs | Revenue |
|---|---|---|
| Industrial Technology | 2 | $29B |
|
||
| Insurance | 2 | $17B |
|
||
| Retail | 1 | $60B |
|
||
| Technology Distribution | 1 | $58B |
|
||
| Homebuilding | 1 | $35B |
|
||
| Technology Manufacturing | 1 | $35B |
|
||
Price history
1 event — show timeline
- 2026-05-20 Listed $125,000 Stellar MLS as Distributed by MLS Grid
Property tax history
+6.5%/yrLatest (2025): $1,084 · +29.1% YoY. Source: county tax records.
Cash-flow waterfall
monthlySold comps — $/sqft
last 12 mo · ≤1 miLoading sold comps…