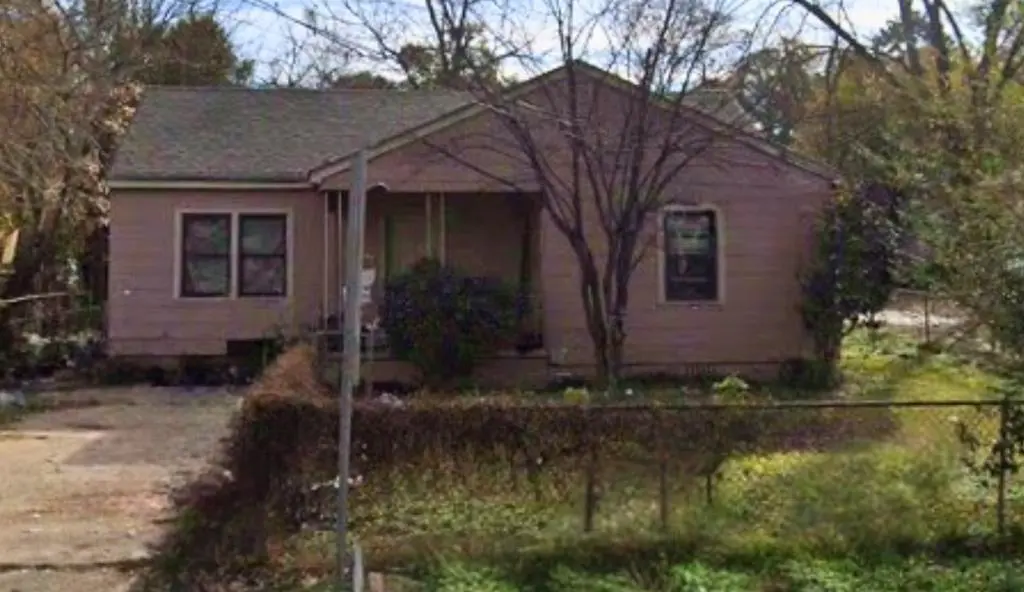
338 31st Ave · Columbus, GA
Flood risk 1/10 · Minimal
- FEMA flood zone
- X (unshaded)
- Chance of flooding over 30 yrs
- 0.0%
- Est. flood insurance / yr
- $507 – $1,088
Fire risk 2/10 · Minimal
- Est. fire insurance / yr
- $963 – $1,789
Heat risk 7/10 · Major
- Hot days now (above 107°F)
- 7 days/yr
- Hot days in 30 yrs
- 19 days/yr
Wind risk 6/10 · Moderate
- Chance of severe wind over 30 yrs
- 76.0%
Air-quality risk 4/10 · Minor
- Unhealthy air days now
- 4 days/yr
- Unhealthy air days in 30 yrs
- 5 days/yr
Risk factors via First Street. Map © Google.
Why this score? — see what drove the B- grade
The composite is a weighted blend of 9 inputs, each scored 0–100. Each bar is that input's sub-score; the figure is the points it added to the 100-point composite (weight × sub-score).
- Cash flow +29.8/30.0
- DSCR +10.0/10.0
- 1% rule +7.9/10.0
- ARV discount +7.5/15.0
- Livability +3.2/5.0
- Rent growth +3.0/5.0
- Condition / age +2.5/5.0
- Schools +2.2/10.0
- Appreciation +0.0/10.0
$77,000
🖨 Deal sheet 📄 Offer letter ✓ Due diligence
Listing remarks MLS
Stable Income-Producing Investment with ARV Upside in Andrews! 2-bedroom, 1-bath ranch-style home offering 1394 sq ft of efficient single-level living. This property is a proven income producer, making it an ideal buy-and-hold investment with immediate cash flow. The functional layout and ranch design support strong tenant demand and low maintenance ownership. Located in the Andrews area, just minutes from Fort Benning, shopping and dining. With solid fundamentals and promising ARV potential, this property offers investors the opportunity to generate steady income today while positioning for future value growth.
Key facts
- Ranch style home
- Strong tenant demand
- Shopping and dining
Tags
Neighborhood map
What this means for you Summary
Snapshot
- This is a 2-bed/1.0-bath single-family listed at $77k.
Deal economics
- At list price, monthly cash flow is $282 ($3k/yr) — positive.
- The deal already cash-flows at list — no discount required.
- Meets the 1% rule at list price ($996 rent vs $77k).
- Recommended offer: $68k (12.0% below list) — sets the bar for market timing.
- Cap rate 10.7% vs local median 4.7% in Columbus — top-decile yield for the area; either an underpriced asset or a hidden risk that comps aren't pricing in. Stress-test before assuming the spread holds.
Location & tenants
- Location reads 64/100 on livability (#254 in GA) — a middle-class / working-renter tenant base. Strengths: cost of living A+, housing A+, health & safety B; Watch: amenities D+, schools F, crime F.
- Muscogee County (urban): math 21% / reading 30% proficiency, ranked #120 of 174 in GA (top 69%) — low school quality limits family demand, transient renter base, plan for 1-2y turnover; 61% free/reduced lunch — lower-income household profile, screen leases tightly.
- Market conditions: Rents rising (+1.8%/yr); 100 active listings in the ZIP; 23 comparable units currently listed for rent nearby; rentals at typical pace (median 21d on market — plan ~3-4 weeks tenant-placement turnaround); lower-income renter base — watch delinquency; 291 units permitted in Muscogee County in 2024 (30 in 5+ unit buildings).
- This rent runs 37% of the median local income ($32k/yr) — at the standard rent-burdened threshold; future hikes will face affordability resistance.
Forward outlook
- Local home prices are declining (-3.0%/yr); year-one equity from $532 of loan paydown is wiped out by about $2k of value loss. Plan a longer hold.
- Muscogee County population projected at +15% by 2050 — modest demand growth; plan on rents tracking national, not racing it.
- At projected returns (-3.0% appreciation + 1.8% rent growth), your $22k cash investment doubles in ~9 years — after that, you're playing with house money.
Negotiation context
- It's been on market 132 days — a 12% lower offer ($68k) is reasonable based on typical stale-listing flexibility.
- 2 sale attempts since 10y ago with the ask held roughly flat each time — persistent listings suggest the price (not the market) is what's stuck; bring a comps-based counter.
Risks & watch-outs
- Watch-outs: built in 1949 — expect roof / HVAC / electrical / plumbing capex.
- Climate carrying-cost: major wind risk, 76% chance of damaging wind over 30y; extreme-heat days projected 7→19/yr by 2055 (HVAC capex compounding) — expect insurance premiums to compound above CPI over the hold.
Questions for the listing agent
- It's been on market 132 days. Have you received any prior offers? Is the seller open to a 12% concession, seller financing, or rate buy-down credit?
- Built in 1949 — when were the roof, HVAC, electrical panel, plumbing, and water heater last replaced?
- Why hasn't it sold? Are there any deal-killer items the seller is aware of (foundation, flood, title, zoning, code violations)?
- Is there a deadline driving the sale (1031 exchange, divorce, estate, relocation)? That informs how much negotiation room exists.
- Schools are F-rated, which usually means shorter tenancies and higher turnover. Who's the typical renter profile here, and what's been the actual vacancy rate?
- Crime grade is F in this area — have there been break-ins, vandalism, or insurance claims at this property in the last 3 years? What carrier currently insures it and at what premium?
- What's the average days-on-market for RENTAL listings here right now (not sales)? A rising rental-DOM trend means longer vacancies and softer asking-rent achievability than the comps imply.
- What's the recent tenant-quality profile in this submarket — average credit score on applications, eviction rate, late-payment / NSF rate, and stable-employment percentage? A property-management company in the area should have these aggregated.
- How much new for-sale + rental construction is in the pipeline within 1–3 miles? Heavy new supply typically softens prices + rents 12–24 months out; constrained supply supports both.
Investment metrics
- 1% rule
- 1.29% ✓
- Cap rate
- 10.69%
- Cash-on-cash
- 15.71%
- DSCR
- 1.70
- GRM
- 6.4
CMA / ARV
- ARV (median comp)
- $50,324
- List price
- $77,000
- Delta
- 53.01%
- Verdict
- OVERPRICED
- Comps
- 20 within 1.0 mi
Show comp detail 6 sales within ~0.75 mi
| Address | Dist | Beds/Ba | Sqft | Sold | Price | $/sf | Match |
|---|---|---|---|---|---|---|---|
| 307 32nd Ave | 0.10mi | 3/2.0 (+1) | 1,337 (-4%) | 3mo | $131,500 | $98 | 77 |
| 2913 Lee St | 0.24mi | 3/1.0 (+1) | 1,470 (+6%) | 2mo | $56,000 | $38 | 73 |
| 2731 Lumpkin Ct | 0.53mi | 3/2.0 (+1) | 1,334 (-4%) | 0mo | $61,000 | $46 | 59 |
| 2602 Garden Dr | 0.49mi | 3/2.0 (+1) | 1,250 (-10%) | 9mo | $132,000 | $106 | 43 |
| 930 Fletcher Ave | 0.65mi | 3/1.0 (+1) | 1,480 (+6%) | 13mo | $52,500 | $35 | 43 |
| 2603 Clover Ln | 0.51mi | 2/1.0 | 1,261 (-10%) | 21mo | $35,000 | $28 | 43 |
Match score weights: distance 35% · size 25% · config 20% · recency 20%. Top-matched comps best support the ARV.
Projected returns pro-forma
-3.0% appreciation · 1.82% rent growth · sell at horizon
- IRR
- 5.2%
- Equity multiple
- 1.20×
- Total profit
- $4,328
- Equity at exit
- $11,481
- IRR
- 13.6%
- Equity multiple
- 2.03×
- Total profit
- $22,226
- Equity at exit
- $6,658
Cash invested: $21,560 (down + closing). Projections, not guarantees.
Landlord ↔ Tenant lean methodology
- Overall (STATE)
- 90 Strongly Landlord-Friendly
- State Georgia
- 90 Strongly Landlord-Friendly · R+3
- County
- — inherits STATE
- City
- — inherits STATE
ZIP-level market 31903
- Home prices YoY
- -14.5%
- Rents YoY
- 1.8%
- Active inventory
- 100
- Price-to-rent
- 6.4×
Monthly cashflow live
- Estimated rent
- $996 high interval (Pro) →
- Mortgage (P&I)
- −$404
- Tax from tax record
- −$68 /mo · $821/yr
- Insurance
- −$32
- HOA
- −$0
- Vacancy / Maint / Mgmt
- −$209
- Net cashflow
- $282
Break-even live
UW: 25.0% down · 7.5% · 30yr · 1.5% tax · 5.0% vac · 8.0% maint · 8.0% mgmt
Financing live
Cash to close
- Down payment
- $19,250
- Closing costs
- $2,310
- Reserves months
- —
- Total cash needed
- —
Loan-product check · same deal, 3 products live
Conventional
25% down · 7.5% · 30yr
- Down + closing
- —
- Monthly P&I
- —
- Monthly cashflow
- —
- DSCR
- —
- Eligible?
- —
Personal DTI + credit; lowest rate.
DSCR
20% down · 8.5% · 30yr
- Down + closing
- —
- Monthly P&I
- —
- Monthly cashflow
- —
- DSCR
- —
- Eligible?
- —
No personal income docs; deal must DSCR.
Hard money
10% down · 12.0% · 12mo
- Down + closing
- —
- Monthly P&I
- —
- Monthly cashflow
- —
- DSCR
- —
- Eligible?
- —
Short-term bridge; refi at stabilization.
Rent comps 23 comps
| Address | Beds | Baths | Sqft | Rent | $/sqft | DOM | Units | Dist |
|---|---|---|---|---|---|---|---|---|
| 3213 Lee St Unit 3 Columbus, GA | 2.0 | 1.0 | 1100 | $925 | $0.84 | 13d | 1 | 0.19mi |
| 2630 Garden Dr Columbus, GA | 2.0 | 1.0 | 1008 | $755 | $0.75 | 43d | 1 | 0.41mi |
| 2602 Garden Dr Columbus, GA | 3.0 | 2.0 | 1250 | $1,175 | $0.94 | 21d | 1 | 0.48mi |
| 3320 N Lumpkin Rd Columbus, GA | 2.0–3.0 | 2.0 | 1098 | $999 | $0.91 | 13d | 8 | 0.56mi |
| 3390 N Lumpkin Rd Columbus, GA | 2.0–3.0 | 2.0 | 1073 | $999 | $0.93 | 13d | 14 | 0.73mi |
| 1048 Brooks Rd Columbus, GA | 2.0 | 1.0 | 942 | $925 | $0.98 | 21d | 1 | 0.77mi |
| 2983 Buena Vista Rd Columbus, GA | 2.0 | 1.0 | 920 | $735 | $0.80 | 43d | 1 | 0.99mi |
| 3909 Baker Plaza Dr Columbus, GA | 1.0–2.0 | 1.0–2.0 | 869 | $1,010 | $1.16 | 13d | 1 | 0.99mi |
| 564 Chesterfield Ave Columbus, GA | 3.0 | 2.0 | 1230 | $1,100 | $0.89 | 21d | 1 | 1.01mi |
| 243 Oakley Ct Columbus, GA | 1.0–2.0 | 1.0–2.0 | 1005 | $1,149 | $1.14 | 13d | 6 | 1.12mi |
| 2201 Heard St Columbus, GA | 2.0 | 1.0 | 1005 | $975 | $0.97 | 21d | 1 | 1.25mi |
| 1414 Foye Ave Columbus, GA | 2.0 | 1.0 | 1021 | $895 | $0.88 | 13d | 1 | 1.30mi |
| 909 Farr Rd Columbus, GA | 1.0–4.0 | 1.0–1.5 | 1200 | $713 | $0.59 | 21d | 1 | 1.35mi |
| 2728 9th St Columbus, GA | 3.0 | 1.0 | 880 | $865 | $0.98 | 43d | 1 | 1.35mi |
| 2724 9th St Columbus, GA | 2.0 | 1.0 | 900 | $875 | $0.97 | 13d | 1 | 1.36mi |
| 3775 Steam Mill Rd Columbus, GA | 3.0 | 2.0 | 1613 | $2,100 | $1.30 | 43d | 1 | 1.38mi |
| 4225 Alpine Dr Columbus, GA | 2.0 | 1.0 | 1205 | $767 | $0.64 | 13d | 1 | 1.42mi |
| 513 Farr Rd Columbus, GA | 2.0 | 1.0 | 1000 | $968 | $0.97 | 43d | 1 | 1.42mi |
| 2309 Willard St Columbus, GA | 3.0 | 2.0 | 1803 | $1,700 | $0.94 | 13d | 1 | 1.44mi |
| 9 Montclair Ct Unit B Columbus, GA | 2.0 | 1.5 | 959 | $950 | $0.99 | 43d | 1 | 1.44mi |
| 3128 Carver St Columbus, GA | 3.0 | 1.0 | 988 | $925 | $0.94 | 21d | 1 | 1.47mi |
| 3128 Carver St Columbus, GA | 3.0 | 1.0 | 988 | $1,000 | $1.01 | 43d | 1 | 1.47mi |
| 2885 Ramsey Rd Columbus, GA | 3.0 | 2.0 | 1290 | $1,075 | $0.83 | 13d | 1 | 1.49mi |
Listing history 21 events
-
2026-06-18days on market $77,000 Active 132 DOM
-
2026-06-17days on market $77,000 Active 131 DOM
-
2026-06-16days on market $77,000 Active 130 DOM
-
2026-06-15days on market $77,000 Active 129 DOM
-
2026-06-14days on market $77,000 Active 127 DOM
-
2026-06-13days on market $77,000 Active 126 DOM
-
2026-06-10days on market $77,000 Active 124 DOM
-
2026-06-09days on market $77,000 Active 123 DOM
-
2026-06-08days on market $77,000 Active 122 DOM
-
2026-06-07days on market $77,000 Active 121 DOM
-
2026-06-05days on market $77,000 Active 118 DOM
-
2026-06-03days on market $77,000 Active 117 DOM
-
2026-06-02days on market $77,000 Active 116 DOM
-
2026-06-01days on market $77,000 Active 115 DOM
-
2026-05-31days on market $77,000 Active 114 DOM
-
2026-05-30days on market $77,000 Active 113 DOM
-
2026-03-25price $77,000 619-char remark
Show marketing remark (619 chars)
Stable Income-Producing Investment with ARV Upside in Andrews! 2-bedroom, 1-bath ranch-style home offering 1394 sq ft of efficient single-level living. This property is a proven income producer, making it an ideal buy-and-hold investment with immediate cash flow. The functional layout and ranch design support strong tenant demand and low maintenance ownership. Located in the Andrews area, just minutes from Fort Benning, shopping and dining. With solid fundamentals and promising ARV potential, this property offers investors the opportunity to generate steady income today while positioning for future value growth.
-
2026-02-07$79,000 Active 619-char remark
Show marketing remark (619 chars)
Stable Income-Producing Investment with ARV Upside in Andrews! 2-bedroom, 1-bath ranch-style home offering 1394 sq ft of efficient single-level living. This property is a proven income producer, making it an ideal buy-and-hold investment with immediate cash flow. The functional layout and ranch design support strong tenant demand and low maintenance ownership. Located in the Andrews area, just minutes from Fort Benning, shopping and dining. With solid fundamentals and promising ARV potential, this property offers investors the opportunity to generate steady income today while positioning for future value growth.
-
2016-02-25$10,000
-
2007-10-11soldstatus $225,000
-
2007-10-11soldstatus $160,000
ⓘ Source: listings_history table (triggers on properties + properties_extension) + one-shot
backfill from property_details.listing_events for pre-trigger history.
Tax reassessment forecast GA · Resets to sale price
- Current annual tax
- $821 · $68/mo
- Projected year-2 tax
- $821 · $68/mo
- Expected delta
- $0/yr ($0/mo · 0.0%)
ⓘ Screening estimate from a state-policy table — verify with the county assessor before closing.
Climate risk First Street
- Flood 1/10 Low FEMA zone X (unshaded) · 0% chance over 30 yrs
- Wildfire 2/10 Low
- Heat 7/10 Severe 7 d/yr ≥107°F today · 19 d/yr by 30 yrs out
- Wind 6/10 Major 76% chance of damaging wind over 30 yrs
- Air quality 4/10 Moderate 4 unhealthy d/yr today · 5 by 30 yrs out
Nearby sold comps map
Loading sold comps map…
Walkable amenities ~0.75 mi
Loading nearby amenities…
Taxation est. · year 1
- Rental income
- $11,948
- − Mortgage interest
- −$4,313
- − Property taxes
- −$821
- − Insurance
- −$385
- − Repairs & maintenance
- −$956
- − Management
- −$956
- − Depreciation
- −$2,240
- Taxable income
- $2,277
- Est. tax owed @ 24.0%
- −$546
- After-tax cash flow
- $2,841/yr
For passive investors: Depreciation is non-cash, so a rental often shows a tax loss while cash-flowing — sheltering income. Rental losses are passive: they offset passive income freely, and up to $25,000/yr can offset ordinary (W-2) income if you actively participate and your MAGI is under $100k (phasing out to $0 by $150k); unused losses carry forward. On sale, claimed depreciation is recaptured at up to 25%, and gains may owe capital-gains tax (a 1031 exchange can defer both). Figures are a year-1 estimate at your 24.0% rate — not tax advice; consult a CPA.
Schools (NCES district)
- District
- Muscogee County
- NCES district ID
- 1303870
- Math proficiency
- 21% ▼ -11.00%
- Reading proficiency
- 30% ▼ -7.00%
- Median HH income
- $41,176
- Composite
- 21.6/100
- National rank
- #8297
- State rank
- #120 of 174 in GA
Livability — Columbus
- Score
- 64/100
- State rank
- #254
- US rank
- #14102
Category grades
Schools grade is shown separately in the Schools card above.
Census & demographics
- Census place
- Columbus, GA
- County
- Muscogee County · 180,764 people
- City population
- 180,764
- Metro
- Columbus, GA-AL
- Population (ZIP)
- 20,644
- Household income
- $32,401
- Rent vs Own
- Severe rent burden
- 1878.0
Population outlook (Muscogee County) Hauer SSP2
- Today (2025)
- 216,729 people
- By 2030
- 224,504 · +3.6%
- By 2040
- 238,318 · +10.0%
- By 2050
- 249,027 · +14.9%
- By 2075
- 264,862 · +22.2%
- By 2100
- 254,786 · +17.6%
Race, ethnicity, and origin ACS 2023
- Neighborhood character
- Predominantly Black (77%)
- Race & ethnicity
- Black 77% Hispanic / Latino 11% White 9% Two or more races 3% Asian 1%
- Hispanic origin (detail)
- Mexican 6% Puerto Rican 2%
- Foreign-born
- 6% · Canada
- Languages at home
- 88% English-only · Spanish 10% Other Indo-European 1%
Political lean MEDSL · Muscogee
- 2024 margin
- Strong D (+23.4) · D 61.4% · R 38.0%
- 2008→2024 swing
- +3.7pp toward D · 2008: 19.7pp · 2024: 23.4pp
- All cycles
- 2024: D+23.4 2020: D+24.0 2016: D+18.6 2012: D+21.3 2008: D+19.7
Not yet ingested
- Civics
- —
Market trends
- HPI YoY
- ▼ -22.30%
- Current HPI
- 131.4761
- Rent YoY
- ▲ 1.82%
- Metro
- Columbus, GA-AL
- State GDP YoY
- ▲ 2.66%
- F500 in state
- 28
Industry mix (Fortune 500 HQ in GA)
| Industry | F500 HQs | Revenue |
|---|---|---|
| Paper / Packaging | 2 | $29B |
|
||
| Retail | 1 | $160B |
|
||
| Transportation / Logistics | 1 | $91B |
|
||
| Airlines | 1 | $62B |
|
||
| Consumer Goods | 1 | $47B |
|
||
| Utilities | 1 | $25B |
|
||
Price history
-65.8% since first listed5 events — show timeline
- 2026-03-25 Price Changed $77,000 CBOR
- 2026-02-07 Listed $79,000 CBOR
- 2016-02-25 Listed $10,000 CBOR
- 2007-10-11 Sold (Public Records) $160,000 Public Records
- 2007-10-11 Sold (Public Records) $225,000 Public Records
Property tax history
+8.2%/yrLatest (2025): $821 · -15.7% YoY. Source: county tax records.
Cash-flow waterfall
monthlySold comps — $/sqft
last 12 mo · ≤1 miLoading sold comps…