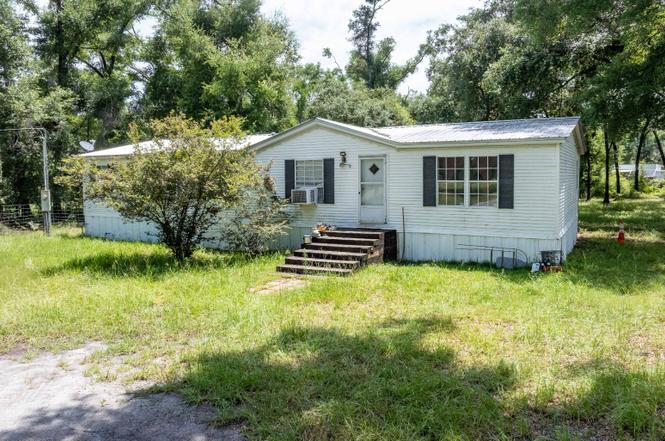
512 NE Beverly Hills Dr · Mayo, FL
Flood risk 1/10 · Minimal
- FEMA flood zone
- AE
- Chance of flooding over 30 yrs
- 0.0%
- Est. flood insurance / yr
- $1,737 – $8,500
Fire risk 7/10 · Major
- Est. fire insurance / yr
- $947 – $1,759
Heat risk 8/10 · Major
- Hot days now (above 108°F)
- 7 days/yr
- Hot days in 30 yrs
- 19 days/yr
Wind risk 9/10 · Severe
- Chance of severe wind over 30 yrs
- 99.0%
Air-quality risk 4/10 · Minor
- Unhealthy air days now
- 5 days/yr
- Unhealthy air days in 30 yrs
- 6 days/yr
Risk factors via First Street. Map © Google.
Why this score? — see what drove the B grade
The composite is a weighted blend of 9 inputs, each scored 0–100. Each bar is that input's sub-score; the figure is the points it added to the 100-point composite (weight × sub-score).
- Cash flow +27.2/30.0
- DSCR +9.4/10.0
- Appreciation +8.4/10.0
- ARV discount +7.5/15.0
- 1% rule +6.1/10.0
- Schools +5.5/10.0
- Livability +3.2/5.0
- Rent growth +2.5/5.0
- Condition / age +2.5/5.0
$89,000
🖨 Deal sheet (PDF) 📄 Offer letter ✓ Due diligence
Listing remarks
Looking for your next investment opportunity? This 3-bedroom, 2-bath home offers plenty of potential for a rental property, vacation getaway, or flip project with a little TLC. Situated on a beautiful one-acre lot shaded by mature trees, the property provides privacy and a peaceful setting while still being conveniently located near the heart of Mayo. Located in the Retirement Haven subdivision with no deed restrictions, you'll have the flexibility to make the property your own. Its close proximity to the Suwannee River, crystal-clear freshwater springs, and endless outdoor recreation makes it an attractive option for both short-term and long-term rental income. Whether you're targeting vac
Key facts
- One acre lot
- No deed restrictions
- Mature trees
Tags
Property features AI
Exterior
- Parking: 3-car garage
- Utilities: Private well water
- Home design: Manufactured home; Single-story; Residential property
- Construction: Frame construction
- Exterior features: Metal roof; Situated on a 1-acre lot; Zoned residential
Interior
- Kitchen: No appliance details provided
- Bedrooms: Single-story layout (bedrooms on main level)
- Flooring: Carpet; Vinyl
- Bathrooms: 2 full bathrooms
- Heating & cooling: Central heating (electric); Central air conditioning; Ceiling fan(s)
- Interior features: Carpet and vinyl flooring; Ceiling fans
- Laundry & utility: No laundry details provided
Neighborhood map
What this means for you Summary
Snapshot
- This is a 3-bed/2.0-bath manufactured listed at $89k.
Deal economics
- At list price, monthly cash flow is $-173 ($-2k/yr) — negative.
- To cash-flow at today's rent, offer at most $59k (34.2% below list).
- Meets the 1% rule at list price ($985 rent vs $89k).
- Recommended offer: $59k (34.2% below list) — sets the bar for cash-flow.
- Cap rate 9.7% vs local median 2.2% in Mayo — top-decile yield for the area; either an underpriced asset or a hidden risk that comps aren't pricing in. Stress-test before assuming the spread holds.
Location & tenants
- Location reads 63/100 on livability (#740 in FL) — a middle-class / working-renter tenant base. Strengths: cost of living A+, health & safety A+, crime A; Watch: amenities F, commute F, employment F.
- Lafayette (rural): math 73% / reading 57% proficiency, ranked #6 of 73 in FL (top 8%) — acceptable for families but not a draw, mixed tenant base, ~2y average lease.
- Zoned schools: Lafayette Elementary School (math 78% / reading 58%, grade B+, #425 of 2,144 statewide, top 20%, 515 students, 63% FRL).
- Market conditions: 78 active listings in the ZIP; 42 units permitted in Lafayette County in 2024 (0 in 5+ unit buildings).
Forward outlook
- In year one you build about $7k of equity ($615 loan paydown + $6k appreciation (6.9% local appreciation)).
- By year 6, paydown + projected appreciation supports a ~$37k cash-out refi (75% LTV) — recoverable capital for the next deal without selling this one.
Negotiation context
- Only 5 days on market — expect competitive offers; lowballing is unlikely to land.
Risks & watch-outs
- Watch-outs: flood insurance adds $427/mo.
- Climate carrying-cost: in FEMA flood zone AE (mandatory federal flood insurance); severe wind risk, 99% chance of damaging wind over 30y; major wildfire risk; extreme-heat days projected 7→19/yr by 2055 (HVAC capex compounding) — expect insurance premiums to compound above CPI over the hold.
Questions for the listing agent
- What do current leases actually rent for vs. the listed asking? Can we see a recent rent roll and the last 12 months of T-12 income?
- What's the actual annual flood-insurance premium (NFIP or private), and is the property in a SFHA with mandatory coverage?
- Is there a deadline driving the sale (1031 exchange, divorce, estate, relocation)? That informs how much negotiation room exists.
- What's the average days-on-market for RENTAL listings here right now (not sales)? A rising rental-DOM trend means longer vacancies and softer asking-rent achievability than the comps imply.
- What's the recent tenant-quality profile in this submarket — average credit score on applications, eviction rate, late-payment / NSF rate, and stable-employment percentage? A property-management company in the area should have these aggregated.
- How much new for-sale + rental construction is in the pipeline within 1–3 miles? Heavy new supply typically softens prices + rents 12–24 months out; constrained supply supports both.
Investment metrics
- 1% rule
- 1.11% ✓
- Cap rate
- 9.72%
- Cash-on-cash
- 12.23%
- DSCR
- 1.54
- GRM
- 7.5
CMA / ARV
No comps found within radius.
Projected returns pro-forma
6.89% appreciation · 3.0% rent growth · sell at horizon
- IRR
- 11.1%
- Equity multiple
- 1.79×
- Total profit
- $19,690
- Equity at exit
- $61,014
- IRR
- 12.1%
- Equity multiple
- 3.65×
- Total profit
- $65,968
- Equity at exit
- $115,306
Cash invested: $24,920 (down + closing). Projections, not guarantees.
Landlord ↔ Tenant lean methodology
- Overall (STATE)
- 87 Strongly Landlord-Friendly
- State Florida
- 87 Strongly Landlord-Friendly · R+3
- County
- — inherits STATE
- City
- — inherits STATE
ZIP-level market 32066
- Home prices YoY
- 2.3%
- Active inventory
- 78
- Price-to-rent
- 7.5×
Monthly cashflow live
- Estimated rent
- $985 medium interval (Pro) →
- Mortgage (P&I)
- −$467
- Tax from tax record
- −$20 /mo · $243/yr
- Insurance
- −$37
- Flood insurance flood zone
- −$427 /mo · $5,118/yr
- HOA
- −$0
- Lot rent leased land?
- −$0
- Vacancy / Maint / Mgmt
- −$207
- Net cashflow
- $-173
Break-even live
Sensitivity live
| Price | -10% $-122 | -5% $-147 | +0% $-173 | +5% $-198 | +10% $-223 |
|---|---|---|---|---|---|
| Rent | -10% $-250 | -5% $-211 | +0% $-173 | +5% $-134 | +10% $-95 |
| Rate | -1.0pp $-128 | -0.5pp $-150 | base $-173 | +0.5pp $-196 | +1.0pp $-219 |
UW: 25.0% down · 7.5% · 30yr · 1.5% tax · 5.0% vac · 8.0% maint · 8.0% mgmt
Financing live
Cash to close
- Down payment
- $22,250
- Closing costs
- $2,670
- Reserves months
- —
- Total cash needed
- —
Loan-product check · same deal, 3 products live
Conventional
25% down · 7.5% · 30yr
- Down + closing
- —
- Monthly P&I
- —
- Monthly cashflow
- —
- DSCR
- —
- Eligible?
- —
Personal DTI + credit; lowest rate.
DSCR
20% down · 8.5% · 30yr
- Down + closing
- —
- Monthly P&I
- —
- Monthly cashflow
- —
- DSCR
- —
- Eligible?
- —
No personal income docs; deal must DSCR.
Hard money
10% down · 12.0% · 12mo
- Down + closing
- —
- Monthly P&I
- —
- Monthly cashflow
- —
- DSCR
- —
- Eligible?
- —
Short-term bridge; refi at stabilization.
Listing history 5 events
-
2026-06-22days on market $89,000 Active 5 DOM
-
2026-06-21days on market $89,000 Active 4 DOM
-
2026-06-21days on market $89,000 Active 3 DOM
-
2026-06-18remarks 699-char remark
-
2026-06-18$89,000 Active 1 DOM
ⓘ Source: listings_history table (triggers on properties + properties_extension) + one-shot
backfill from property_details.listing_events for pre-trigger history.
Tax reassessment forecast FL · Resets to sale price
- Current annual tax
- $243 · $20/mo
- Projected year-2 tax
- $739 · $62/mo
- Expected delta
- +$496/yr (+$41/mo · 203.9%)
ⓘ Screening estimate from a state-policy table — verify with the county assessor before closing.
Climate risk First Street
- Flood 1/10 Low FEMA zone AE · 0% chance over 30 yrs
- Wildfire 7/10 Severe
- Heat 8/10 Severe 7 d/yr ≥108°F today · 19 d/yr by 30 yrs out
- Wind 9/10 Extreme 99% chance of damaging wind over 30 yrs
- Air quality 4/10 Moderate 5 unhealthy d/yr today · 6 by 30 yrs out
Nearby sold comps map
Loading sold comps map…
Walkable amenities ~0.75 mi
Loading nearby amenities…
Taxation est. · year 1
- Rental income
- $11,819
- − Mortgage interest
- −$4,985
- − Property taxes
- −$243
- − Insurance
- −$5,564
- − Repairs & maintenance
- −$946
- − Management
- −$946
- − Depreciation
- −$2,589
- Taxable loss
- −$3,453
- Est. tax savings @ 24.0%
- +$829
- After-tax cash flow
- $-1,242/yr
For passive investors: Depreciation is non-cash, so a rental often shows a tax loss while cash-flowing — sheltering income. Rental losses are passive: they offset passive income freely, and up to $25,000/yr can offset ordinary (W-2) income if you actively participate and your MAGI is under $100k (phasing out to $0 by $150k); unused losses carry forward. On sale, claimed depreciation is recaptured at up to 25%, and gains may owe capital-gains tax (a 1031 exchange can defer both). Figures are a year-1 estimate at your 24.0% rate — not tax advice; consult a CPA.
Schools (NCES district)
- District
- Lafayette
- NCES district ID
- 1201020
- Math proficiency
- 73% ▲ 2.00%
- Reading proficiency
- 57% ▼ -1.00%
- Median HH income
- $42,317
- Composite
- 54.57/100
- National rank
- #1341
- State rank
- #6 of 73 in FL
Livability — Mayo
- Score
- 63/100
- State rank
- #740
- US rank
- #15981
Category grades
Schools grade is shown separately in the Schools card above.
Census & demographics
- Population (ZIP)
- 6,881
Population outlook (Lafayette County) Hauer SSP2
- Today (2025)
- 8,368 people
- By 2030
- 8,360 · -0.1%
- By 2040
- 8,367 · +-0.0%
- By 2050
- 8,285 · -1.0%
- By 2075
- 7,623 · -8.9%
- By 2100
- 6,186 · -26.1%
Race, ethnicity, and origin ACS 2023
- Neighborhood character
- Predominantly White (69%)
- Race & ethnicity
- White 69% Black 20% Hispanic / Latino 10% Two or more races 4%
- Hispanic origin (detail)
- Mexican 6% Cuban 2%
- Common ancestry
- Iranian 1% Slovak 1% Hispanic 1%
- Foreign-born
- 5% · Canada, Jamaica
- Languages at home
- 92% English-only · Spanish 8%
Political lean MEDSL · Lafayette
- 2024 margin
- Solid R (+76.0) · D 11.7% · R 87.8%
- 2008→2024 swing
- -15.4pp toward R · 2008: -60.6pp · 2024: -76.0pp
- All cycles
- 2024: R+76.0 2020: R+71.6 2016: R+67.5 2012: R+58.3 2008: R+60.6
Not yet ingested
- Civics
- —
Market trends
- HPI YoY
- ▲ 6.89%
- Current HPI
- 309.4384
- Rent YoY
- —
- Metro
- —
- State GDP YoY
- ▲ 3.28%
- F500 in state
- 36
Industry mix (Fortune 500 HQ in FL)
| Industry | F500 HQs | Revenue |
|---|---|---|
| Industrial Technology | 2 | $29B |
|
||
| Insurance | 2 | $17B |
|
||
| Retail | 1 | $60B |
|
||
| Technology Distribution | 1 | $58B |
|
||
| Homebuilding | 1 | $35B |
|
||
| Technology Manufacturing | 1 | $35B |
|
||
Price history
1 event — show timeline
- 2026-06-17 Listed $89,000 NFMLS
Property tax history
+3.0%/yrLatest (2025): $243 · -9.8% YoY. Source: county tax records.
Cash-flow waterfall
monthlySold comps — $/sqft
last 12 mo · ≤1 miLoading sold comps…