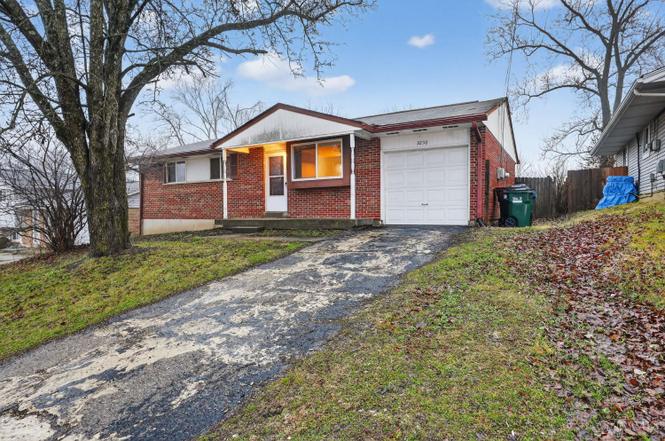
3250 Springdale Rd · Northgate, OH
Flood risk 1/10 · Minimal
- FEMA flood zone
- X (unshaded)
- Chance of flooding over 30 yrs
- 0.0%
- Est. flood insurance / yr
- $473 – $860
Fire risk 1/10 · Minimal
- Est. fire insurance / yr
- $713 – $1,323
Heat risk 4/10 · Minor
- Hot days now (above 103°F)
- 7 days/yr
- Hot days in 30 yrs
- 19 days/yr
Wind risk 2/10 · Minimal
- Chance of severe wind over 30 yrs
- 1.0%
Air-quality risk 4/10 · Minor
- Unhealthy air days now
- 4 days/yr
- Unhealthy air days in 30 yrs
- 6 days/yr
Risk factors via First Street. Map © Google.
Why this score? — see what drove the C+ grade
The composite is a weighted blend of 9 inputs, each scored 0–100. Each bar is that input's sub-score; the figure is the points it added to the 100-point composite (weight × sub-score).
- Cash flow +24.1/30.0
- ARV discount +9.6/15.0
- DSCR +7.8/10.0
- 1% rule +6.6/10.0
- Livability +4.2/5.0
- Schools +3.7/10.0
- Rent growth +2.5/5.0
- Condition / age +2.5/5.0
- Appreciation +0.0/10.0
$149,900
🖨 Deal sheet (PDF) 📄 Offer letter ✓ Due diligence
Listing remarks MLS
3 Bedroom 1 full bath ranch with a 1 car attached garage... Full finished basement with an addition full bath
Key facts
- Covered front porch
- Combined dining area
- Fenced yard
Tags
Property features AI
Finance
- Other: Lease not considered
- HOA & community: No HOA
Exterior
- Parking: Attached garage with 1 garage space
- Utilities: Public water; Public sewer; Water heater listed as other
- Home design: Transitional architectural style; Single-family home; One level
- Construction: Block foundation
- Exterior features: Shingle roof; Brick construction; Window features noted as other; Residential zoning
Interior
- Kitchen: Kitchen approximately 13 x 8; Dishwasher; Oven/Range; Refrigerator; Dining room approximately 11 x 10
- Bedrooms: Three bedrooms (all on main level); Primary bedroom approximately 14 x 11; Second bedroom approximately 10 x 11; Third bedroom approximately 11 x 11
- Bathrooms: One full bathroom on main level; One half bathroom
- Heating & cooling: Baseboard heating; Central air conditioning
- Interior features: Six total rooms; Full basement with additional features
- Laundry & utility: Basement utilities (details listed as other)
Neighborhood map
What this means for you Summary
Snapshot
- This is a 3-bed/1.0-bath single-family listed at $150k.
Deal economics
- At list price, monthly cash flow is $295 ($4k/yr) — positive.
- The deal already cash-flows at list — no discount required.
- Meets the 1% rule at list price ($2k rent vs $150k).
- Recommended offer: $136k (9.0% below list) — sets the bar for market timing.
Location & tenants
- Location reads 84/100 on livability (#55 in OH, #761 nationally) — a professional / high-income tenant draw. Strengths: commute A+, cost of living A+, housing A+; Watch: schools C-, employment C-.
- Northwest Local (suburban): math 38% / reading 46% proficiency, ranked #508 of 656 in OH (top 77%) — families likely to look elsewhere, expect single-tenant / working-renter base with shorter leases.
- Market conditions: 53 active listings in the ZIP; 4 comparable units currently listed for rent nearby; rentals leasing fast (median 13d on market — plan ~1-2 weeks tenant-placement turnaround); 801 units permitted in Hamilton County in 2024 (190 in 5+ unit buildings).
Forward outlook
- Local home prices are declining (-3.0%/yr); year-one equity from $1k of loan paydown is wiped out by about $4k of value loss. Plan a longer hold.
Negotiation context
- It's been on market 103 days — a 9% lower offer ($136k) is reasonable based on typical stale-listing flexibility.
- 3 sale attempts since 20y ago; this cycle's ask has dropped $40k (21%) from the opening price — seller is motivated, your offer sets the floor, not the list.
Questions for the listing agent
- It's been on market 103 days. Have you received any prior offers? Is the seller open to a 9% concession, seller financing, or rate buy-down credit?
- Built in 1969 — when were the roof, HVAC, electrical panel, plumbing, and water heater last replaced?
- Why hasn't it sold? Are there any deal-killer items the seller is aware of (foundation, flood, title, zoning, code violations)?
- Is there a deadline driving the sale (1031 exchange, divorce, estate, relocation)? That informs how much negotiation room exists.
- What's the average days-on-market for RENTAL listings here right now (not sales)? A rising rental-DOM trend means longer vacancies and softer asking-rent achievability than the comps imply.
- What's the recent tenant-quality profile in this submarket — average credit score on applications, eviction rate, late-payment / NSF rate, and stable-employment percentage? A property-management company in the area should have these aggregated.
- How much new for-sale + rental construction is in the pipeline within 1–3 miles? Heavy new supply typically softens prices + rents 12–24 months out; constrained supply supports both.
Investment metrics
- 1% rule
- 1.16% ✓
- Cap rate
- 8.66%
- Cash-on-cash
- 8.44%
- DSCR
- 1.38
- GRM
- 7.2
CMA / ARV
- ARV (on-the-fly)
- $157,248
- Comps found
- 7
Show comp detail 7 sales within ~0.75 mi
| Address | Dist | Beds/Ba | Sqft | Sold | Price | $/sf | Match |
|---|---|---|---|---|---|---|---|
| 9852 Wiscasset Way | 0.64mi | 3/1.0 | 925 (-1%) | 0mo | $108,000 | $117 | 68 |
| 10130 Manistee Way | 0.53mi | 3/1.0 | 925 (-1%) | 13mo | $155,000 | $168 | 63 |
| 9737 Dunraven Dr | 0.71mi | 3/1.0 | 925 (-1%) | 7mo | $182,000 | $197 | 59 |
| 9671 Dunraven Dr | 0.66mi | 3/1.0 | 925 (-1%) | 11mo | $150,000 | $162 | 58 |
| 9660 Dunraven Dr | 0.63mi | 3/1.0 | 925 (-1%) | 18mo | $161,000 | $174 | 54 |
| 10088 Sturgeon Ln | 0.65mi | 3/1.0 | 900 (-4%) | 17mo | $165,000 | $183 | 49 |
| 9712 Dunraven Dr | 0.67mi | 3/1.5 | 925 (-1%) | 23mo | $150,000 | $162 | 45 |
Match score weights: distance 35% · size 25% · config 20% · recency 20%. Top-matched comps best support the ARV.
Projected returns pro-forma
-3.0% appreciation · 3.0% rent growth · sell at horizon
- IRR
- -3.5%
- Equity multiple
- 0.87×
- Total profit
- $-5,445
- Equity at exit
- $22,351
- IRR
- 6.3%
- Equity multiple
- 1.47×
- Total profit
- $19,666
- Equity at exit
- $12,961
Cash invested: $41,972 (down + closing). Projections, not guarantees.
Landlord ↔ Tenant lean methodology
- Overall (STATE)
- 73 Landlord-Friendly
- State Ohio
- 73 Landlord-Friendly · R+6
- County
- — inherits STATE
- City
- — inherits STATE
ZIP-level market 45251
- Active inventory
- 53
- Price-to-rent
- 7.2×
Monthly cashflow live
- Estimated rent
- $1,735 medium interval (Pro) →
- Mortgage (P&I)
- −$786
- Tax from tax record
- −$227 /mo · $2,723/yr
- Insurance
- −$62
- HOA
- −$0
- Vacancy / Maint / Mgmt
- −$364
- Net cashflow
- $295
Break-even live
Sensitivity live
| Price | -10% $380 | -5% $338 | +0% $295 | +5% $253 | +10% $210 |
|---|---|---|---|---|---|
| Rent | -10% $158 | -5% $227 | +0% $295 | +5% $364 | +10% $432 |
| Rate | -1.0pp $371 | -0.5pp $333 | base $295 | +0.5pp $256 | +1.0pp $217 |
UW: 25.0% down · 7.5% · 30yr · 1.5% tax · 5.0% vac · 8.0% maint · 8.0% mgmt
Financing live
Cash to close
- Down payment
- $37,475
- Closing costs
- $4,497
- Reserves months
- —
- Total cash needed
- —
Loan-product check · same deal, 3 products live
Conventional
25% down · 7.5% · 30yr
- Down + closing
- —
- Monthly P&I
- —
- Monthly cashflow
- —
- DSCR
- —
- Eligible?
- —
Personal DTI + credit; lowest rate.
DSCR
20% down · 8.5% · 30yr
- Down + closing
- —
- Monthly P&I
- —
- Monthly cashflow
- —
- DSCR
- —
- Eligible?
- —
No personal income docs; deal must DSCR.
Hard money
10% down · 12.0% · 12mo
- Down + closing
- —
- Monthly P&I
- —
- Monthly cashflow
- —
- DSCR
- —
- Eligible?
- —
Short-term bridge; refi at stabilization.
Rent comps 4 comps
| Address | Beds | Baths | Sqft | Rent | $/sqft | DOM | Units | Dist |
|---|---|---|---|---|---|---|---|---|
| 10101 Arborwood Dr Cincinnati, OH | 1.0–3.0 | 1.0–1.5 | 912 | $1,649 | $1.81 | 2d | 26 | 0.20mi |
| 10220 September Dr Cincinnati, OH | 4.0 | 1.0 | 1025 | $1,890 | $1.84 | 13d | 1 | 0.21mi |
| 2753 Town Terrace Dr Cincinnati, OH | 2.0–3.0 | 1.0–1.5 | 968 | $1,450 | $1.50 | 21d | 4 | 0.73mi |
| 9333 Round Top Cincinnati, OH | 1.0–3.0 | 1.0–2.0 | 979 | $1,623 | $1.66 | 2d | 3 | 1.11mi |
Listing history 26 events
-
2026-06-18days on market $149,900 Active 103 DOM
-
2026-06-17days on market $149,900 Active 102 DOM
-
2026-06-16days on market $149,900 Active 101 DOM
-
2026-06-15days on market $149,900 Active 100 DOM
-
2026-06-13days on market $149,900 Active 98 DOM
-
2026-06-12pricedays on market $149,900 Active 97 DOM
-
2026-06-09days on market $162,900 Active 94 DOM
-
2026-06-08days on market $162,900 Active 93 DOM
-
2026-06-08days on market $162,900 Active 92 DOM
-
2026-06-07days on market $162,900 Active 91 DOM
-
2026-06-04days on market $162,900 Active 88 DOM
-
2026-06-02days on market $162,900 Active 87 DOM
-
2026-06-01price $162,900 Active 86 DOM
-
2026-06-01days on market $169,900 Active 86 DOM
-
2026-05-31days on market $169,900 Active 85 DOM
-
2026-05-16price $169,900
-
2026-05-09price $179,900
-
2026-03-07$189,900 Active
-
2024-11-22soldstatus $10,637,000
-
2015-04-03historical 109-char remark
Show marketing remark (109 chars)
3 Bedroom 1 full bath ranch with a 1 car attached garage... Full finished basement with an addition full bath
-
2015-02-19soldstatus $43,000 Sold 109-char remark
Show marketing remark (109 chars)
3 Bedroom 1 full bath ranch with a 1 car attached garage... Full finished basement with an addition full bath
-
2015-02-02historical 109-char remark
Show marketing remark (109 chars)
3 Bedroom 1 full bath ranch with a 1 car attached garage... Full finished basement with an addition full bath
-
2014-11-13$56,400 109-char remark
Show marketing remark (109 chars)
3 Bedroom 1 full bath ranch with a 1 car attached garage... Full finished basement with an addition full bath
-
2006-04-18soldstatus $90,000
-
2006-04-10soldstatus $90,000 139-char remark
Show marketing remark (139 chars)
4BR ranch with fin basement. 2 full ba, 1-car garage. All appliances stay. Living room w/garden window. Has newer roof, a/c, gutter guards.
-
2006-03-02$92,900 139-char remark
Show marketing remark (139 chars)
4BR ranch with fin basement. 2 full ba, 1-car garage. All appliances stay. Living room w/garden window. Has newer roof, a/c, gutter guards.
ⓘ Source: listings_history table (triggers on properties + properties_extension) + one-shot
backfill from property_details.listing_events for pre-trigger history.
Tax reassessment forecast OH · Partial reset (capped growth)
- Current annual tax
- $2,723 · $227/mo
- Projected year-2 tax
- $2,723 · $227/mo
- Expected delta
- $0/yr ($0/mo · 0.0%)
ⓘ Screening estimate from a state-policy table — verify with the county assessor before closing.
Climate risk First Street
- Flood 1/10 Low FEMA zone X (unshaded) · 0% chance over 30 yrs
- Wildfire 1/10 Low
- Heat 4/10 Moderate 7 d/yr ≥103°F today · 19 d/yr by 30 yrs out
- Wind 2/10 Low 100% chance of damaging wind over 30 yrs
- Air quality 4/10 Moderate 4 unhealthy d/yr today · 6 by 30 yrs out
Nearby sold comps map
Loading sold comps map…
Walkable amenities ~0.75 mi
Loading nearby amenities…
Taxation est. · year 1
- Rental income
- $20,819
- − Mortgage interest
- −$8,397
- − Property taxes
- −$2,723
- − Insurance
- −$750
- − Repairs & maintenance
- −$1,666
- − Management
- −$1,666
- − Depreciation
- −$4,361
- Taxable income
- $1,258
- Est. tax owed @ 24.0%
- −$302
- After-tax cash flow
- $3,239/yr
For passive investors: Depreciation is non-cash, so a rental often shows a tax loss while cash-flowing — sheltering income. Rental losses are passive: they offset passive income freely, and up to $25,000/yr can offset ordinary (W-2) income if you actively participate and your MAGI is under $100k (phasing out to $0 by $150k); unused losses carry forward. On sale, claimed depreciation is recaptured at up to 25%, and gains may owe capital-gains tax (a 1031 exchange can defer both). Figures are a year-1 estimate at your 24.0% rate — not tax advice; consult a CPA.
Schools (NCES district)
- District
- Northwest Local
- NCES district ID
- 3904736
- Math proficiency
- 38% ▼ -18.00%
- Reading proficiency
- 46% ▼ -10.00%
- Median HH income
- $58,765
- Composite
- 36.97/100
- National rank
- #4528
- State rank
- #508 of 656 in OH
Livability — Northgate
- Score
- 84/100
- State rank
- #55
- US rank
- #761
Category grades
Schools grade is shown separately in the Schools card above.
Census & demographics
- Census place
- Northgate, OH
- County
- Hamilton County · 701,295 people
- Metro
- Cincinnati, OH-KY-IN
- Population (ZIP)
- 20,254
- Household income
- $74,614
- Rent vs Own
- Severe rent burden
- 442.0
Population outlook (Hamilton County) Hauer SSP2
- Today (2025)
- 826,054 people
- By 2030
- 830,947 · +0.6%
- By 2040
- 832,319 · +0.8%
- By 2050
- 822,428 · -0.4%
- By 2075
- 788,688 · -4.5%
- By 2100
- 710,674 · -14.0%
Race, ethnicity, and origin ACS 2023
- Neighborhood character
- Diverse neighborhood (Simpson 0.57)
- Race & ethnicity
- White 56% Black 34% Two or more races 6% Hispanic / Latino 3% Asian 2%
- Common ancestry
- Iranian 1% Italian 1% Lithuanian 1%
- Foreign-born
- 4% · Canada, China
- Languages at home
- 94% English-only · Spanish 2% Other Asian/Pacific 1% Chinese 1%
Political lean MEDSL · Hamilton
- 2024 margin
- D (+14.9) · D 57.0% · R 42.1%
- 2008→2024 swing
- +7.9pp toward D · 2008: 7.0pp · 2024: 14.9pp
- All cycles
- 2024: D+14.9 2020: D+15.9 2016: D+9.5 2012: D+4.9 2008: D+7.0
Not yet ingested
- Civics
- —
Market trends
- HPI YoY
- ▼ -222.27%
- Current HPI
- 232.8505
- Rent YoY
- —
- Metro
- Cincinnati, OH-KY-IN
- State GDP YoY
- ▲ 1.98%
- F500 in state
- 48
Industry mix (Fortune 500 HQ in OH)
| Industry | F500 HQs | Revenue |
|---|---|---|
| Insurance | 3 | $145B |
|
||
| Industrial Machinery | 3 | $49B |
|
||
| Financial Services | 3 | $24B |
|
||
| Consumer Goods | 2 | $93B |
|
||
| Aerospace / Defense | 2 | $47B |
|
||
| Utilities | 2 | $33B |
|
||
Price history
+82.9% since first listed11 events — show timeline
- 2026-05-16 Price Changed $169,900 Cincy MLS
- 2026-05-09 Price Changed $179,900 Cincy MLS
- 2026-03-07 Listed $189,900 Cincy MLS
- 2024-11-22 Sold (Public Records) $10,637,000 Public Records
- 2015-04-03 Listing Removed — Cincy MLS
- 2015-02-19 Sold (MLS) $43,000 Cincy MLS
- 2015-02-02 Listing Removed — Cincy MLS
- 2014-11-13 Listed $56,400 Cincy MLS
- 2006-04-18 Sold (Public Records) $90,000 Public Records
- 2006-04-10 Sold (MLS) $90,000 Cincy MLS
- 2006-03-02 Listed $92,900 Cincy MLS
Property tax history
+4.4%/yrLatest (2025): $2,723 · +5.0% YoY. Source: county tax records.
Cash-flow waterfall
monthlySold comps — $/sqft
last 12 mo · ≤1 miLoading sold comps…