 🏗️ New Construction
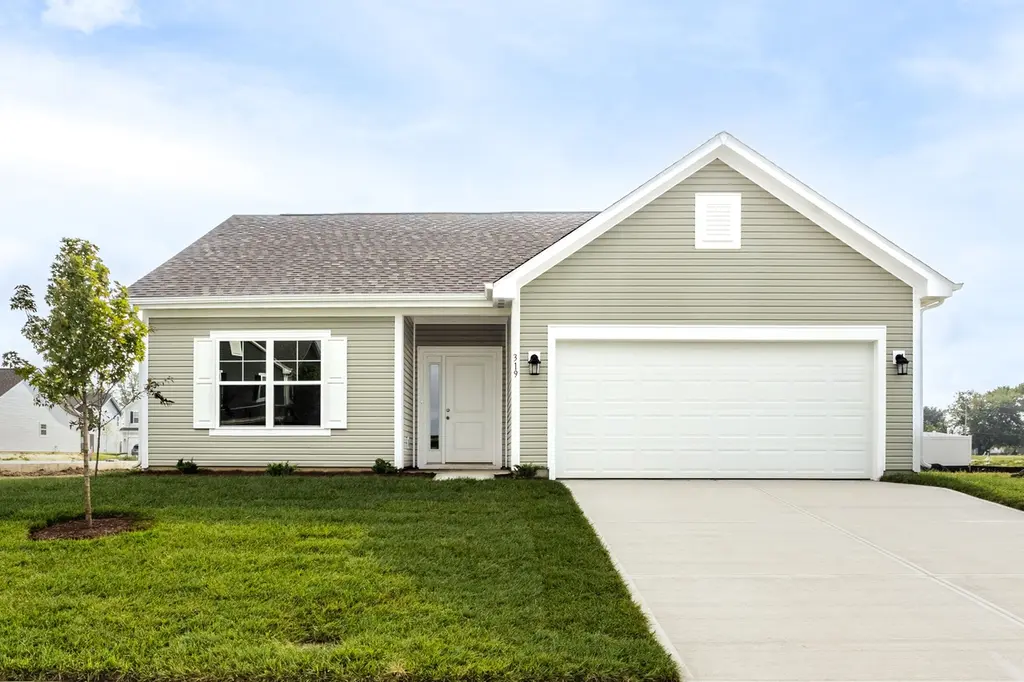
Walnut Plan · South Lebanon, OH
Flood risk No data
- FEMA flood zone
- —
- Chance of flooding over 30 yrs
- —
- Est. flood insurance / yr
- —
Fire risk No data
- Est. fire insurance / yr
- —
Heat risk No data
- Hot days now (above threshold)
- —
- Hot days in 30 yrs
- —
Wind risk No data
- Chance of severe wind over 30 yrs
- —
Air-quality risk No data
- Unhealthy air days now
- —
- Unhealthy air days in 30 yrs
- —
Risk factors via First Street. Map © Google.
Why this score? — see what drove the C grade
The composite is a weighted blend of 9 inputs, each scored 0–100. Each bar is that input's sub-score; the figure is the points it added to the 100-point composite (weight × sub-score).
- Cash flow +13.0/30.0
- Appreciation +10.0/10.0
- ARV discount +7.5/15.0
- Schools +6.1/10.0
- Rent growth +4.4/5.0
- Condition / age +4.0/5.0
- DSCR +3.9/10.0
- 1% rule +3.7/10.0
- Livability +3.7/5.0
$328,990
🖨 Deal sheet (PDF) 📄 Offer letter ✓ Due diligence
Listing remarks MLS
Step into the charm and affordability of our Walnut floor plan, where homeownership dreams come to life in the inviting embrace of this 1,210 sq ft home. This modest yet versatile design opens the door to a world of possibilities with multiple structural options and diverse exterior styles, allowing you to infuse your personal touch and make the Walnut uniquely yours. Boasting three bedrooms and two full bathrooms, the Walnut floor plan is the perfect starting place. The layout offers an easy-flowing arrangement that enhances both functionality and aesthetics. Picture yourself moving through the foyer into the open-concept Great Room and Kitchen, featuring a dining nook for sharing meals together. Add on the sunroom extension to enjoy sunny days and crisp nights cozied up with a book. Whether you're entertaining guests or enjoying a quiet night in, the Walnut provides a versatile backdrop for the moments that matter most. From upgraded finishes to personalized spaces, this floor plan adapts effortlessly to your lifestyle. Make your homeownership journey truly yours with The Walnut!
Key facts
- Upgraded finishes
- Sunroom extension
- Dining nook
Tags
Neighborhood map
What this means for you Summary
Snapshot
- This is a 3-bed/2.0-bath single-family listed at $329k. Condition is rated good.
Deal economics
- At list price, monthly cash flow is $-18 ($-218/yr) — negative.
- To cash-flow at today's rent, offer at most $318k (3.3% below list).
- To meet the 1% rule (rent ≥ 1% of price), the offer needs to be $278k (15.4% below list).
- Recommended offer: $278k (15.4% below list) — sets the bar for 1% rule.
- Cap rate 6.2% vs local median 3.5% in South Lebanon — top-decile yield for the area; either an underpriced asset or a hidden risk that comps aren't pricing in. Stress-test before assuming the spread holds.
Location & tenants
- Location reads 74/100 on livability (#279 in OH, #4,589 nationally) — a middle-class / working-renter tenant base. Strengths: crime A+, employment A+, cost of living A+; Watch: amenities F, commute F, health & safety F.
- Little Miami Local (rural): math 67% / reading 70% proficiency, ranked #140 of 656 in OH (top 21%) — acceptable for families but not a draw, mixed tenant base, ~2y average lease; only 17% free/reduced lunch — higher-income household profile.
- Zoned schools: Little Miami Primary School (math 76% / reading 65%, grade A-, #376 of 1,584 statewide, top 24%, 855 students, 18% FRL); Little Miami Middle School (math 67% / reading 72%, grade A, #143 of 654 statewide, top 23%, 1,279 students, 16% FRL); Little Miami High School (math 52% / reading 81%, grade B, #150 of 781 statewide, top 20%, 1,445 students, 14% FRL) — zoned schools at 16% FRL track the district average.
- Market conditions: Rents rising fast (+7.4%/yr); 130 active listings in the ZIP; 1 comparable units currently listed for rent nearby; solid renter incomes; 1,224 units permitted in Warren County in 2024 (474 in 5+ unit buildings).
- This rent runs 31% of the median local income ($109k/yr) — at the standard rent-burdened threshold; future hikes will face affordability resistance.
Forward outlook
- In year one you build about $34k of equity ($2k loan paydown + $32k appreciation (10.0% local appreciation)).
- Warren County population projected at +16% by 2050 — long-run rental-demand tailwind backs the buy-and-hold thesis.
- At projected returns (10.0% appreciation + 7.4% rent growth), your $90k cash investment doubles in ~3 years — after that, you're playing with house money.
- By year 2, paydown + projected appreciation supports a ~$55k cash-out refi (75% LTV) — recoverable capital for the next deal without selling this one.
Negotiation context
- It's been on market 264 days — a 12% lower offer ($290k) is reasonable based on typical stale-listing flexibility.
Questions for the listing agent
- What do current leases actually rent for vs. the listed asking? Can we see a recent rent roll and the last 12 months of T-12 income?
- It's been on market 264 days. Have you received any prior offers? Is the seller open to a 15% concession, seller financing, or rate buy-down credit?
- Why hasn't it sold? Are there any deal-killer items the seller is aware of (foundation, flood, title, zoning, code violations)?
- Is there a deadline driving the sale (1031 exchange, divorce, estate, relocation)? That informs how much negotiation room exists.
- Schools are F-rated, which usually means shorter tenancies and higher turnover. Who's the typical renter profile here, and what's been the actual vacancy rate?
- What's the average days-on-market for RENTAL listings here right now (not sales)? A rising rental-DOM trend means longer vacancies and softer asking-rent achievability than the comps imply.
- What's the recent tenant-quality profile in this submarket — average credit score on applications, eviction rate, late-payment / NSF rate, and stable-employment percentage? A property-management company in the area should have these aggregated.
- How much new for-sale + rental construction is in the pipeline within 1–3 miles? Heavy new supply typically softens prices + rents 12–24 months out; constrained supply supports both.
Investment metrics
- 1% rule
- 0.87% ✗
- Cap rate
- 6.23%
- Cash-on-cash
- -0.24%
- DSCR
- 0.99
- GRM
- 9.6
CMA / ARV
- ARV (median comp)
- $320,841
- List price
- $328,990
- Delta
- 2.54%
- Verdict
- FAIR
- Comps
- 20 within 1.0 mi
Show comp detail 10 sales within ~0.75 mi
| Address | Dist | Beds/Ba | Sqft | Sold | Price | $/sf | Match |
|---|---|---|---|---|---|---|---|
| 6141 Glenarbor Dr | 0.27mi | 2/2.0 (-1) | 1,235 (+1%) | 11mo | $275,000 | $223 | 73 |
| 630 Weeping Willow Ln | 0.49mi | 3/2.0 | 1,251 (+2%) | 3mo | $340,000 | $272 | 72 |
| 1313 Meadow Vista Dr | 0.30mi | 2/2.0 (-1) | 1,262 (+3%) | 10mo | $298,500 | $237 | 68 |
| 607 Weeping Willow Ln | 0.47mi | 3/2.0 | 1,245 (+1%) | 14mo | $305,000 | $245 | 64 |
| 881 Weeping Willow Ln | 0.26mi | 3/2.0 | 1,276 (+4%) | 22mo | $310,000 | $243 | 63 |
| 529 Weeping Willow Ln | 0.50mi | 3/2.0 | 1,124 (-8%) | 1mo | $310,000 | $276 | 62 |
| 680 Stoneharbor Ln | 0.51mi | 2/2.5 (-1) | 1,312 (+7%) | 0mo | $285,000 | $217 | 57 |
| 6520 Sioux Pass Ct | 0.53mi | 3/2.0 | 1,368 (+11%) | 0mo | $337,000 | $246 | 56 |
| 735 Weeping Willow Ln | 0.41mi | 3/2.0 | 1,167 (-5%) | 22mo | $290,000 | $249 | 55 |
| 582 Jewelweed Ct | 0.46mi | 3/2.0 | 1,147 (-7%) | 22mo | $272,000 | $237 | 50 |
Match score weights: distance 35% · size 25% · config 20% · recency 20%. Top-matched comps best support the ARV.
Projected returns pro-forma
10.0% appreciation · 7.42% rent growth · sell at horizon
- IRR
- 25.6%
- Equity multiple
- 3.08×
- Total profit
- $186,556
- Equity at exit
- $289,039
- IRR
- 23.8%
- Equity multiple
- 7.48×
- Total profit
- $581,687
- Equity at exit
- $623,323
Cash invested: $89,835 (down + closing). Projections, not guarantees.
Landlord ↔ Tenant lean methodology
- Overall (STATE)
- 73 Landlord-Friendly
- State Ohio
- 73 Landlord-Friendly · R+6
- County
- — inherits STATE
- City
- — inherits STATE
ZIP-level market 45039
- Home prices YoY
- 7.3%
- Rents YoY
- 7.4%
- Active inventory
- 130
- Price-to-rent
- 9.8×
Monthly cashflow live
- Estimated rent
- $2,784 medium interval (Pro) →
- Mortgage (P&I)
- −$1,683
- Tax est. 1.5%
- −$401 /mo · $4,813/yr
- Insurance
- −$134
- HOA
- −$0
- Vacancy / Maint / Mgmt
- −$585
- Net cashflow
- $-18
Break-even live
Sensitivity live
| Price | -10% $204 | -5% $93 | +0% $-18 | +5% $-129 | +10% $-240 |
|---|---|---|---|---|---|
| Rent | -10% $-238 | -5% $-128 | +0% $-18 | +5% $92 | +10% $202 |
| Rate | -1.0pp $143 | -0.5pp $63 | base $-18 | +0.5pp $-101 | +1.0pp $-186 |
UW: 25.0% down · 7.5% · 30yr · 1.5% tax · 5.0% vac · 8.0% maint · 8.0% mgmt
Financing live
Cash to close
- Down payment
- $80,210
- Closing costs
- $9,625
- Reserves months
- —
- Total cash needed
- —
Loan-product check · same deal, 3 products live
Conventional
25% down · 7.5% · 30yr
- Down + closing
- —
- Monthly P&I
- —
- Monthly cashflow
- —
- DSCR
- —
- Eligible?
- —
Personal DTI + credit; lowest rate.
DSCR
20% down · 8.5% · 30yr
- Down + closing
- —
- Monthly P&I
- —
- Monthly cashflow
- —
- DSCR
- —
- Eligible?
- —
No personal income docs; deal must DSCR.
Hard money
10% down · 12.0% · 12mo
- Down + closing
- —
- Monthly P&I
- —
- Monthly cashflow
- —
- DSCR
- —
- Eligible?
- —
Short-term bridge; refi at stabilization.
Rent comps 1 comps
| Address | Beds | Baths | Sqft | Rent | $/sqft | DOM | Units | Dist |
|---|---|---|---|---|---|---|---|---|
| 1409 Grandin Rd Maineville, OH | 2.0 | 2.0 | 1460 | $4,200 | $2.88 | 3d | 1 | 0.62mi |
Listing history 14 events
-
2026-06-21days on market $328,990 Active 264 DOM
-
2026-06-18days on market $328,990 Active 261 DOM
-
2026-06-17days on market $328,990 Active 260 DOM
-
2026-06-16days on market $328,990 Active 259 DOM
-
2026-06-15days on market $328,990 Active 258 DOM
-
2026-06-13days on market $328,990 Active 256 DOM
-
2026-06-09days on market $328,990 Active 252 DOM
-
2026-06-08days on market $328,990 Active 251 DOM
-
2026-06-07days on market $328,990 Active 250 DOM
-
2026-06-03days on market $328,990 Active 246 DOM
-
2026-06-02days on market $328,990 Active 245 DOM
-
2026-06-01days on market $328,990 Active 244 DOM
-
2026-05-31days on market $328,990 Active 243 DOM
-
2025-10-01$328,990 Active 1098-char remark
Show marketing remark (1098 chars)
Step into the charm and affordability of our Walnut floor plan, where homeownership dreams come to life in the inviting embrace of this 1,210 sq ft home. This modest yet versatile design opens the door to a world of possibilities with multiple structural options and diverse exterior styles, allowing you to infuse your personal touch and make the Walnut uniquely yours. Boasting three bedrooms and two full bathrooms, the Walnut floor plan is the perfect starting place. The layout offers an easy-flowing arrangement that enhances both functionality and aesthetics. Picture yourself moving through the foyer into the open-concept Great Room and Kitchen, featuring a dining nook for sharing meals together. Add on the sunroom extension to enjoy sunny days and crisp nights cozied up with a book. Whether you're entertaining guests or enjoying a quiet night in, the Walnut provides a versatile backdrop for the moments that matter most. From upgraded finishes to personalized spaces, this floor plan adapts effortlessly to your lifestyle. Make your homeownership journey truly yours with The Walnut!
ⓘ Source: listings_history table (triggers on properties + properties_extension) + one-shot
backfill from property_details.listing_events for pre-trigger history.
Nearby sold comps map
Loading sold comps map…
Walkable amenities ~0.75 mi
Loading nearby amenities…
Taxation est. · year 1
- Rental income
- $33,404
- − Mortgage interest
- −$17,972
- − Property taxes
- −$4,813
- − Insurance
- −$1,604
- − Repairs & maintenance
- −$2,672
- − Management
- −$2,672
- − Depreciation
- −$9,334
- Taxable loss
- −$5,663
- Est. tax savings @ 24.0%
- +$1,359
- After-tax cash flow
- $1,141/yr
For passive investors: Depreciation is non-cash, so a rental often shows a tax loss while cash-flowing — sheltering income. Rental losses are passive: they offset passive income freely, and up to $25,000/yr can offset ordinary (W-2) income if you actively participate and your MAGI is under $100k (phasing out to $0 by $150k); unused losses carry forward. On sale, claimed depreciation is recaptured at up to 25%, and gains may owe capital-gains tax (a 1031 exchange can defer both). Figures are a year-1 estimate at your 24.0% rate — not tax advice; consult a CPA.
Condition & rehab AI · 12 photos
This home is in good condition with a good condition score of 80. It has a cosmetic rehab level and requires minor maintenance and some updates to increase its resale and rental value.
Value-add opportunities
- Resale Paint exterior siding — Fresh paint can enhance curb appeal and property value
- Both Replace carpet in bedrooms — Carpet can be outdated and may need replacement for a more modern look and better air quality
- Both Install smart home devices — Smart home devices can increase property value and attract tech-savvy buyers
Renovation cost estimate screening
Value-add ROI direction
- Resale Paint exterior siding — Fresh paint can enhance curb appeal and property value ↑
- Both Replace carpet in bedrooms — Carpet can be outdated and may need replacement for a more modern look and better air quality ↑
- Both Install smart home devices — Smart home devices can increase property value and attract tech-savvy buyers ↑
ⓘ Cost ranges are severity-bucket heuristics (US national rule-of-thumb). Get contractor quotes + a written scope before underwriting a rehab budget.
Schools (NCES district)
- District
- Little Miami Local
- NCES district ID
- 3905044
- Math proficiency
- 67% ▼ -11.00%
- Reading proficiency
- 70% ▼ -6.00%
- Median HH income
- $74,949
- Composite
- 60.5/100
- National rank
- #844
- State rank
- #140 of 656 in OH
Livability — South Lebanon
- Score
- 74/100
- State rank
- #279
- US rank
- #4589
Category grades
Schools grade is shown separately in the Schools card above.
Census & demographics
- County
- Warren County · 196,906 people
- City population
- 7,053
- Metro
- Cincinnati, OH-KY-IN
- Population (ZIP)
- 28,335
- Household income
- $108,794
- Rent vs Own
- Severe rent burden
- 307.0
Population outlook (Warren County) Hauer SSP2
- Today (2025)
- 248,603 people
- By 2030
- 259,345 · +4.3%
- By 2040
- 277,666 · +11.7%
- By 2050
- 289,599 · +16.5%
- By 2075
- 311,681 · +25.4%
- By 2100
- 302,738 · +21.8%
Race, ethnicity, and origin ACS 2023
- Neighborhood character
- Predominantly White (88%)
- Race & ethnicity
- White 88% Hispanic / Latino 5% Two or more races 5% Asian 3% Black 2%
- Common ancestry
- Romanian 2% Scotch-Irish 2% Lithuanian 2%
- Foreign-born
- 8% · Canada, Jamaica
- Languages at home
- 92% English-only · Spanish 3% Russian/Polish/Slavic 2% Other Indo-European 1%
Political lean MEDSL · Warren
- 2024 margin
- Solid R (+31.5) · D 33.8% · R 65.3%
- 2008→2024 swing
- +4.5pp toward D · 2008: -36.1pp · 2024: -31.5pp
- All cycles
- 2024: R+31.5 2020: R+30.8 2016: R+37.6 2012: R+39.5 2008: R+36.1
Not yet ingested
- Civics
- —
Market trends
- HPI YoY
- ▲ 38.63%
- Current HPI
- 568.09
- Rent YoY
- ▲ 7.42%
- Metro
- Cincinnati, OH-KY-IN
- State GDP YoY
- ▲ 1.98%
- F500 in state
- 48
Industry mix (Fortune 500 HQ in OH)
| Industry | F500 HQs | Revenue |
|---|---|---|
| Insurance | 3 | $145B |
|
||
| Industrial Machinery | 3 | $49B |
|
||
| Financial Services | 3 | $24B |
|
||
| Consumer Goods | 2 | $93B |
|
||
| Aerospace / Defense | 2 | $47B |
|
||
| Utilities | 2 | $33B |
|
||
Price history
1 event — show timeline
- 2025-10-01 Listed $328,990 Zillow
Cash-flow waterfall
monthlySold comps — $/sqft
last 12 mo · ≤1 miLoading sold comps…