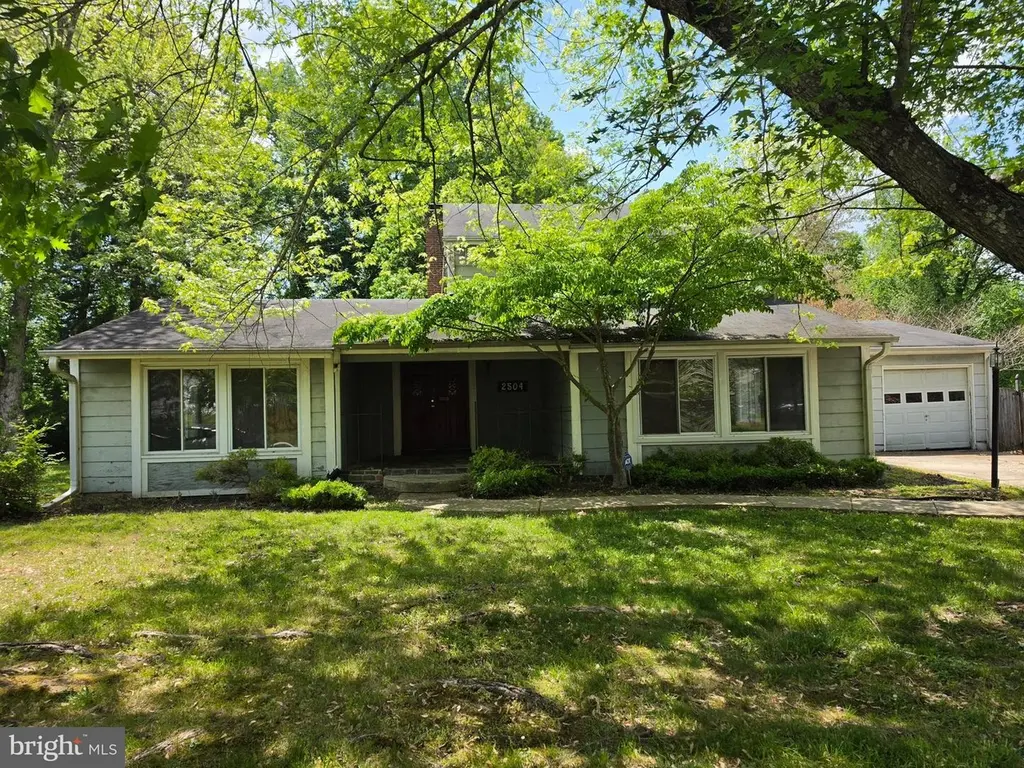
2504 Panther Ln · Bowie, MD
Flood risk 1/10 · Minimal
- FEMA flood zone
- X (unshaded)
- Chance of flooding over 30 yrs
- 0.0%
- Est. flood insurance / yr
- $507 – $1,088
Fire risk 3/10 · Minor
- Est. fire insurance / yr
- $755 – $1,403
Heat risk 8/10 · Major
- Hot days now (above 102°F)
- 7 days/yr
- Hot days in 30 yrs
- 16 days/yr
Wind risk 5/10 · Moderate
- Chance of severe wind over 30 yrs
- 25.0%
Air-quality risk 4/10 · Minor
- Unhealthy air days now
- 4 days/yr
- Unhealthy air days in 30 yrs
- 6 days/yr
Risk factors via First Street. Map © Google.
Why this score? — see what drove the C- grade
The composite is a weighted blend of 9 inputs, each scored 0–100. Each bar is that input's sub-score; the figure is the points it added to the 100-point composite (weight × sub-score).
- Cash flow +17.7/30.0
- ARV discount +15.0/15.0
- DSCR +5.5/10.0
- 1% rule +4.8/10.0
- Rent growth +3.7/5.0
- Livability +3.6/5.0
- Condition / age +2.5/5.0
- Schools +1.7/10.0
- Appreciation +0.0/10.0
$394,900
🖨 Deal sheet (PDF) 📄 Offer letter ✓ Due diligence
Listing remarks
* * * * * * * * * * NOT A RENTAL. FOR SALE ONLY * * * * * * * * * * Opportunity awaits in Bowie’s popular Pointer Ridge neighborhood! This contemporary-style single-family home sits on a large lot, backs to wooded privacy, and offers tremendous potential for customization and value. Inside, you’ll find a sought-after main-level bedroom, sun-filled living spaces, a generous kitchen table space, and a welcoming family room with a fireplace leading to the rear patio. Enjoy the convenience of nearby shopping, restaurants, and everyday amenities, all while tucked into an established community setting. With great bones, natural light, and a prime location, this home
Key facts
- Main-level bedroom
- Wooded privacy
- Large lot
Tags
Property features AI
Finance
- Other: Fee simple ownership; Not in a federal flood zone; Property condition listed as below average
Exterior
- Parking: Attached garage with front entry; Additional storage area in garage; Off-street parking (total of 2 garage/parking spaces)
- Utilities: Public water; Public sewer; Cable TV available; Municipal trash not provided
- Home design: Detached structure; Above-grade finished living area recorded by assessor
- Construction: Frame construction; Block foundation; Fiberglass roof; Double-pane windows; Building winterized
- Exterior features: Patio(s) and porch(es); Backs to trees
Interior
- Kitchen: Kitchen (appliances not listed)
- Bedrooms: One bedroom on the main level; Three bedrooms on the upper level
- Flooring: Carpet; Engineered wood; Laminate
- Bathrooms: Two full bathrooms; One half bathroom
- Heating & cooling: Forced air heating (natural gas); Electric cooling
- Interior features: French and sliding glass doors; Living room, dining room, family room, den, breakfast room, study, attic, workshop
- Laundry & utility: Laundry room; Hot water provided by natural gas
Neighborhood map
What this means for you Summary
Snapshot
- This is a 4-bed/2.5-bath single-family listed at $395k.
Deal economics
- At list price, monthly cash flow is $315 ($4k/yr) — positive.
- The deal already cash-flows at list — no discount required.
- To meet the 1% rule (rent ≥ 1% of price), the offer needs to be $387k (1.9% below list).
- Recommended offer: $383k (3.0% below list) — sets the bar for market timing.
- Cap rate 7.2% vs local median 4.0% in Bowie — top-decile yield for the area; either an underpriced asset or a hidden risk that comps aren't pricing in. Stress-test before assuming the spread holds.
Location & tenants
- Location reads 71/100 on livability (#159 in MD) — a middle-class / working-renter tenant base. Strengths: employment A+, housing A+; Watch: health & safety C-, amenities F, commute F.
- Prince George'S County Public Schools (suburban): math 8% / reading 24% proficiency, ranked #21 of 24 in MD (top 88%) — low school quality limits family demand, transient renter base, plan for 1-2y turnover.
- Zoned schools: Bowie High (math 31% / reading 73%, grade D+, #100 of 222 statewide, top 47%, 2,460 students, 48% FRL).
- Zoned-school proficiency averages 52% at this address vs 16% district-wide (+36 pts) — the actual schools serving this property are materially stronger than the Prince George'S County Public Schools average implies; a family-tenant draw the district grade alone would hide.
- Market conditions: Rents rising fast (+4.6%/yr); 172 active listings in the ZIP; 10 comparable units currently listed for rent nearby; rentals at typical pace (median 26d on market — plan ~3-4 weeks tenant-placement turnaround); 40% of comp listings sitting > 30 days — soft ceiling on asking rent; high-income renter base; 1,481 units permitted in Prince George's County in 2024 (0 in 5+ unit buildings).
- This rent runs 37% of the median local income ($125k/yr) — at the standard rent-burdened threshold; future hikes will face affordability resistance.
Forward outlook
- Local home prices are declining (-3.0%/yr); year-one equity from $3k of loan paydown is wiped out by about $12k of value loss. Plan a longer hold.
- Prince George's County population projected at +18% by 2050 — long-run rental-demand tailwind backs the buy-and-hold thesis.
Negotiation context
- It's been on market 42 days — a 3% lower offer ($383k) is reasonable based on typical stale-listing flexibility.
Risks & watch-outs
- Climate carrying-cost: moderate wind risk, 25% chance of damaging wind over 30y; extreme-heat days projected 7→16/yr by 2055 (HVAC capex compounding) — expect insurance premiums to compound above CPI over the hold.
Questions for the listing agent
- It's been on market 42 days. Have you received any prior offers? Is the seller open to a 3% concession, seller financing, or rate buy-down credit?
- Built in 1973 — when were the roof, HVAC, electrical panel, plumbing, and water heater last replaced?
- Is there a deadline driving the sale (1031 exchange, divorce, estate, relocation)? That informs how much negotiation room exists.
- What's the average days-on-market for RENTAL listings here right now (not sales)? A rising rental-DOM trend means longer vacancies and softer asking-rent achievability than the comps imply.
- What's the recent tenant-quality profile in this submarket — average credit score on applications, eviction rate, late-payment / NSF rate, and stable-employment percentage? A property-management company in the area should have these aggregated.
- How much new for-sale + rental construction is in the pipeline within 1–3 miles? Heavy new supply typically softens prices + rents 12–24 months out; constrained supply supports both.
Investment metrics
- 1% rule
- 0.98% ✗
- Cap rate
- 7.25%
- Cash-on-cash
- 3.41%
- DSCR
- 1.15
- GRM
- 8.5
CMA / ARV
- ARV (median comp)
- $498,754
- List price
- $394,900
- Delta
- -20.82%
- Verdict
- UNDERPRICED
- Comps
- 20 within 1.0 mi
Show comp detail 4 sales within ~0.75 mi
| Address | Dist | Beds/Ba | Sqft | Sold | Price | $/sf | Match |
|---|---|---|---|---|---|---|---|
| 15215 Noblewood Ln | 0.32mi | 4/3.0 | 2,254 (-7%) | 9mo | $535,000 | $237 | 64 |
| 16110 Amethyst Ln | 0.68mi | 5/3.5 (+1) | 2,464 (+2%) | 11mo | $645,000 | $262 | 47 |
| 1901 Page Ct | 0.73mi | 5/3.0 (+1) | 2,450 (+1%) | 12mo | $566,000 | $231 | 47 |
| 16012 Alderwood Ln | 0.71mi | 4/2.5 | 2,115 (-13%) | 16mo | $490,000 | $232 | 33 |
Match score weights: distance 35% · size 25% · config 20% · recency 20%. Top-matched comps best support the ARV.
Projected returns pro-forma
-3.0% appreciation · 4.61% rent growth · sell at horizon
- IRR
- -9.1%
- Equity multiple
- 0.66×
- Total profit
- $-37,514
- Equity at exit
- $58,881
- IRR
- 2.4%
- Equity multiple
- 1.18×
- Total profit
- $20,440
- Equity at exit
- $34,144
Cash invested: $110,572 (down + closing). Projections, not guarantees.
Landlord ↔ Tenant lean methodology
- Overall (STATE)
- 27 Tenant-Leaning
- State Maryland
- 27 Tenant-Leaning · D+14
- County
- — inherits STATE
- City
- — inherits STATE
ZIP-level market 20716
- Rents YoY
- 4.6%
- Active inventory
- 172
- Price-to-rent
- 8.5×
Monthly cashflow live
- Estimated rent
- $3,873 high interval (Pro) →
- Mortgage (P&I)
- −$2,071
- Tax from tax record
- −$510 /mo · $6,116/yr
- Insurance
- −$165
- HOA
- −$0
- Vacancy / Maint / Mgmt
- −$813
- Net cashflow
- $315
Break-even live
Sensitivity live
| Price | -10% $538 | -5% $426 | +0% $315 | +5% $203 | +10% $91 |
|---|---|---|---|---|---|
| Rent | -10% $9 | -5% $162 | +0% $315 | +5% $468 | +10% $621 |
| Rate | -1.0pp $513 | -0.5pp $415 | base $315 | +0.5pp $212 | +1.0pp $108 |
UW: 25.0% down · 7.5% · 30yr · 1.5% tax · 5.0% vac · 8.0% maint · 8.0% mgmt
Financing live
Cash to close
- Down payment
- $98,725
- Closing costs
- $11,847
- Reserves months
- —
- Total cash needed
- —
Loan-product check · same deal, 3 products live
Conventional
25% down · 7.5% · 30yr
- Down + closing
- —
- Monthly P&I
- —
- Monthly cashflow
- —
- DSCR
- —
- Eligible?
- —
Personal DTI + credit; lowest rate.
DSCR
20% down · 8.5% · 30yr
- Down + closing
- —
- Monthly P&I
- —
- Monthly cashflow
- —
- DSCR
- —
- Eligible?
- —
No personal income docs; deal must DSCR.
Hard money
10% down · 12.0% · 12mo
- Down + closing
- —
- Monthly P&I
- —
- Monthly cashflow
- —
- DSCR
- —
- Eligible?
- —
Short-term bridge; refi at stabilization.
Rent comps 10 comps
| Address | Beds | Baths | Sqft | Rent | $/sqft | DOM | Units | Dist |
|---|---|---|---|---|---|---|---|---|
| 15957 Alameda Dr Bowie, MD | 4.0 | 2.5 | 3024 | $3,650 | $1.21 | 19d | 1 | 0.54mi |
| 108 Lawndale Dr Unit 1001 Bowie, MD | 3.0 | 3.0 | 1606 | $3,100 | $1.93 | 23d | 1 | 0.87mi |
| 16103 Eastlawn Ct Bowie, MD | 5.0 | 3.5 | 2208 | $5,000 | $2.26 | 19d | 1 | 1.10mi |
| 1403 Peartree Ln Bowie, MD | 4.0 | 2.5 | 3225 | $5,000 | $1.55 | 14d | 1 | 1.15mi |
| 16428 Fife Way Bowie, MD | 5.0 | 3.5 | 3318 | $4,999 | $1.51 | 12d | 1 | 1.23mi |
| 1550 Adamson Way Bowie, MD | 3.0 | 2.5 | 1680 | $3,700 | $2.20 | 45d | 1 | 1.35mi |
| 1303 Port Echo Ln Bowie, MD | 4.0 | 2.0 | 2052 | $3,295 | $1.61 | 25d | 1 | 1.40mi |
| 1303 Port Echo Ln Bowie, MD | 4.0 | 2.0 | 2052 | $3,495 | $1.70 | 45d | 1 | 1.40mi |
| 944 Hall Station Dr Bowie, MD | 3.0 | 3.5 | 2304 | $3,600 | $1.56 | 45d | 1 | 1.45mi |
| 940 Hall Station Dr Bowie, MD | 3.0 | 3.0 | 2976 | $3,975 | $1.34 | 45d | 1 | 1.46mi |
Listing history 16 events
-
2026-06-21days on market $394,900 Active 42 DOM
-
2026-06-18days on market $394,900 Active 39 DOM
-
2026-06-17days on market $394,900 Active 38 DOM
-
2026-06-16days on market $394,900 Active 37 DOM
-
2026-06-15days on market $394,900 Active 36 DOM
-
2026-06-13days on market $394,900 Active 34 DOM
-
2026-06-10days on market $394,900 Active 30 DOM
-
2026-06-08days on market $394,900 Active 29 DOM
-
2026-06-07days on market $394,900 Active 28 DOM
-
2026-06-04days on market $394,900 Active 25 DOM
-
2026-06-03days on market $394,900 Active 24 DOM
-
2026-06-02days on market $394,900 Active 23 DOM
-
2026-06-01days on market $394,900 Active 22 DOM
-
2026-05-31days on market $394,900 Active 21 DOM
-
2026-05-11$394,900 Active 726-char remark
-
2026-03-10soldstatus $454,089
ⓘ Source: listings_history table (triggers on properties + properties_extension) + one-shot
backfill from property_details.listing_events for pre-trigger history.
Tax reassessment forecast MD · Partial reset (capped growth)
- Current annual tax
- $6,116 · $510/mo
- Projected year-2 tax
- $6,116 · $510/mo
- Expected delta
- $0/yr ($0/mo · 0.0%)
ⓘ Screening estimate from a state-policy table — verify with the county assessor before closing.
Climate risk First Street
- Flood 1/10 Low FEMA zone X (unshaded) · 0% chance over 30 yrs
- Wildfire 3/10 Moderate
- Heat 8/10 Severe 7 d/yr ≥102°F today · 16 d/yr by 30 yrs out
- Wind 5/10 Major 25% chance of damaging wind over 30 yrs
- Air quality 4/10 Moderate 4 unhealthy d/yr today · 6 by 30 yrs out
Nearby sold comps map
Loading sold comps map…
Walkable amenities ~0.75 mi
Loading nearby amenities…
Taxation est. · year 1
- Rental income
- $46,476
- − Mortgage interest
- −$22,121
- − Property taxes
- −$6,116
- − Insurance
- −$1,974
- − Repairs & maintenance
- −$3,718
- − Management
- −$3,718
- − Depreciation
- −$11,488
- Taxable loss
- −$2,659
- Est. tax savings @ 24.0%
- +$638
- After-tax cash flow
- $4,413/yr
For passive investors: Depreciation is non-cash, so a rental often shows a tax loss while cash-flowing — sheltering income. Rental losses are passive: they offset passive income freely, and up to $25,000/yr can offset ordinary (W-2) income if you actively participate and your MAGI is under $100k (phasing out to $0 by $150k); unused losses carry forward. On sale, claimed depreciation is recaptured at up to 25%, and gains may owe capital-gains tax (a 1031 exchange can defer both). Figures are a year-1 estimate at your 24.0% rate — not tax advice; consult a CPA.
Schools (NCES district)
- District
- Prince George'S County Public Schools
- NCES district ID
- 2400510
- Math proficiency
- 8% ▼ -11.00%
- Reading proficiency
- 24% ▼ -9.00%
- Median HH income
- $73,967
- Composite
- 16.82/100
- National rank
- #9151
- State rank
- #21 of 24 in MD
Livability — Bowie
- Score
- 71/100
- State rank
- #159
- US rank
- #7194
Category grades
Schools grade is shown separately in the Schools card above.
Census & demographics
- Census place
- Bowie, MD
- County
- Prince Georges County · 919,866 people
- City population
- 105,324
- Metro
- Washington-Arlington-Alexandria, DC-VA-MD-WV
- Population (ZIP)
- 22,362
- Household income
- $125,034
- Rent vs Own
- Severe rent burden
- 913.0
Population outlook (Prince George's County) Hauer SSP2
- Today (2025)
- 1,005,426 people
- By 2030
- 1,048,416 · +4.3%
- By 2040
- 1,123,425 · +11.7%
- By 2050
- 1,183,220 · +17.7%
- By 2075
- 1,306,202 · +29.9%
- By 2100
- 1,408,179 · +40.1%
Race, ethnicity, and origin ACS 2023
- Neighborhood character
- Predominantly Black (67%)
- Race & ethnicity
- Black 67% White 17% Hispanic / Latino 9% Two or more races 6% Asian 3%
- Hispanic origin (detail)
- Mexican 2% Puerto Rican 2% Dominican 2%
- Common ancestry
- Swiss 1% Slovak 1% Romanian 1%
- Foreign-born
- 17% · Canada
- Languages at home
- 81% English-only · Spanish 7% French/Haitian/Cajun 3% Other Indo-European 1%
Political lean MEDSL · Prince George's
- 2024 margin
- Solid D (+75.2) · D 86.3% · R 11.2% · Other 2.5%
- 2008→2024 swing
- -3.3pp toward R · 2008: 78.5pp · 2024: 75.2pp
- All cycles
- 2024: D+75.2 2020: D+80.5 2016: D+81.0 2012: D+80.9 2008: D+78.5
Not yet ingested
- Civics
- —
Market trends
- HPI YoY
- ▼ -302.27%
- Current HPI
- 285.1976
- Rent YoY
- ▲ 4.61%
- Metro
- Washington-Arlington-Alexandria, DC-VA-MD-WV
- State GDP YoY
- ▲ 2.97%
- F500 in state
- 12
Industry mix (Fortune 500 HQ in MD)
| Industry | F500 HQs | Revenue |
|---|---|---|
| Aerospace / Defense | 1 | $71B |
|
||
| Utilities | 1 | $25B |
|
||
| Hotels | 1 | $24B |
|
||
| Consumer Goods | 1 | $7B |
|
||
| Real Estate | 1 | $6B |
|
||
| Chemicals | 1 | $2B |
|
||
Price history
-13.0% since first listed2 events — show timeline
- 2026-05-11 Listed $394,900 BRIGHT MLS
- 2026-03-10 Sold (Public Records) $454,089 Public Records
Property tax history
+5.3%/yrLatest (2025): $6,116 · +5.1% YoY. Source: county tax records.
Cash-flow waterfall
monthlySold comps — $/sqft
last 12 mo · ≤1 miLoading sold comps…