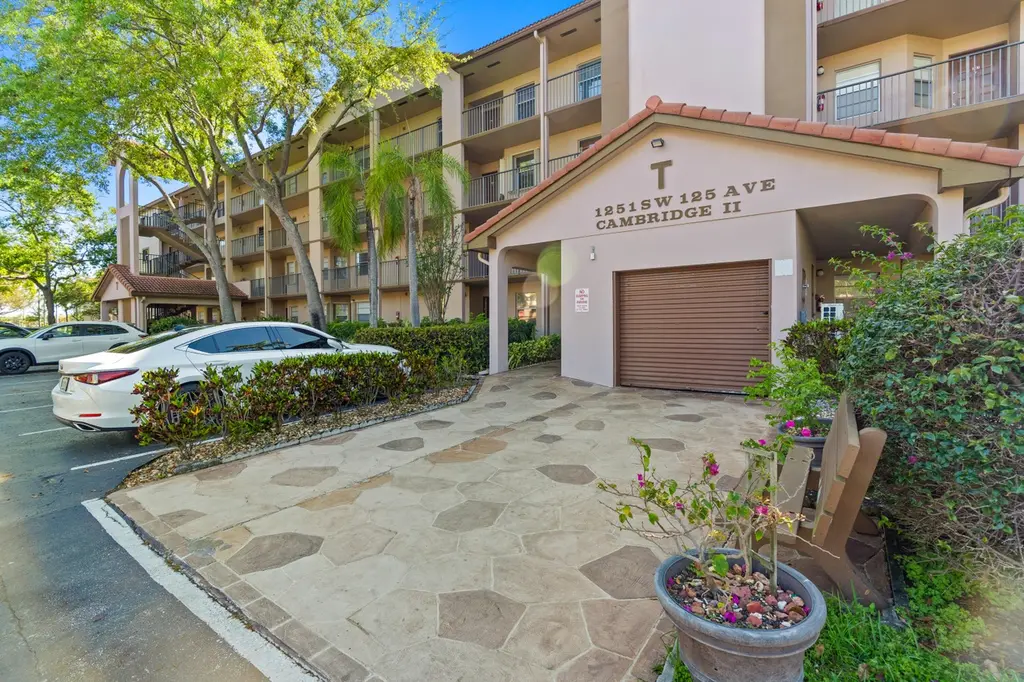
1251 SW 125th Ave Unit 105-t · Pembroke Pines, FL
Flood risk 1/10 · Minimal
- FEMA flood zone
- X (shaded)
- Chance of flooding over 30 yrs
- 0.0%
- Est. flood insurance / yr
- $507 – $1,088
Fire risk 1/10 · Minimal
- Est. fire insurance / yr
- $947 – $1,759
Heat risk 10/10 · Severe
- Hot days now (above 106°F)
- 7 days/yr
- Hot days in 30 yrs
- 27 days/yr
Wind risk 10/10 · Severe
- Chance of severe wind over 30 yrs
- 99.0%
Air-quality risk 2/10 · Minimal
- Unhealthy air days now
- 2 days/yr
- Unhealthy air days in 30 yrs
- 2 days/yr
Risk factors via First Street. Map © Google.
Why this score? — see what drove the D+ grade
The composite is a weighted blend of 9 inputs, each scored 0–100. Each bar is that input's sub-score; the figure is the points it added to the 100-point composite (weight × sub-score).
- Cash flow +13.1/30.0
- 1% rule +7.9/10.0
- ARV discount +7.5/15.0
- Livability +4.2/5.0
- Schools +4.1/10.0
- Appreciation +4.0/10.0
- DSCR +3.9/10.0
- Rent growth +2.5/5.0
- Condition / age +2.5/5.0
$178,000
🖨 Deal sheet (PDF) 📄 Offer letter ✓ Due diligence
Listing remarks
2-bedroom, 2-bath condo located in the investor friendly Cambridge in Century Village. The 1st floor condo has a spacious layout with a screened patio overlooking peaceful green space. It's been carefully cared for and priced with an opportunity to update to your taste. Washer Dryer inside the unit. Includes a newer refrigerator, dishwasher, A/C and 2017 water heater. Century Village is a sought-after 55+ resort-style neighborhood with exceptional amenities. Enjoy access to a 135,000 sq ft clubhouse featuring a fitness center, indoor and outdoor heated pools, spa, sauna, tennis courts, pickleball courts, golf course, billiards room, library, and a grand ballroom with live entertainment and
Key facts
- Screened patio
- 2017 water heater
- Newer dishwasher
Tags
Property features AI
Finance
- Other: Private paved road with private maintenance
- Financial info: Pets allowed (restrictions possible)
- HOA & community: Association: Cambridge T / Century Village; HOA fee paid monthly; HOA fee includes cable TV, insurance, internet, ground and structure maintenance, security, sewer, trash, water, common areas, elevator, roof repairs, recreation facility and pool service; Community amenities include clubhouse, fitness center, indoor pool, outdoor pool, sauna, tennis and pickleball courts, shuffleboard, billiard room, hobby room, library, community room, courtesy bus, manager on site, covered/maintained community, street lights, gated access, security, recreation facilities, parking, elevators and trash chute; Senior community
Exterior
- Parking: Assigned and guest open parking (1 assigned/open space)
- Security: Gated community with guard; Security patrol; Smoke detectors
- Utilities: Public water; Public sewer; Cable available; Electricity available; Phone service available; Underground utilities; Water and sewer connected
- Home design: Condominium; One level; Entry level 1; Faces west; Resale unit; Building name: Cambridge T; Total stories in building: 3
- Construction: Stucco / CBS / concrete block with stucco construction; Tile roof; Block foundation; Built as part of an existing community (assessor source for building area)
- Exterior features: Covered patio; Screened patio; Ground-floor entry; Patio
Interior
- Kitchen: Dishwasher; Disposal; Electric range; Refrigerator
- Bedrooms: 2 bedrooms on the main level
- Flooring: Carpet; Tile
- Bathrooms: 2 full bathrooms
- Heating & cooling: Central electric heating; Central air conditioning; Ceiling fan(s)
- Interior features: Entrance foyer; Walk-in closets; Split bedroom layout
- Laundry & utility: In-unit laundry in a main-level laundry closet (inside)
Neighborhood map
What this means for you Summary
Snapshot
- This is a 2-bed/2.0-bath condo listed at $178k.
Deal economics
- At list price, monthly cash flow is $-7 ($-83/yr) — negative.
- To cash-flow at today's rent, offer at most $177k (0.7% below list).
- Meets the 1% rule at list price ($2k rent vs $178k).
- Recommended offer: $167k (6.0% below list) — sets the bar for market timing.
- Cap rate 6.2% vs local median 4.0% in Pembroke Pines — top-decile yield for the area; either an underpriced asset or a hidden risk that comps aren't pricing in. Stress-test before assuming the spread holds.
Location & tenants
- Location reads 83/100 on livability (#54 in FL, #933 nationally) — a professional / high-income tenant draw. Strengths: housing A+, health & safety A+, crime A-; Watch: amenities D+, cost of living D+.
- Broward (suburban): math 42% / reading 53% proficiency, ranked #46 of 73 in FL (top 63%) — families likely to look elsewhere, expect single-tenant / working-renter base with shorter leases.
- Zoned schools: Lakeside Elementary School (math 53% / reading 63%, grade C+, #751 of 2,144 statewide, top 36%, 631 students, 57% FRL); Walter C. Young Middle School (math 49% / reading 62%, grade B-, #178 of 571 statewide, top 31%, 873 students, 56% FRL); Charles W Flanagan High School (math 29% / reading 50%, grade F, #304 of 667 statewide, top 47%, 2,475 students, 57% FRL).
- Market conditions: Rents soft (-0.2%/yr); 543 active listings in the ZIP; 40 comparable units currently listed for rent nearby; rentals at typical pace (median 23d on market — plan ~3-4 weeks tenant-placement turnaround); solid renter incomes; 2,111 units permitted in Broward County in 2024 (1,265 in 5+ unit buildings).
- This rent runs 36% of the median local income ($77k/yr) — at the standard rent-burdened threshold; future hikes will face affordability resistance.
Forward outlook
- Local home prices are declining (-2.0%/yr); year-one equity from $1k of loan paydown is wiped out by about $4k of value loss. Plan a longer hold.
- Broward County population projected at +34% by 2050 — long-run rental-demand tailwind backs the buy-and-hold thesis.
Negotiation context
- It's been on market 75 days — a 6% lower offer ($167k) is reasonable based on typical stale-listing flexibility.
- Current owner paid $55k; list at $178k implies a 224% gain — meaningful room to come down on a strong offer.
Risks & watch-outs
- Watch-outs: HOA is 33% of rent.
- Climate carrying-cost: severe wind risk, 99% chance of damaging wind over 30y; extreme-heat days projected 7→27/yr by 2055 (HVAC capex compounding) — expect insurance premiums to compound above CPI over the hold.
Questions for the listing agent
- What do current leases actually rent for vs. the listed asking? Can we see a recent rent roll and the last 12 months of T-12 income?
- It's been on market 75 days. Have you received any prior offers? Is the seller open to a 6% concession, seller financing, or rate buy-down credit?
- What does the HOA fee cover, when was the last increase, and are there any pending special assessments or reserve-fund shortfalls?
- Any open or pending special assessments — roof, HVAC, plumbing, elevator, façade? What's the per-unit balance and payoff schedule, and is the seller paying it off at close or rolling it to the buyer?
- Why hasn't it sold? Are there any deal-killer items the seller is aware of (foundation, flood, title, zoning, code violations)?
- Is there a deadline driving the sale (1031 exchange, divorce, estate, relocation)? That informs how much negotiation room exists.
- Schools are A-rated — typically a magnet for longer-tenancy family renters. What's the average tenant stay here, and is there a school-zone premium baked into asking?
- The area grade is low — what's the realistic commute time and amenity access for the typical tenant pool here? Any planned neighborhood developments (good or bad) we should know about?
- What's the average days-on-market for RENTAL listings here right now (not sales)? A rising rental-DOM trend means longer vacancies and softer asking-rent achievability than the comps imply.
- What's the recent tenant-quality profile in this submarket — average credit score on applications, eviction rate, late-payment / NSF rate, and stable-employment percentage? A property-management company in the area should have these aggregated.
- How much new apartment / multifamily construction is in the pipeline within 1–3 miles? Heavy new supply (>2% of stock underway) typically softens rents 12–24 months out; light construction supports rent growth.
Investment metrics
- 1% rule
- 1.29% ✓
- Cap rate
- 6.25%
- Cash-on-cash
- -0.17%
- DSCR
- 0.99
- GRM
- 6.4
CMA / ARV
No comps found within radius.
Projected returns pro-forma
-2.01% appreciation · 0.0% rent growth · sell at horizon
- IRR
- -15.0%
- Equity multiple
- 0.43×
- Total profit
- $-28,184
- Equity at exit
- $34,468
- IRR
- -14.0%
- Equity multiple
- 0.14×
- Total profit
- $-42,937
- Equity at exit
- $29,359
Cash invested: $49,840 (down + closing). Projections, not guarantees.
Landlord ↔ Tenant lean methodology
- Overall (STATE)
- 87 Strongly Landlord-Friendly
- State Florida
- 87 Strongly Landlord-Friendly · R+3
- County
- — inherits STATE
- City
- — inherits STATE
ZIP-level market 33027
- Home prices YoY
- -0.6%
- Rents YoY
- -0.2%
- Active inventory
- 543
- Price-to-rent
- 6.4×
Monthly cashflow live
- Estimated rent
- $2,305 high interval (Pro) →
- Mortgage (P&I)
- −$933
- Tax from tax record
- −$60 /mo · $719/yr
- Insurance
- −$74
- HOA
- −$760
- Vacancy / Maint / Mgmt
- −$484
- Net cashflow
- $-7
Break-even live
Sensitivity live
| Price | -10% $94 | -5% $43 | +0% $-7 | +5% $-57 | +10% $-108 |
|---|---|---|---|---|---|
| Rent | -10% $-189 | -5% $-98 | +0% $-7 | +5% $84 | +10% $175 |
| Rate | -1.0pp $83 | -0.5pp $38 | base $-7 | +0.5pp $-53 | +1.0pp $-100 |
UW: 25.0% down · 7.5% · 30yr · 1.5% tax · 5.0% vac · 8.0% maint · 8.0% mgmt
Financing live
Cash to close
- Down payment
- $44,500
- Closing costs
- $5,340
- Reserves months
- —
- Total cash needed
- —
Loan-product check · same deal, 3 products live
Conventional
25% down · 7.5% · 30yr
- Down + closing
- —
- Monthly P&I
- —
- Monthly cashflow
- —
- DSCR
- —
- Eligible?
- —
Personal DTI + credit; lowest rate.
DSCR
20% down · 8.5% · 30yr
- Down + closing
- —
- Monthly P&I
- —
- Monthly cashflow
- —
- DSCR
- —
- Eligible?
- —
No personal income docs; deal must DSCR.
Hard money
10% down · 12.0% · 12mo
- Down + closing
- —
- Monthly P&I
- —
- Monthly cashflow
- —
- DSCR
- —
- Eligible?
- —
Short-term bridge; refi at stabilization.
Rent comps 40 comps
| Address | Beds | Baths | Sqft | Rent | $/sqft | DOM | Units | Dist |
|---|---|---|---|---|---|---|---|---|
| 1351 SW 125th Ave Unit 108S Pembroke Pines, FL | 2.0 | 2.0 | 1100 | $2,300 | $2.09 | 22d | 1 | 0.06mi |
| 1400 SW 124th Ter Unit 302Q Pembroke Pines, FL | 2.0 | 2.0 | 1100 | $2,000 | $1.82 | 22d | 1 | 0.08mi |
| 1200 SW 125th Ave Unit 208L Pembroke Pines, FL | 1.0 | 1.5 | 1065 | $1,500 | $1.41 | 25d | 1 | 0.08mi |
| 1300 SW 125th Ave Unit 311K Pembroke Pines, FL | 2.0 | 2.0 | 1351 | $2,500 | $1.85 | 25d | 1 | 0.09mi |
| 1300 SW 125th Ave Pembroke Pines, FL | 1.0–2.0 | 1.5–2.0 | 1198 | $2,500 | $2.09 | 5d | 2 | 0.10mi |
| 12501 SW 14th St Unit 315R Pembroke Pines, FL | 2.0 | 2.0 | 1190 | $2,200 | $1.85 | 15d | 1 | 0.10mi |
| 12501 SW 14th St Pembroke Pines, FL | 2.0 | 2.0 | 1145 | $2,100 | $1.83 | 14d | 2 | 0.12mi |
| 12501 SW 14th St Pembroke Pines, FL | 2.0 | 2.0 | 1145 | $2,275 | $1.99 | 25d | 2 | 0.12mi |
| 1110 SW 125th Ave Pembroke Pines, FL | 1.0–2.0 | 1.5–2.0 | 1276 | $2,300 | $1.80 | 25d | 2 | 0.12mi |
| 12601 SW 13th St Unit 303G Pembroke Pines, FL | 2.0 | 2.0 | 1192 | $2,150 | $1.80 | 25d | 1 | 0.15mi |
| 12650 SW 15th St Unit F304 Pembroke Pines, FL | 2.0 | 1.5 | 1032 | $1,900 | $1.84 | 25d | 1 | 0.19mi |
| 1650 SW 124th Ter Unit D403 Pembroke Pines, FL | 2.0 | 1.5 | 1032 | $1,950 | $1.89 | 21d | 1 | 0.19mi |
| 1650 SW 124th Ter Unit D403 Pembroke Pines, FL | 2.0 | 1.5 | 1032 | $1,950 | $1.89 | 4d | 1 | 0.19mi |
| 12701 SW 13th St Unit 202F Pembroke Pines, FL | 2.0 | 2.0 | 1100 | $2,000 | $1.82 | 25d | 1 | 0.21mi |
| 12701 SW 13th St Unit 202F Pembroke Pines, FL | 2.0 | 2.0 | 1100 | $1,900 | $1.73 | 8d | 1 | 0.21mi |
| 12651 SW 16th Ct Unit B304 Pembroke Pines, FL | 2.0 | 1.5 | 1032 | $2,200 | $2.13 | 25d | 1 | 0.25mi |
| 12651 SW 16th Ct Unit B304 Pembroke Pines, FL | 2.0 | 1.5 | 1032 | $2,200 | $2.13 | 10d | 1 | 0.25mi |
| 1651 SW 127th Ave Apt 305A Pembroke Pines, FL | 2.0 | 2.0 | 1207 | $2,650 | $2.20 | 25d | 1 | 0.26mi |
| 1401 SW 128th Ter Unit H309 Pembroke Pines, FL | 2.0 | 2.0 | 1100 | $2,200 | $2.00 | 12d | 1 | 0.29mi |
| 1151 SW 128th Ter Unit 210D Pembroke Pines, FL | 2.0 | 2.0 | 1192 | $2,200 | $1.85 | 25d | 1 | 0.32mi |
| 1300 SW 130th Ave Pembroke Pines, FL | 1.0–2.0 | 1.0–2.0 | 885 | $1,975 | $2.23 | 25d | 2 | 0.36mi |
| 12154 Saint Andrews Pl #110 Miramar, FL | 2.0 | 2.5 | 1100 | $2,490 | $2.26 | 8d | 1 | 0.38mi |
| 11801 Pembroke Rd Pembroke Pines, FL | 1.0–2.0 | 1.0–2.0 | 919 | $2,553 | $2.78 | 2d | 88 | 0.39mi |
| 12148 Saint Andrews Pl #107 Miramar, FL | 2.0 | 2.0 | 983 | $2,350 | $2.39 | 25d | 1 | 0.40mi |
| 12500 SW 5th Ct Unit 112M Pembroke Pines, FL | 1.0 | 1.5 | 1045 | $1,780 | $1.70 | 8d | 1 | 0.40mi |
| 12500 SW 5th Ct Unit 112M Pembroke Pines, FL | 1.0 | 1.5 | 1045 | $1,800 | $1.72 | 18d | 1 | 0.40mi |
| 12142 Saint Andrews Pl #107 Miramar, FL | 3.0 | 2.0 | 1080 | $2,900 | $2.69 | 5d | 1 | 0.42mi |
| 12142 Saint Andrews Pl #107 Miramar, FL | 3.0 | 2.0 | 1080 | $2,900 | $2.69 | 11d | 1 | 0.42mi |
| 12600 SW 5th Ct Pembroke Pines, FL | 2.0 | 2.0 | 1349 | $2,225 | $1.65 | 11d | 2 | 0.42mi |
| 2091 Renaissance Blvd #207 Miramar, FL | 2.0 | 1.0 | 830 | $2,100 | $2.53 | 25d | 1 | 0.44mi |
| 12650 SW 6th St Unit 412K Pembroke Pines, FL | 1.0 | 1.5 | 1045 | $1,950 | $1.87 | 25d | 1 | 0.44mi |
| 12106 Saint Andrews Pl #306 Miramar, FL | 2.0 | 1.0 | 817 | $2,000 | $2.45 | 25d | 1 | 0.46mi |
| 2081 Renaissance Blvd #205 Miramar, FL | 2.0 | 2.0 | 966 | $2,500 | $2.59 | 8d | 1 | 0.46mi |
| 12111 SW 5th Ct Pembroke Pines, FL | 1.0 | 1.5 | 1338 | $1,499 | $1.12 | 25d | 1 | 0.46mi |
| 12032 SW 5th Ct Unit 12032 Pembroke Pines, FL | 2.0 | 2.5 | 1169 | $2,750 | $2.35 | 25d | 1 | 0.47mi |
| 12148 SW 4th St #12148 Pembroke Pines, FL | 3.0 | 2.5 | 1428 | $3,200 | $2.24 | 5d | 1 | 0.48mi |
| 12140 SW 4th St Unit 12140 Pembroke Pines, FL | 2.0 | 2.5 | 1169 | $2,900 | $2.48 | 3d | 1 | 0.48mi |
| 12112 Saint Andrews Pl #205 Miramar, FL | 2.0 | 1.0 | 817 | $2,100 | $2.57 | 20d | 1 | 0.48mi |
| 12800 SW 7th Ct Pembroke Pines, FL | 1.0–2.0 | 1.0–2.0 | 1173 | $2,300 | $1.96 | 5d | 3 | 0.49mi |
| 12800 SW 7th Ct Unit 102G Pembroke Pines, FL | 1.0 | 1.0 | 840 | $2,000 | $2.38 | 25d | 1 | 0.49mi |
HOA detail condo
- Monthly dues
- $760 · $9,120/yr
- Likely covers
- waterpoolgym
- Assessments
- None detected in remarks — confirm with the listing agent.
Listing history 11 events
-
2026-06-09days on market $178,000 Active 75 DOM
-
2026-06-08days on market $178,000 Active 74 DOM
-
2026-06-07days on market $178,000 Active 73 DOM
-
2026-06-04days on market $178,000 Active 70 DOM
-
2026-06-03days on market $178,000 Active 69 DOM
-
2026-06-02days on market $178,000 Active 68 DOM
-
2026-06-01days on market $178,000 Active 67 DOM
-
2026-05-31days on market $178,000 Active 66 DOM
-
2026-03-24$178,000 Active
-
1989-09-01soldstatus $55,000
-
1988-04-01soldstatus $52,000
ⓘ Source: listings_history table (triggers on properties + properties_extension) + one-shot
backfill from property_details.listing_events for pre-trigger history.
Tax reassessment forecast FL · Resets to sale price
- Current annual tax
- $719 · $60/mo
- Projected year-2 tax
- $1,477 · $123/mo
- Expected delta
- +$759/yr (+$63/mo · 105.6%)
ⓘ Screening estimate from a state-policy table — verify with the county assessor before closing.
Climate risk First Street
- Flood 1/10 Low FEMA zone X (shaded) · 0% chance over 30 yrs
- Wildfire 1/10 Low
- Heat 10/10 Extreme 7 d/yr ≥106°F today · 27 d/yr by 30 yrs out
- Wind 10/10 Extreme 99% chance of damaging wind over 30 yrs
- Air quality 2/10 Low 2 unhealthy d/yr today · 2 by 30 yrs out
Nearby sold comps map
Loading sold comps map…
Walkable amenities ~0.75 mi
Loading nearby amenities…
Taxation est. · year 1
- Rental income
- $27,654
- − Mortgage interest
- −$9,971
- − Property taxes
- −$719
- − Insurance
- −$890
- − Repairs & maintenance
- −$2,212
- − Management
- −$2,212
- − HOA
- −$9,120
- − Depreciation
- −$5,178
- Taxable loss
- −$2,648
- Est. tax savings @ 24.0%
- +$635
- After-tax cash flow
- $552/yr
For passive investors: Depreciation is non-cash, so a rental often shows a tax loss while cash-flowing — sheltering income. Rental losses are passive: they offset passive income freely, and up to $25,000/yr can offset ordinary (W-2) income if you actively participate and your MAGI is under $100k (phasing out to $0 by $150k); unused losses carry forward. On sale, claimed depreciation is recaptured at up to 25%, and gains may owe capital-gains tax (a 1031 exchange can defer both). Figures are a year-1 estimate at your 24.0% rate — not tax advice; consult a CPA.
Schools (NCES district)
- District
- Broward
- NCES district ID
- 1200180
- Math proficiency
- 42% ▼ -18.00%
- Reading proficiency
- 53% ▼ -5.00%
- Median HH income
- $52,139
- Composite
- 40.88/100
- National rank
- #3621
- State rank
- #46 of 73 in FL
Livability — Pembroke Pines
- Score
- 83/100
- State rank
- #54
- US rank
- #933
Category grades
Schools grade is shown separately in the Schools card above.
Census & demographics
- Census place
- Pembroke Pines, FL
- County
- Broward County · 1,963,430 people
- City population
- 180,224
- Metro
- Miami-Fort Lauderdale-Pompano Beach, FL
- Population (ZIP)
- 65,116
- Household income
- $76,561
- Rent vs Own
- Severe rent burden
- 1728.0
Population outlook (Broward County) Hauer SSP2
- Today (2025)
- 2,207,033 people
- By 2030
- 2,360,704 · +7.0%
- By 2040
- 2,661,208 · +20.6%
- By 2050
- 2,946,698 · +33.5%
- By 2075
- 3,602,273 · +63.2%
- By 2100
- 3,970,984 · +79.9%
Race, ethnicity, and origin ACS 2023
- Neighborhood character
- Diverse neighborhood (Simpson 0.65)
- Race & ethnicity
- Hispanic / Latino 52% Two or more races 23% Black 22% White 16% Asian 6%
- Hispanic origin (detail)
- Puerto Rican 6% Cuban 19% Dominican 3%
- Common ancestry
- Hispanic 6% Romanian 1% Scotch-Irish 1%
- Foreign-born
- 47% · Canada, Jamaica, Vietnam
- Languages at home
- 40% English-only · Spanish 47% French/Haitian/Cajun 5% Other Indo-European 2%
Political lean MEDSL · Broward
- 2024 margin
- D (+17.0) · D 58.0% · R 41.0%
- 2008→2024 swing
- -17.8pp toward R · 2008: 34.7pp · 2024: 17.0pp
- All cycles
- 2024: D+17.0 2020: D+29.8 2016: D+35.0 2012: D+34.9 2008: D+34.7
Not yet ingested
- Civics
- —
Market trends
- HPI YoY
- ▼ -2.01%
- Current HPI
- 359.5973
- Rent YoY
- ▼ -0.20%
- Metro
- Miami-Fort Lauderdale-Pompano Beach, FL
- State GDP YoY
- ▲ 3.28%
- F500 in state
- 36
Industry mix (Fortune 500 HQ in FL)
| Industry | F500 HQs | Revenue |
|---|---|---|
| Industrial Technology | 2 | $29B |
|
||
| Insurance | 2 | $17B |
|
||
| Retail | 1 | $60B |
|
||
| Technology Distribution | 1 | $58B |
|
||
| Homebuilding | 1 | $35B |
|
||
| Technology Manufacturing | 1 | $35B |
|
||
Price history
+242.3% since first listed3 events — show timeline
- 2026-03-24 Listed $178,000 Beaches MLS
- 1989-09-01 Sold (Public Records) $55,000 Public Records
- 1988-04-01 Sold (Public Records) $52,000 Public Records
Property tax history
+3.1%/yrLatest (2025): $719 · +2.0% YoY. Source: county tax records.
Cash-flow waterfall
monthlySold comps — $/sqft
last 12 mo · ≤1 miLoading sold comps…