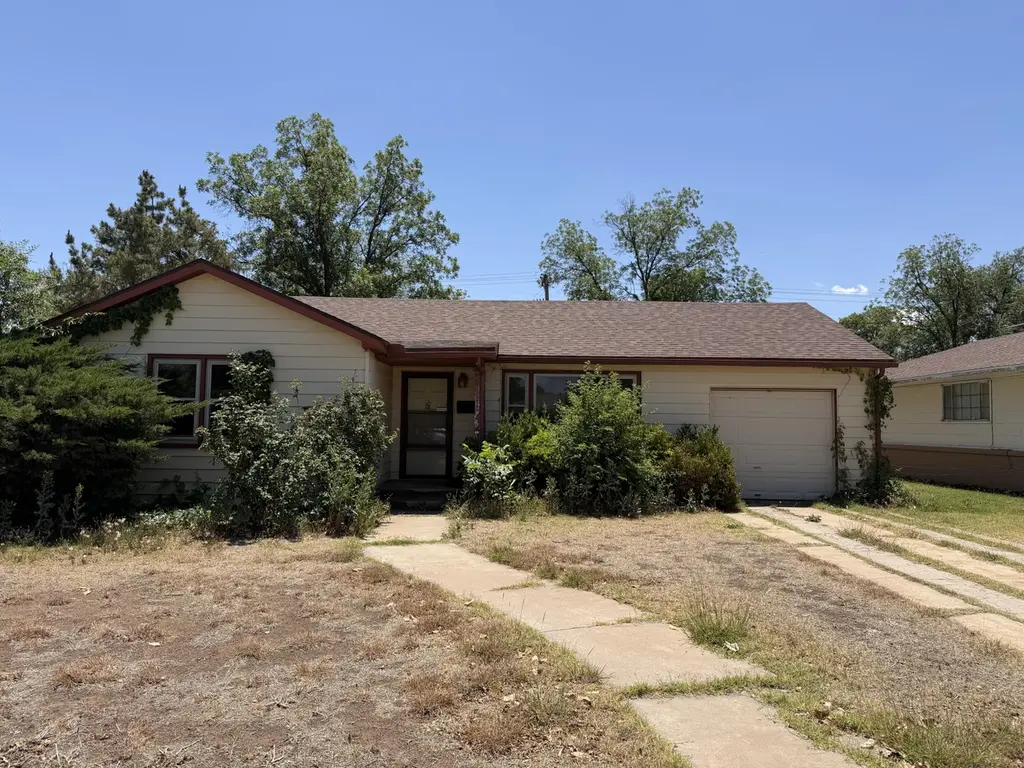
3609 27th St · Lubbock, TX
Flood risk 1/10 · Minimal
- FEMA flood zone
- X (unshaded)
- Chance of flooding over 30 yrs
- 0.0%
- Est. flood insurance / yr
- $507 – $1,088
Fire risk 1/10 · Minimal
- Est. fire insurance / yr
- $1,222 – $2,270
Heat risk 5/10 · Moderate
- Hot days now (above 99°F)
- 7 days/yr
- Hot days in 30 yrs
- 21 days/yr
Wind risk 2/10 · Minimal
- Chance of severe wind over 30 yrs
- —
Air-quality risk 2/10 · Minimal
- Unhealthy air days now
- 1 days/yr
- Unhealthy air days in 30 yrs
- 1 days/yr
Risk factors via First Street. Map © Google.
Why this score? — see what drove the C grade
The composite is a weighted blend of 9 inputs, each scored 0–100. Each bar is that input's sub-score; the figure is the points it added to the 100-point composite (weight × sub-score).
- Cash flow +22.0/30.0
- ARV discount +7.5/15.0
- DSCR +7.1/10.0
- 1% rule +6.7/10.0
- Livability +4.0/5.0
- Rent growth +3.9/5.0
- Schools +3.1/10.0
- Condition / age +2.5/5.0
- Appreciation +0.0/10.0
$105,000
🖨 Deal sheet 📄 Offer letter ✓ Due diligence
Listing remarks
Fixer-upper with potential! 2 bed, 1 bath home with 972 sq ft featuring a living room, dining room, and kitchen, and spacious bedrooms. Needs some love but it has newer windows in most of the home. Great investment or renovation opportunity.
Key facts
- Newer windows
- 9,938 sq ft lot
- Garage
Tags
Property features AI
Exterior
- Parking: Attached garage; Driveway; Garage (1-car)
- Utilities: Paved road access
- Home design: Single-family residence; Residential property; Fixer condition
- Construction: Metal siding; Composition roof; Pillar/post/pier foundation; Built area approximately 972
- Exterior features: Chain link fenced yard; Fenced
Interior
- Flooring: Carpet flooring
- Bathrooms: 1 full bathroom
- Heating & cooling: Central heating; Central air; Ceiling fan(s)
- Interior features: Ceiling fan(s)
Neighborhood map
What this means for you Summary
Snapshot
- This is a 3-bed/1.0-bath single-family listed at $105k.
Deal economics
- At list price, monthly cash flow is $168 ($2k/yr) — positive.
- The deal already cash-flows at list — no discount required.
- Meets the 1% rule at list price ($1k rent vs $105k).
Location & tenants
- Location reads 80/100 on livability (#37 in TX, #1,749 nationally) — a professional / high-income tenant draw. Strengths: commute A+, cost of living A+, housing A+; Watch: employment C-, schools D+, crime F.
- Lubbock ISD (urban): math 36% / reading 39% proficiency, ranked #481 of 826 in TX (top 58%) — families likely to look elsewhere, expect single-tenant / working-renter base with shorter leases; 60% free/reduced lunch — lower-income household profile, screen leases tightly.
- Market conditions: Rents rising fast (+5.4%/yr); 110 active listings in the ZIP; 40 comparable units currently listed for rent nearby; rentals at typical pace (median 21d on market — plan ~3-4 weeks tenant-placement turnaround); lower-income renter base — watch delinquency; 2,219 units permitted in Lubbock County in 2024 (252 in 5+ unit buildings).
- This rent runs 33% of the median local income ($45k/yr) — at the standard rent-burdened threshold; future hikes will face affordability resistance.
Forward outlook
- Local home prices are declining (-3.0%/yr); year-one equity from $726 of loan paydown is wiped out by about $3k of value loss. Plan a longer hold.
- Lubbock County population projected at +39% by 2050 — long-run rental-demand tailwind backs the buy-and-hold thesis.
- At projected returns (-3.0% appreciation + 5.4% rent growth), your $29k cash investment doubles in ~10 years — after that, you're playing with house money.
Negotiation context
- Only 3 days on market — expect competitive offers; lowballing is unlikely to land.
Risks & watch-outs
- Watch-outs: built in 1950 — expect roof / HVAC / electrical / plumbing capex.
- Climate carrying-cost: extreme-heat days projected 7→21/yr by 2055 (HVAC capex compounding) — expect insurance premiums to compound above CPI over the hold.
Questions for the listing agent
- Built in 1950 — when were the roof, HVAC, electrical panel, plumbing, and water heater last replaced?
- Is there a deadline driving the sale (1031 exchange, divorce, estate, relocation)? That informs how much negotiation room exists.
- Schools are D-rated, which usually means shorter tenancies and higher turnover. Who's the typical renter profile here, and what's been the actual vacancy rate?
- Crime grade is F in this area — have there been break-ins, vandalism, or insurance claims at this property in the last 3 years? What carrier currently insures it and at what premium?
- What's the average days-on-market for RENTAL listings here right now (not sales)? A rising rental-DOM trend means longer vacancies and softer asking-rent achievability than the comps imply.
- What's the recent tenant-quality profile in this submarket — average credit score on applications, eviction rate, late-payment / NSF rate, and stable-employment percentage? A property-management company in the area should have these aggregated.
- How much new for-sale + rental construction is in the pipeline within 1–3 miles? Heavy new supply typically softens prices + rents 12–24 months out; constrained supply supports both.
Investment metrics
- 1% rule
- 1.17% ✓
- Cap rate
- 8.21%
- Cash-on-cash
- 6.86%
- DSCR
- 1.31
- GRM
- 7.1
CMA / ARV
No comps found within radius.
Projected returns pro-forma
-3.0% appreciation · 5.4% rent growth · sell at horizon
- IRR
- -2.8%
- Equity multiple
- 0.89×
- Total profit
- $-3,199
- Equity at exit
- $15,656
- IRR
- 9.6%
- Equity multiple
- 1.83×
- Total profit
- $24,377
- Equity at exit
- $9,078
Cash invested: $29,400 (down + closing). Projections, not guarantees.
Landlord ↔ Tenant lean methodology
- Overall (STATE)
- 87 Strongly Landlord-Friendly
- State Texas
- 87 Strongly Landlord-Friendly · R+5
- County
- — inherits STATE
- City
- — inherits STATE
ZIP-level market 79410
- Home prices YoY
- -20.8%
- Rents YoY
- 5.4%
- Active inventory
- 110
- Price-to-rent
- 7.1×
Monthly cashflow live
- Estimated rent
- $1,230 high interval (Pro) →
- Mortgage (P&I)
- −$551
- Tax from tax record
- −$209 /mo · $2,506/yr
- Insurance
- −$44
- HOA
- −$0
- Vacancy / Maint / Mgmt
- −$258
- Net cashflow
- $168
Break-even live
UW: 25.0% down · 7.5% · 30yr · 1.5% tax · 5.0% vac · 8.0% maint · 8.0% mgmt
Financing live
Cash to close
- Down payment
- $26,250
- Closing costs
- $3,150
- Reserves months
- —
- Total cash needed
- —
Loan-product check · same deal, 3 products live
Conventional
25% down · 7.5% · 30yr
- Down + closing
- —
- Monthly P&I
- —
- Monthly cashflow
- —
- DSCR
- —
- Eligible?
- —
Personal DTI + credit; lowest rate.
DSCR
20% down · 8.5% · 30yr
- Down + closing
- —
- Monthly P&I
- —
- Monthly cashflow
- —
- DSCR
- —
- Eligible?
- —
No personal income docs; deal must DSCR.
Hard money
10% down · 12.0% · 12mo
- Down + closing
- —
- Monthly P&I
- —
- Monthly cashflow
- —
- DSCR
- —
- Eligible?
- —
Short-term bridge; refi at stabilization.
Rent comps 40 comps
| Address | Beds | Baths | Sqft | Rent | $/sqft | DOM | Units | Dist |
|---|---|---|---|---|---|---|---|---|
| 3505 29th St Lubbock, TX | 3.0 | 1.0 | 1031 | $1,300 | $1.26 | 13d | 1 | 0.17mi |
| 3714 26th St Lubbock, TX | 2.0 | 1.0 | 894 | $1,175 | $1.31 | 44d | 1 | 0.19mi |
| 2501 Louisville Ave Lubbock, TX | 3.0 | 1.0 | 1033 | $1,099 | $1.06 | 43d | 1 | 0.20mi |
| 3409 27th St Lubbock, TX | 3.0 | 1.0 | 1031 | $1,250 | $1.21 | 21d | 1 | 0.25mi |
| 3614 32nd St Lubbock, TX | 2.0 | 1.0 | 759 | $900 | $1.19 | 13d | 1 | 0.25mi |
| 3414 26th St Unit B Lubbock, TX | 2.0 | 1.0 | 835 | $950 | $1.14 | 43d | 1 | 0.26mi |
| 3618 32nd St Lubbock, TX | 2.0 | 1.0 | 924 | $1,650 | $1.79 | 43d | 1 | 0.26mi |
| 3601 23rd St Unit A Lubbock, TX | 2.0 | 1.0 | 856 | $949 | $1.11 | 43d | 1 | 0.28mi |
| 3709 23rd St Lubbock, TX | 3.0 | 1.0 | 1107 | $950 | $0.86 | 43d | 1 | 0.31mi |
| 3813 33rd St Lubbock, TX | 3.0 | 1.0 | 1018 | $1,295 | $1.27 | 21d | 1 | 0.44mi |
| 3221 33rd St Unit A Lubbock, TX | 2.0 | 1.0 | 982 | $925 | $0.94 | 13d | 1 | 0.56mi |
| 3408 Nashville Ave Unit A Lubbock, TX | 2.0 | 1.0 | 660 | $700 | $1.06 | 13d | 1 | 0.56mi |
| 3410 Nashville Ave Unit A Lubbock, TX | 2.0 | 1.0 | 700 | $675 | $0.96 | 43d | 1 | 0.58mi |
| 4006 36th St Unit A Lubbock, TX | 2.0 | 1.0 | 800 | $695 | $0.87 | 44d | 1 | 0.63mi |
| 3116 33rd St Lubbock, TX | 2.0 | 1.0 | 912 | $1,195 | $1.31 | 43d | 1 | 0.66mi |
| 3211 35th St Unit E Lubbock, TX | 2.0 | 1.0 | 850 | $850 | $1.00 | 43d | 1 | 0.68mi |
| 3211 35th St Unit A Lubbock, TX | 2.0 | 1.0 | 850 | $850 | $1.00 | 13d | 1 | 0.68mi |
| 3016 30th St Lubbock, TX | 2.0 | 1.0 | 947 | $975 | $1.03 | 43d | 1 | 0.72mi |
| 4407 31st St Lubbock, TX | 2.0 | 2.0 | 1000 | $899 | $0.90 | 21d | 1 | 0.78mi |
| 3506 Peoria Ave Unit B Lubbock, TX | 2.0 | 1.0 | 750 | $625 | $0.83 | 13d | 1 | 0.81mi |
| 3114 37th St Lubbock, TX | 3.0 | 1.0 | 988 | $1,095 | $1.11 | 43d | 1 | 0.82mi |
| 4103 17th St Unit A Lubbock, TX | 2.0 | 1.0 | 996 | $675 | $0.68 | 21d | 1 | 0.86mi |
| 2818 27th St Lubbock, TX | 2.0 | 2.0 | 1042 | $1,125 | $1.08 | 21d | 1 | 0.86mi |
| 3107 37th St Lubbock, TX | 2.0 | 1.0 | 750 | $1,095 | $1.46 | 21d | 1 | 0.87mi |
| 4124 18th St Lubbock, TX | 2.0 | 1.0 | 1020 | $925 | $0.91 | 43d | 1 | 0.88mi |
| 4423 31st St Unit 1 FS Lubbock, TX | 2.0 | 1.0 | 1024 | $885 | $0.86 | 21d | 1 | 0.88mi |
| 4425 31st St Unit Fs Lubbock, TX | 2.0 | 1.0 | 1000 | $899 | $0.90 | 21d | 1 | 0.89mi |
| 2823 33rd St Lubbock, TX | 3.0 | 1.0 | 1105 | $950 | $0.86 | 43d | 1 | 0.89mi |
| 4601 32nd St Lubbock, TX | 3.0 | 1.0 | 928 | $995 | $1.07 | 13d | 1 | 0.95mi |
| 4206 17th St Unit 3 Lubbock, TX | 2.0 | 1.0 | 800 | $895 | $1.12 | 21d | 1 | 0.97mi |
| 4510 35th St Unit A Lubbock, TX | 2.0 | 1.0 | 888 | $750 | $0.84 | 21d | 1 | 0.98mi |
| 4510 35th St Unit A Lubbock, TX | 2.0 | 1.0 | 888 | $750 | $0.84 | 43d | 1 | 0.98mi |
| 4409 38th St Lubbock, TX | 3.0 | 1.5 | 1000 | $1,350 | $1.35 | 13d | 1 | 1.00mi |
| 2723 36th St Lubbock, TX | 2.0 | 1.0 | 802 | $950 | $1.18 | 21d | 1 | 1.08mi |
| 3333 Toledo Ave Lubbock, TX | 2.0 | 1.0–1.5 | 924 | $741 | $0.80 | 13d | 7 | 1.08mi |
| 2816 40th St Lubbock, TX | 2.0 | 1.0 | 826 | $825 | $1.00 | 21d | 1 | 1.12mi |
| 3019 42nd St Lubbock, TX | 3.0 | 1.0 | 1053 | $1,250 | $1.19 | 21d | 1 | 1.14mi |
| 2701 36th St Lubbock, TX | 2.0 | 1.0 | 802 | $1,195 | $1.49 | 13d | 1 | 1.17mi |
| 2602 28th St Lubbock, TX | 2.0 | 1.0 | 937 | $1,095 | $1.17 | 21d | 1 | 1.17mi |
| 2616 37th St Lubbock, TX | 2.0 | 1.0 | 950 | $1,200 | $1.26 | 21d | 1 | 1.22mi |
Listing history 1 events
-
2026-05-25$105,000 Active
ⓘ Source: listings_history table (triggers on properties + properties_extension) + one-shot
backfill from property_details.listing_events for pre-trigger history.
Tax reassessment forecast TX · Resets to sale price
- Current annual tax
- $2,506 · $209/mo
- Projected year-2 tax
- $2,506 · $209/mo
- Expected delta
- $0/yr ($0/mo · 0.0%)
ⓘ Screening estimate from a state-policy table — verify with the county assessor before closing.
Climate risk First Street
- Flood 1/10 Low FEMA zone X (unshaded) · 0% chance over 30 yrs
- Wildfire 1/10 Low
- Heat 5/10 Major 7 d/yr ≥99°F today · 21 d/yr by 30 yrs out
- Wind 2/10 Low
- Air quality 2/10 Low 1 unhealthy d/yr today · 1 by 30 yrs out
Nearby sold comps map
Loading sold comps map…
Walkable amenities ~0.75 mi
Loading nearby amenities…
Taxation est. · year 1
- Rental income
- $14,755
- − Mortgage interest
- −$5,882
- − Property taxes
- −$2,506
- − Insurance
- −$525
- − Repairs & maintenance
- −$1,180
- − Management
- −$1,180
- − Depreciation
- −$3,055
- Taxable income
- $427
- Est. tax owed @ 24.0%
- −$102
- After-tax cash flow
- $1,915/yr
For passive investors: Depreciation is non-cash, so a rental often shows a tax loss while cash-flowing — sheltering income. Rental losses are passive: they offset passive income freely, and up to $25,000/yr can offset ordinary (W-2) income if you actively participate and your MAGI is under $100k (phasing out to $0 by $150k); unused losses carry forward. On sale, claimed depreciation is recaptured at up to 25%, and gains may owe capital-gains tax (a 1031 exchange can defer both). Figures are a year-1 estimate at your 24.0% rate — not tax advice; consult a CPA.
Schools (NCES district)
- District
- Lubbock ISD
- NCES district ID
- 4828500
- Math proficiency
- 36% ▼ -8.00%
- Reading proficiency
- 39% ▼ -1.00%
- Median HH income
- $39,820
- Composite
- 31.44/100
- National rank
- #5984
- State rank
- #481 of 826 in TX
Livability — Lubbock
- Score
- 80/100
- State rank
- #37
- US rank
- #1749
Category grades
Schools grade is shown separately in the Schools card above.
Census & demographics
- Census place
- Lubbock, TX
- County
- Lubbock County · 293,542 people
- City population
- 283,030
- Metro
- Lubbock, TX
- Population (ZIP)
- 10,137
- Household income
- $44,537
- Rent vs Own
- Severe rent burden
- 1068.0
Population outlook (Lubbock County) Hauer SSP2
- Today (2025)
- 345,960 people
- By 2030
- 371,449 · +7.4%
- By 2040
- 424,539 · +22.7%
- By 2050
- 481,150 · +39.1%
- By 2075
- 633,467 · +83.1%
- By 2100
- 746,853 · +115.9%
Race, ethnicity, and origin ACS 2023
- Neighborhood character
- Diverse neighborhood (Simpson 0.58)
- Race & ethnicity
- White 55% Hispanic / Latino 33% Two or more races 15% Black 5% Asian 4%
- Hispanic origin (detail)
- Mexican 29%
- Common ancestry
- Slovak 3% Lithuanian 2% Italian 2%
- Foreign-born
- 6% · China, Canada, Vietnam
- Languages at home
- 80% English-only · Spanish 15% Chinese 2% Vietnamese 1%
Political lean MEDSL · Lubbock
- 2024 margin
- Solid R (+39.5) · D 29.7% · R 69.2% · Other 1.0%
- 2008→2024 swing
- -2.8pp toward R · 2008: -36.7pp · 2024: -39.5pp
- All cycles
- 2024: R+39.5 2020: R+32.2 2016: R+38.4 2012: R+40.9 2008: R+36.7
Not yet ingested
- Civics
- —
Market trends
- HPI YoY
- ▼ -71.78%
- Current HPI
- 272.7482
- Rent YoY
- ▲ 5.40%
- Metro
- Lubbock, TX
- State GDP YoY
- ▲ 3.95%
- F500 in state
- 110
Industry mix (Fortune 500 HQ in TX)
| Industry | F500 HQs | Revenue |
|---|---|---|
| Energy | 16 | $1,198B |
|
||
| Technology | 5 | $198B |
|
||
| Engineering / Construction | 4 | $72B |
|
||
| Energy Services | 3 | $60B |
|
||
| Utilities | 3 | $41B |
|
||
| Healthcare | 2 | $330B |
|
||
Price history
1 event — show timeline
- 2026-05-25 Listed $105,000 LARMLS
Property tax history
+5.0%/yrLatest (2025): $2,506 · +2.9% YoY. Source: county tax records.
Cash-flow waterfall
monthlySold comps — $/sqft
last 12 mo · ≤1 miLoading sold comps…