 🏗️ New Construction
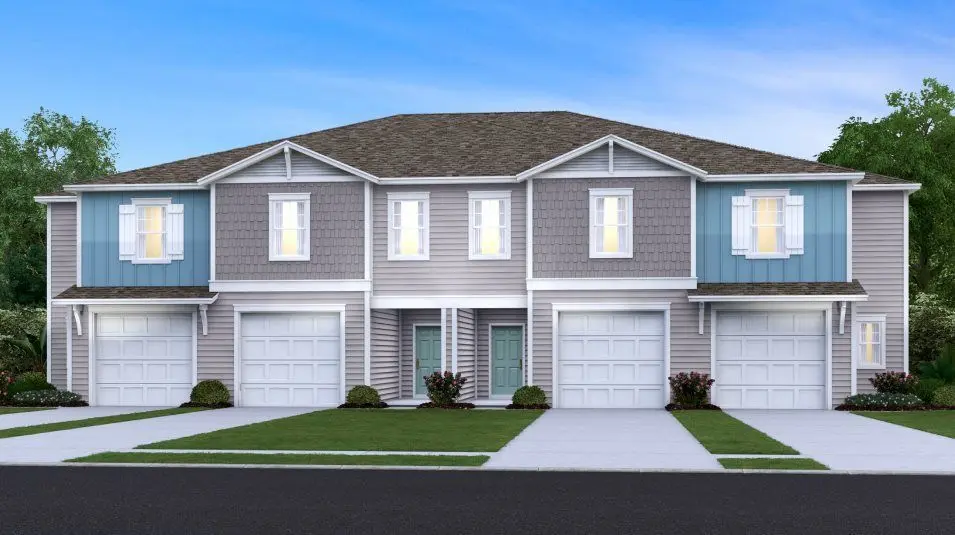
Lincoln Plan · Ocala, FL
Flood risk No data
- FEMA flood zone
- —
- Chance of flooding over 30 yrs
- —
- Est. flood insurance / yr
- —
Fire risk No data
- Est. fire insurance / yr
- —
Heat risk No data
- Hot days now (above threshold)
- —
- Hot days in 30 yrs
- —
Wind risk No data
- Chance of severe wind over 30 yrs
- —
Air-quality risk No data
- Unhealthy air days now
- —
- Unhealthy air days in 30 yrs
- —
Risk factors via First Street. Map © Google.
Why this score? — see what drove the D grade
The composite is a weighted blend of 9 inputs, each scored 0–100. Each bar is that input's sub-score; the figure is the points it added to the 100-point composite (weight × sub-score).
- Cash flow +12.4/30.0
- ARV discount +7.5/15.0
- Condition / age +4.8/5.0
- DSCR +3.7/10.0
- Schools +3.6/10.0
- 1% rule +3.5/10.0
- Livability +3.5/5.0
- Rent growth +3.2/5.0
- Appreciation +0.0/10.0
$213,990
🖨 Deal sheet (PDF) 📄 Offer letter ✓ Due diligence
Listing remarks MLS
The first level of this two-story townhome features an open-concept design, allowing a seamless transition between the gathering room, kitchen and nook. A covered lanai offers convenient indoor-outdoor dining and entertaining, while three bedrooms and a loft occupy the second floor.
Key facts
- Open-concept design
- Gathering room
- Kitchen
Tags
Neighborhood map
What this means for you Summary
Snapshot
- This is a 3-bed/2.5-bath townhouse listed at $214k. Condition is rated excellent.
Deal economics
- At list price, monthly cash flow is $-35 ($-426/yr) — negative.
- To cash-flow at today's rent, offer at most $214k (0.1% below list).
- To meet the 1% rule (rent ≥ 1% of price), the offer needs to be $187k (12.6% below list).
- Recommended offer: $187k (12.6% below list) — sets the bar for 1% rule.
- Cap rate 6.1% vs local median 4.1% in Ocala — top-decile yield for the area; either an underpriced asset or a hidden risk that comps aren't pricing in. Stress-test before assuming the spread holds.
Location & tenants
- Location reads 69/100 on livability (#476 in FL) — a middle-class / working-renter tenant base. Strengths: cost of living A+, housing A+, health & safety A+; Watch: crime F, amenities F, commute F.
- Marion (rural): math 42% / reading 43% proficiency, ranked #61 of 73 in FL (top 84%) — families likely to look elsewhere, expect single-tenant / working-renter base with shorter leases; 61% free/reduced lunch — lower-income household profile, screen leases tightly.
- Zoned schools: South Ocala Elementary School (math 45% / reading 43%, grade F, #1,330 of 2,144 statewide, top 63%, 715 students, 60% FRL); Osceola Middle School (math 60% / reading 58%, grade B, #144 of 571 statewide, top 26%, 999 students, 44% FRL); Forest High School (math 36% / reading 54%, grade D-, #228 of 667 statewide, top 35%, 2,325 students, 42% FRL).
- Market conditions: Rents rising (+2.8%/yr); 350 active listings in the ZIP; 10 comparable units currently listed for rent nearby; rentals at typical pace (median 23d on market — plan ~3-4 weeks tenant-placement turnaround); solid renter incomes; 7,071 units permitted in Marion County in 2024 (534 in 5+ unit buildings).
Forward outlook
- Local home prices are declining (-3.0%/yr); year-one equity from $2k of loan paydown is wiped out by about $7k of value loss. Plan a longer hold.
- Marion County population projected at +13% by 2050 — modest demand growth; plan on rents tracking national, not racing it.
Negotiation context
- It's been on market 245 days — a 12% lower offer ($188k) is reasonable based on typical stale-listing flexibility.
- 2 sale attempts with the ask held roughly flat each time — persistent listings suggest the price (not the market) is what's stuck; bring a comps-based counter.
Questions for the listing agent
- What do current leases actually rent for vs. the listed asking? Can we see a recent rent roll and the last 12 months of T-12 income?
- It's been on market 245 days. Have you received any prior offers? Is the seller open to a 13% concession, seller financing, or rate buy-down credit?
- Why hasn't it sold? Are there any deal-killer items the seller is aware of (foundation, flood, title, zoning, code violations)?
- Is there a deadline driving the sale (1031 exchange, divorce, estate, relocation)? That informs how much negotiation room exists.
- Crime grade is F in this area — have there been break-ins, vandalism, or insurance claims at this property in the last 3 years? What carrier currently insures it and at what premium?
- The area grade is low — what's the realistic commute time and amenity access for the typical tenant pool here? Any planned neighborhood developments (good or bad) we should know about?
- What's the average days-on-market for RENTAL listings here right now (not sales)? A rising rental-DOM trend means longer vacancies and softer asking-rent achievability than the comps imply.
- What's the recent tenant-quality profile in this submarket — average credit score on applications, eviction rate, late-payment / NSF rate, and stable-employment percentage? A property-management company in the area should have these aggregated.
- How much new for-sale + rental construction is in the pipeline within 1–3 miles? Heavy new supply typically softens prices + rents 12–24 months out; constrained supply supports both.
Investment metrics
- 1% rule
- 0.85% ✗
- Cap rate
- 6.10%
- Cash-on-cash
- -0.69%
- DSCR
- 0.97
- GRM
- 9.8
CMA / ARV
- ARV (median comp)
- $218,902
- List price
- $213,990
- Delta
- -2.24%
- Verdict
- FAIR
- Comps
- 14 within 1.0 mi
Show comp detail 10 sales within ~0.75 mi
| Address | Dist | Beds/Ba | Sqft | Sold | Price | $/sf | Match |
|---|---|---|---|---|---|---|---|
| 3633 SE 37th Ave Rd | 0.17mi | 3/2.5 | 1,682 (+1%) | 2mo | $220,000 | $131 | 89 |
| 3517 SE 37th Ct | 0.05mi | 3/2.5 | 1,707 (+2%) | 9mo | $217,000 | $127 | 87 |
| 3483 SE 37th Ct | 0.04mi | 3/2.5 | 1,708 (+2%) | 10mo | $209,900 | $123 | 86 |
| 3594 SE 37th Ct | 0.06mi | 3/2.5 | 1,714 (+2%) | 10mo | $207,080 | $121 | 85 |
| 3617 SE 37th Ct | 0.14mi | 3/2.5 | 1,707 (+2%) | 7mo | $225,080 | $132 | 84 |
| 3534 SE 37th Ct | 0.06mi | 3/2.5 | 1,710 (+2%) | 13mo | $201,080 | $118 | 83 |
| 3522 SE 37th Ct | 0.06mi | 3/2.5 | 1,707 (+2%) | 14mo | $227,485 | $133 | 82 |
| 3532 SE 37th Avenue Rd | 0.07mi | 3/2.5 | 1,707 (+2%) | 19mo | $224,994 | $132 | 77 |
| 3452 SE 37th Avenue Rd | 0.07mi | 3/2.5 | 1,707 (+2%) | 22mo | $220,000 | $129 | 75 |
| 3500 SE 37th Avenue Rd | 0.07mi | 3/2.5 | 1,782 (+7%) | 23mo | $283,994 | $159 | 67 |
Match score weights: distance 35% · size 25% · config 20% · recency 20%. Top-matched comps best support the ARV.
Projected returns pro-forma
-3.0% appreciation · 2.84% rent growth · sell at horizon
- IRR
- -17.6%
- Equity multiple
- 0.38×
- Total profit
- $-38,003
- Equity at exit
- $32,639
- IRR
- -10.0%
- Equity multiple
- 0.39×
- Total profit
- $-37,116
- Equity at exit
- $18,927
Cash invested: $61,292 (down + closing). Projections, not guarantees.
Landlord ↔ Tenant lean methodology
- Overall (STATE)
- 87 Strongly Landlord-Friendly
- State Florida
- 87 Strongly Landlord-Friendly · R+3
- County
- — inherits STATE
- City
- — inherits STATE
ZIP-level market 34480
- Home prices YoY
- -28.7%
- Rents YoY
- 2.8%
- Active inventory
- 350
- Price-to-rent
- 9.5×
Monthly cashflow live
- Estimated rent
- $1,870 high interval (Pro) →
- Mortgage (P&I)
- −$1,148
- Tax est. 1.5%
- −$274 /mo · $3,284/yr
- Insurance
- −$91
- HOA
- −$0
- Vacancy / Maint / Mgmt
- −$393
- Net cashflow
- $-35
Break-even live
Sensitivity live
| Price | -10% $116 | -5% $40 | +0% $-35 | +5% $-111 | +10% $-187 |
|---|---|---|---|---|---|
| Rent | -10% $-183 | -5% $-109 | +0% $-35 | +5% $38 | +10% $112 |
| Rate | -1.0pp $75 | -0.5pp $20 | base $-35 | +0.5pp $-92 | +1.0pp $-150 |
UW: 25.0% down · 7.5% · 30yr · 1.5% tax · 5.0% vac · 8.0% maint · 8.0% mgmt
Financing live
Cash to close
- Down payment
- $54,725
- Closing costs
- $6,567
- Reserves months
- —
- Total cash needed
- —
Loan-product check · same deal, 3 products live
Conventional
25% down · 7.5% · 30yr
- Down + closing
- —
- Monthly P&I
- —
- Monthly cashflow
- —
- DSCR
- —
- Eligible?
- —
Personal DTI + credit; lowest rate.
DSCR
20% down · 8.5% · 30yr
- Down + closing
- —
- Monthly P&I
- —
- Monthly cashflow
- —
- DSCR
- —
- Eligible?
- —
No personal income docs; deal must DSCR.
Hard money
10% down · 12.0% · 12mo
- Down + closing
- —
- Monthly P&I
- —
- Monthly cashflow
- —
- DSCR
- —
- Eligible?
- —
Short-term bridge; refi at stabilization.
Rent comps 10 comps
| Address | Beds | Baths | Sqft | Rent | $/sqft | DOM | Units | Dist |
|---|---|---|---|---|---|---|---|---|
| 3339 SE 37th Avenue Rd Ocala, FL | 3.0 | 2.5 | 1828 | $1,900 | $1.04 | 15d | 1 | 0.04mi |
| 3488 SE 37th Avenue Rd Ocala, FL | 3.0 | 2.5 | 1708 | $1,800 | $1.05 | 23d | 1 | 0.08mi |
| 3663 SE 37th Avenue Rd Ocala, FL | 3.0 | 2.5 | 1707 | $1,825 | $1.07 | 23d | 1 | 0.20mi |
| 3674 SE 37th Ct Ocala, FL | 3.0 | 2.5 | 1708 | $1,800 | $1.05 | 15d | 1 | 0.21mi |
| 3700 SE 34th Ct Ocala, FL | 3.0 | 2.0 | 1508 | $2,050 | $1.36 | 23d | 1 | 0.39mi |
| 4549 SE 25th Loop Ocala, FL | 3.0 | 2.0 | 1490 | $1,850 | $1.24 | 23d | 1 | 0.98mi |
| 2700 SE 35th St Ocala, FL | 3.0 | 2.0 | 1977 | $2,500 | $1.26 | 23d | 1 | 1.00mi |
| 4861 SE 31st Ter Ocala, FL | 3.0 | 2.0 | 1482 | $1,700 | $1.15 | 23d | 1 | 1.18mi |
| 4760 SE 30th Ct Ocala, FL | 3.0 | 2.0 | 1520 | $1,500 | $0.99 | 23d | 1 | 1.20mi |
| 1311 SE 39th Ct Ocala, FL | 3.0 | 2.0 | 2121 | $2,500 | $1.18 | 15d | 1 | 1.45mi |
Listing history 21 events
-
2026-06-22days on market $213,990 Active 245 DOM
-
2026-06-18days on market $213,990 Active 242 DOM
-
2026-06-17days on market $213,990 Active 241 DOM
-
2026-06-16days on market $213,990 Active 240 DOM
-
2026-06-15days on market $213,990 Active 239 DOM
-
2026-06-14days on market $213,990 Active 237 DOM
-
2026-06-13days on market $213,990 Active 236 DOM
-
2026-06-10days on market $213,990 Active 234 DOM
-
2026-06-09days on market $213,990 Active 233 DOM
-
2026-06-08days on market $213,990 Active 232 DOM
-
2026-06-07days on market $213,990 Active 231 DOM
-
2026-06-03days on market $213,990 Active 227 DOM
-
2026-06-03price $213,990 Active 226 DOM
-
2026-06-02days on market $210,990 Active 226 DOM
-
2026-05-31days on market $210,990 Active 224 DOM
-
2026-05-30days on market $210,990 Active 223 DOM
-
2026-03-18price $210,990 283-char remark
Show marketing remark (283 chars)
The first level of this two-story townhome features an open-concept design, allowing a seamless transition between the gathering room, kitchen and nook. A covered lanai offers convenient indoor-outdoor dining and entertaining, while three bedrooms and a loft occupy the second floor.
-
2026-02-13status Active 283-char remark
Show marketing remark (283 chars)
The first level of this two-story townhome features an open-concept design, allowing a seamless transition between the gathering room, kitchen and nook. A covered lanai offers convenient indoor-outdoor dining and entertaining, while three bedrooms and a loft occupy the second floor.
-
2026-01-06historical 283-char remark
Show marketing remark (283 chars)
The first level of this two-story townhome features an open-concept design, allowing a seamless transition between the gathering room, kitchen and nook. A covered lanai offers convenient indoor-outdoor dining and entertaining, while three bedrooms and a loft occupy the second floor.
-
2025-12-09price $215,990 283-char remark
Show marketing remark (283 chars)
The first level of this two-story townhome features an open-concept design, allowing a seamless transition between the gathering room, kitchen and nook. A covered lanai offers convenient indoor-outdoor dining and entertaining, while three bedrooms and a loft occupy the second floor.
-
2025-09-11$212,990 Active 283-char remark
Show marketing remark (283 chars)
The first level of this two-story townhome features an open-concept design, allowing a seamless transition between the gathering room, kitchen and nook. A covered lanai offers convenient indoor-outdoor dining and entertaining, while three bedrooms and a loft occupy the second floor.
ⓘ Source: listings_history table (triggers on properties + properties_extension) + one-shot
backfill from property_details.listing_events for pre-trigger history.
Nearby sold comps map
Loading sold comps map…
Walkable amenities ~0.75 mi
Loading nearby amenities…
Taxation est. · year 1
- Rental income
- $22,440
- − Mortgage interest
- −$12,262
- − Property taxes
- −$3,284
- − Insurance
- −$1,095
- − Repairs & maintenance
- −$1,795
- − Management
- −$1,795
- − Depreciation
- −$6,368
- Taxable loss
- −$4,158
- Est. tax savings @ 24.0%
- +$998
- After-tax cash flow
- $572/yr
For passive investors: Depreciation is non-cash, so a rental often shows a tax loss while cash-flowing — sheltering income. Rental losses are passive: they offset passive income freely, and up to $25,000/yr can offset ordinary (W-2) income if you actively participate and your MAGI is under $100k (phasing out to $0 by $150k); unused losses carry forward. On sale, claimed depreciation is recaptured at up to 25%, and gains may owe capital-gains tax (a 1031 exchange can defer both). Figures are a year-1 estimate at your 24.0% rate — not tax advice; consult a CPA.
Condition & rehab AI · 14 photos
This two-story townhome is in excellent condition with no visible repairs needed. It offers a good investment opportunity with potential for value enhancement through minor updates.
Value-add opportunities
- Both Painting the exterior — Fresh paint can enhance curb appeal and property value.
- Both Landscaping improvements — A well-maintained landscape can increase both resale and rental value.
- Both Interior touch-ups — Updating the interior can make the home more appealing to potential buyers or renters.
Renovation cost estimate screening
Value-add ROI direction
- Both Painting the exterior — Fresh paint can enhance curb appeal and property value. ↑
- Both Landscaping improvements — A well-maintained landscape can increase both resale and rental value. ↑
- Both Interior touch-ups — Updating the interior can make the home more appealing to potential buyers or renters. ↑
ⓘ Cost ranges are severity-bucket heuristics (US national rule-of-thumb). Get contractor quotes + a written scope before underwriting a rehab budget.
Schools (NCES district)
- District
- Marion
- NCES district ID
- 1201260
- Math proficiency
- 42% ▼ -7.00%
- Reading proficiency
- 43% ▼ -4.00%
- Median HH income
- $40,015
- Composite
- 35.61/100
- National rank
- #4890
- State rank
- #61 of 73 in FL
Livability — Ocala
- Score
- 69/100
- State rank
- #476
- US rank
- #8461
Category grades
Schools grade is shown separately in the Schools card above.
Census & demographics
- County
- Marion County · 315,796 people
- City population
- 263,375
- Metro
- Ocala, FL
- Population (ZIP)
- 23,517
- Household income
- $77,557
- Rent vs Own
- Severe rent burden
- 169.0
Population outlook (Marion County) Hauer SSP2
- Today (2025)
- 365,905 people
- By 2030
- 376,768 · +3.0%
- By 2040
- 396,555 · +8.4%
- By 2050
- 412,723 · +12.8%
- By 2075
- 446,090 · +21.9%
- By 2100
- 436,193 · +19.2%
Race, ethnicity, and origin ACS 2023
- Neighborhood character
- Predominantly White (73%)
- Race & ethnicity
- White 73% Hispanic / Latino 15% Two or more races 11% Black 6% Asian 2%
- Hispanic origin (detail)
- Mexican 3% Puerto Rican 5% Cuban 2% Dominican 2%
- Common ancestry
- Italian 3% Slovak 3% Lithuanian 2%
- Foreign-born
- 6% · Canada
- Languages at home
- 89% English-only · Spanish 9% Other Asian/Pacific 1%
Political lean MEDSL · Marion
- 2024 margin
- Solid R (+31.6) · D 33.8% · R 65.5%
- 2008→2024 swing
- -20.0pp toward R · 2008: -11.6pp · 2024: -31.6pp
- All cycles
- 2024: R+31.6 2020: R+25.9 2016: R+26.2 2012: R+16.2 2008: R+11.6
Not yet ingested
- Civics
- —
Market trends
- HPI YoY
- ▼ -85.60%
- Current HPI
- 212.4262
- Rent YoY
- ▲ 2.84%
- Metro
- Ocala, FL
- State GDP YoY
- ▲ 3.28%
- F500 in state
- 36
Industry mix (Fortune 500 HQ in FL)
| Industry | F500 HQs | Revenue |
|---|---|---|
| Industrial Technology | 2 | $29B |
|
||
| Insurance | 2 | $17B |
|
||
| Retail | 1 | $60B |
|
||
| Technology Distribution | 1 | $58B |
|
||
| Homebuilding | 1 | $35B |
|
||
| Technology Manufacturing | 1 | $35B |
|
||
Price history
-0.9% since first listed5 events — show timeline
- 2026-03-18 Price Changed $210,990 Zillow
- 2026-02-13 Relisted — Zillow
- 2026-01-06 Delisted — Zillow
- 2025-12-09 Price Changed $215,990 Zillow
- 2025-09-11 Listed $212,990 Zillow
Cash-flow waterfall
monthlySold comps — $/sqft
last 12 mo · ≤1 miLoading sold comps…