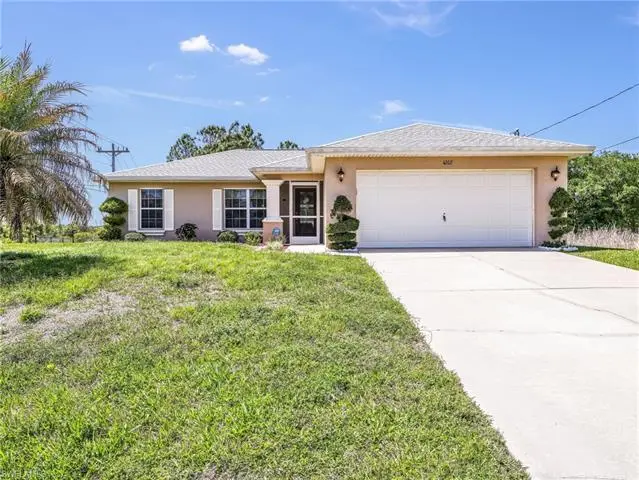
4202 S Unice Ave · Lehigh Acres, FL
Flood risk No data
- FEMA flood zone
- —
- Chance of flooding over 30 yrs
- —
- Est. flood insurance / yr
- —
Fire risk No data
- Est. fire insurance / yr
- —
Heat risk No data
- Hot days now (above threshold)
- —
- Hot days in 30 yrs
- —
Wind risk No data
- Chance of severe wind over 30 yrs
- —
Air-quality risk No data
- Unhealthy air days now
- —
- Unhealthy air days in 30 yrs
- —
Risk factors via First Street. Map © Google.
Why this score? — see what drove the F grade
The composite is a weighted blend of 9 inputs, each scored 0–100. Each bar is that input's sub-score; the figure is the points it added to the 100-point composite (weight × sub-score).
- Appreciation +10.0/10.0
- Cash flow +7.7/30.0
- Schools +4.1/10.0
- Livability +3.0/5.0
- Condition / age +2.5/5.0
- Rent growth +2.1/5.0
- DSCR +1.8/10.0
- 1% rule +1.1/10.0
- ARV discount +0.0/15.0
$349,000
🖨 Deal sheet (PDF) 📄 Offer letter ✓ Due diligence
Listing remarks
This beautifully updated 3 bedroom, 2 bathroom pool home offers 1,272 square feet of living space on an oversized 0.35 acre elevated corner lot with no HOA. From the moment you arrive, the space, privacy, and pride of ownership are evident throughout. Inside, the vaulted ceilings and abundant natural light create an open, airy feel throughout the home. The updated kitchen features modern appliances, a pantry, and stylish finishes. The updated flooring flows throughout the home, tying everything together beautifully. The primary bathroom features a roomy walk-in shower while the guest bathroom has a shower/tub combo. Every major system has been addressed, giving buyers true peace of mind fro
Key facts
- Oversized corner lot
- Covered lanai
- Updated kitchen
Tags
Property features AI
Finance
- Other: Property zoned RS-1; Corner lot; Lot acreage approximately 0.301; Subdivision: Lehigh Acres
- HOA & community: No HOA maintenance; No HOA amenities; Community type: See Remarks
Exterior
- Parking: Attached 2-car garage
- Utilities: Well water; Partial reverse osmosis system; Septic sewer; Cable available
- Home design: Residential single-family home; 1 story / ranch; Rear exposure faces west
- Construction: Concrete block construction; Stucco exterior finish; Shingle roof; Built in 2004
- Exterior features: Fence; Screened, below-ground concrete private pool (equipment stays); Single hung and sliding windows; Landscaped view
Interior
- Kitchen: Island; Pantry; Breakfast bar; Eat-in kitchen; Dishwasher; Microwave; Range; Self-cleaning oven; Refrigerator/freezer
- Bedrooms: 3 bedrooms; Split bedroom floor plan
- Flooring: Carpet; Laminate
- Bathrooms: 2 full bathrooms; Master bath with combination tub and shower
- Heating & cooling: Central electric heat; Central electric cooling
- Interior features: Cable prewire; Pantry; Vaulted ceiling; Walk-in closet; Guest bath; Guest room; Screened lanai/porch; Partially furnished; Water treatment (owned); Smoke detector
- Laundry & utility: Laundry in residence; Washer/dryer hookup
Neighborhood map
What this means for you Summary
Snapshot
- This is a 3-bed/2.0-bath single-family listed at $349k.
Deal economics
- At list price, monthly cash flow is $-405 ($-5k/yr) — negative.
- To cash-flow at today's rent, offer at most $278k (20.5% below list).
- To meet the 1% rule (rent ≥ 1% of price), the offer needs to be $214k (38.8% below list).
- Recommended offer: $214k (38.8% below list) — sets the bar for 1% rule.
Location & tenants
- Location reads 59/100 on livability (#826 in FL) — a working-class tenant base; expect higher turnover. Strengths: cost of living A+, housing A+; Watch: crime C-, employment D+, amenities F.
- Lee (suburban): math 47% / reading 50% proficiency, ranked #42 of 73 in FL (top 58%) — families likely to look elsewhere, expect single-tenant / working-renter base with shorter leases.
- Zoned schools: Veterans Park Academy For The Arts (math 41% / reading 45%, grade F, #1,366 of 2,144 statewide, top 64%, 2,133 students, 36% FRL); Oak Hammock Middle School (math 43% / reading 41%, grade D-, #340 of 571 statewide, top 61%, 1,563 students, 56% FRL); Lehigh Senior High School (math 23% / reading 45%, grade F, #394 of 667 statewide, top 60%, 2,476 students, 57% FRL).
- Market conditions: Rents soft (-1.5%/yr); 788 active listings in the ZIP; 29 comparable units currently listed for rent nearby; rentals at typical pace (median 18d on market — plan ~3-4 weeks tenant-placement turnaround); 15,411 units permitted in Lee County in 2024 (4,686 in 5+ unit buildings).
- This rent runs 35% of the median local income ($73k/yr) — at the standard rent-burdened threshold; future hikes will face affordability resistance.
Forward outlook
- In year one you build about $37k of equity ($2k loan paydown + $35k appreciation (10.0% local appreciation)).
- Lee County population projected at +44% by 2050 — long-run rental-demand tailwind backs the buy-and-hold thesis.
- By year 2, paydown + projected appreciation supports a ~$60k cash-out refi (75% LTV) — recoverable capital for the next deal without selling this one.
Negotiation context
- It's been on market 67 days — a 6% lower offer ($328k) is reasonable based on typical stale-listing flexibility.
- Current owner paid $245k; 42% above their basis — modest negotiation headroom, anchor on the comps not their cost.
Questions for the listing agent
- What do current leases actually rent for vs. the listed asking? Can we see a recent rent roll and the last 12 months of T-12 income?
- It's been on market 67 days. Have you received any prior offers? Is the seller open to a 39% concession, seller financing, or rate buy-down credit?
- Why hasn't it sold? Are there any deal-killer items the seller is aware of (foundation, flood, title, zoning, code violations)?
- Is there a deadline driving the sale (1031 exchange, divorce, estate, relocation)? That informs how much negotiation room exists.
- Schools are D-rated, which usually means shorter tenancies and higher turnover. Who's the typical renter profile here, and what's been the actual vacancy rate?
- The area grade is low — what's the realistic commute time and amenity access for the typical tenant pool here? Any planned neighborhood developments (good or bad) we should know about?
- What's the average days-on-market for RENTAL listings here right now (not sales)? A rising rental-DOM trend means longer vacancies and softer asking-rent achievability than the comps imply.
- What's the recent tenant-quality profile in this submarket — average credit score on applications, eviction rate, late-payment / NSF rate, and stable-employment percentage? A property-management company in the area should have these aggregated.
- How much new for-sale + rental construction is in the pipeline within 1–3 miles? Heavy new supply typically softens prices + rents 12–24 months out; constrained supply supports both.
Investment metrics
- 1% rule
- 0.61% ✗
- Cap rate
- 4.90%
- Cash-on-cash
- -4.97%
- DSCR
- 0.78
- GRM
- 13.6
CMA / ARV
- ARV (on-the-fly)
- $282,384
- Comps found
- 3
Show comp detail 3 sales within ~0.75 mi
| Address | Dist | Beds/Ba | Sqft | Sold | Price | $/sf | Match |
|---|---|---|---|---|---|---|---|
| 3210 38th St SW | 0.57mi | 3/2.0 | 1,285 (+1%) | 14mo | $284,990 | $222 | 60 |
| 3414 34th St SW | 0.56mi | 3/2.0 | 1,400 (+10%) | 13mo | $311,630 | $223 | 46 |
| 3304 Vera Ave S | 0.55mi | 3/2.0 | 1,430 (+12%) | 14mo | $305,000 | $213 | 42 |
Match score weights: distance 35% · size 25% · config 20% · recency 20%. Top-matched comps best support the ARV.
Projected returns pro-forma
10.0% appreciation · 0.0% rent growth · sell at horizon
- IRR
- 20.0%
- Equity multiple
- 2.62×
- Total profit
- $157,875
- Equity at exit
- $314,407
- IRR
- 17.8%
- Equity multiple
- 5.85×
- Total profit
- $473,655
- Equity at exit
- $678,030
Cash invested: $97,720 (down + closing). Projections, not guarantees.
Landlord ↔ Tenant lean methodology
- Overall (STATE)
- 87 Strongly Landlord-Friendly
- State Florida
- 87 Strongly Landlord-Friendly · R+3
- County
- — inherits STATE
- City
- — inherits STATE
ZIP-level market 33976
- Home prices YoY
- 6.8%
- Rents YoY
- -1.5%
- Active inventory
- 788
- Price-to-rent
- 13.6×
Monthly cashflow live
- Estimated rent
- $2,135 high interval (Pro) →
- Mortgage (P&I)
- −$1,830
- Tax from tax record
- −$116 /mo · $1,392/yr
- Insurance
- −$145
- HOA
- −$0
- Vacancy / Maint / Mgmt
- −$448
- Net cashflow
- $-405
Break-even live
Sensitivity live
| Price | -10% $-207 | -5% $-306 | +0% $-405 | +5% $-504 | +10% $-602 |
|---|---|---|---|---|---|
| Rent | -10% $-573 | -5% $-489 | +0% $-405 | +5% $-320 | +10% $-236 |
| Rate | -1.0pp $-229 | -0.5pp $-316 | base $-405 | +0.5pp $-495 | +1.0pp $-587 |
UW: 25.0% down · 7.5% · 30yr · 1.5% tax · 5.0% vac · 8.0% maint · 8.0% mgmt
Financing live
Cash to close
- Down payment
- $87,250
- Closing costs
- $10,470
- Reserves months
- —
- Total cash needed
- —
Loan-product check · same deal, 3 products live
Conventional
25% down · 7.5% · 30yr
- Down + closing
- —
- Monthly P&I
- —
- Monthly cashflow
- —
- DSCR
- —
- Eligible?
- —
Personal DTI + credit; lowest rate.
DSCR
20% down · 8.5% · 30yr
- Down + closing
- —
- Monthly P&I
- —
- Monthly cashflow
- —
- DSCR
- —
- Eligible?
- —
No personal income docs; deal must DSCR.
Hard money
10% down · 12.0% · 12mo
- Down + closing
- —
- Monthly P&I
- —
- Monthly cashflow
- —
- DSCR
- —
- Eligible?
- —
Short-term bridge; refi at stabilization.
Rent comps 29 comps
| Address | Beds | Baths | Sqft | Rent | $/sqft | DOM | Units | Dist |
|---|---|---|---|---|---|---|---|---|
| 3313 36th St SW Lehigh Acres, FL | 3.0 | 2.0 | 1723 | $2,300 | $1.33 | 25d | 1 | 0.51mi |
| 3802 35th St SW Lehigh Acres, FL | 3.0 | 2.0 | 1269 | $1,640 | $1.29 | 25d | 1 | 0.62mi |
| 3201 42nd St SW Lehigh Acres, FL | 3.0 | 2.0 | 1571 | $2,195 | $1.40 | 5d | 1 | 0.64mi |
| 3201 42nd St SW Lehigh Acres, FL | 3.0 | 2.0 | 1571 | $2,195 | $1.40 | 4d | 1 | 0.64mi |
| 3114 39th St SW Lehigh Acres, FL | 3.0 | 2.0 | 1493 | $2,100 | $1.41 | 17d | 1 | 0.71mi |
| 3114 39th St SW Lehigh Acres, FL | 3.0 | 2.0 | 1493 | $2,100 | $1.41 | 5d | 1 | 0.71mi |
| 3102 39th St SW Lehigh Acres, FL | 3.0 | 2.0 | 1097 | $1,630 | $1.49 | 23d | 1 | 0.80mi |
| 2904 Wanda Ave S Lehigh Acres, FL | 3.0 | 2.0 | 1501 | $1,900 | $1.27 | 25d | 1 | 0.84mi |
| 3604 29th St SW Lehigh Acres, FL | 3.0 | 2.5 | 1776 | $2,500 | $1.41 | 25d | 1 | 0.86mi |
| 4702 Loraine Ave S Lehigh Acres, FL | 3.0 | 2.0 | 1354 | $2,000 | $1.48 | 16d | 1 | 0.91mi |
| 3012 40th St SW Lehigh Acres, FL | 3.0 | 2.0 | 1427 | $1,950 | $1.37 | 25d | 1 | 0.91mi |
| 4020 36th St SW Lehigh Acres, FL | 3.0 | 2.0 | 1354 | $2,050 | $1.51 | 25d | 1 | 0.95mi |
| 3201 29th St SW Lehigh Acres, FL | 4.0 | 2.0 | 1833 | $1,950 | $1.06 | 5d | 1 | 1.01mi |
| 2916 42nd St SW Lehigh Acres, FL | 3.0 | 2.0 | 1399 | $1,930 | $1.38 | 3d | 1 | 1.02mi |
| 2916 42nd St SW Lehigh Acres, FL | 3.0 | 2.0 | 1399 | $1,960 | $1.40 | 5d | 1 | 1.02mi |
| 2504 Vera Ave S Lehigh Acres, FL | 3.0 | 3.0 | 1643 | $2,400 | $1.46 | 25d | 1 | 1.04mi |
| 4101 33rd St SW Lehigh Acres, FL | 3.0 | 2.0 | 1698 | $2,200 | $1.30 | 16d | 1 | 1.05mi |
| 3201 28th St Lehigh Acres, FL | 4.0 | 2.0 | 1389 | $2,000 | $1.44 | 5d | 1 | 1.06mi |
| 2911 48th St SW Lehigh Acres, FL | 3.0 | 2.0 | 1723 | $2,200 | $1.28 | 12d | 1 | 1.13mi |
| 3001 37th St SW Lehigh Acres, FL | 3.0 | 2.5 | 1235 | $1,705 | $1.38 | 25d | 1 | 1.13mi |
| 4021 28th St SW Lehigh Acres, FL | 3.0 | 2.0 | 1529 | $1,800 | $1.18 | 25d | 1 | 1.18mi |
| 2908 51st St SW Lehigh Acres, FL | 3.0 | 2.0 | 1401 | $1,796 | $1.28 | 5d | 1 | 1.20mi |
| 3203 24th St SW Lehigh Acres, FL | 3.0 | 2.0 | 1498 | $2,300 | $1.54 | 23d | 1 | 1.26mi |
| 2819 51st St SW Lehigh Acres, FL | 4.0 | 2.0 | 1472 | $2,250 | $1.53 | 25d | 1 | 1.30mi |
| 3201 23rd St SW Lehigh Acres, FL | 3.0 | 2.0 | 1324 | $1,845 | $1.39 | 23d | 1 | 1.32mi |
| 4001 22nd St SW Lehigh Acres, FL | 3.0 | 2.0 | 1055 | $1,950 | $1.85 | 4d | 1 | 1.42mi |
| 3008 25th St SW Lehigh Acres, FL | 4.0 | 2.0 | 1565 | $1,711 | $1.09 | 23d | 1 | 1.45mi |
| 3209 21st St SW Lehigh Acres, FL | 3.0 | 2.0 | 1418 | $1,699 | $1.20 | 4d | 1 | 1.45mi |
| 3600 19th St SW Lehigh Acres, FL | 3.0 | 2.0 | 1114 | $1,746 | $1.57 | 5d | 1 | 1.47mi |
Listing history 14 events
-
2026-06-22days on market $349,000 Active 67 DOM
-
2026-06-17days on market $349,000 Active 63 DOM
-
2026-06-16days on market $349,000 Active 62 DOM
-
2026-06-15days on market $349,000 Active 61 DOM
-
2026-06-13days on market $349,000 Active 59 DOM
-
2026-06-10days on market $349,000 Active 56 DOM
-
2026-06-09days on market $349,000 Active 55 DOM
-
2026-06-07days on market $349,000 Active 53 DOM
-
2026-06-03days on market $349,000 Active 49 DOM
-
2026-06-02days on market $349,000 Active 48 DOM
-
2026-06-01days on market $349,000 Active 47 DOM
-
2026-05-31days on market $349,000 Active 46 DOM
-
2026-04-15$349,000 Active
-
2005-09-27soldstatus $245,000
ⓘ Source: listings_history table (triggers on properties + properties_extension) + one-shot
backfill from property_details.listing_events for pre-trigger history.
Tax reassessment forecast FL · Resets to sale price
- Current annual tax
- $1,392 · $116/mo
- Projected year-2 tax
- $2,897 · $241/mo
- Expected delta
- +$1,505/yr (+$125/mo · 108.2%)
ⓘ Screening estimate from a state-policy table — verify with the county assessor before closing.
Nearby sold comps map
Loading sold comps map…
Walkable amenities ~0.75 mi
Loading nearby amenities…
Taxation est. · year 1
- Rental income
- $25,623
- − Mortgage interest
- −$19,549
- − Property taxes
- −$1,392
- − Insurance
- −$1,745
- − Repairs & maintenance
- −$2,050
- − Management
- −$2,050
- − Depreciation
- −$10,153
- Taxable loss
- −$11,315
- Est. tax savings @ 24.0%
- +$2,716
- After-tax cash flow
- $-2,141/yr
For passive investors: Depreciation is non-cash, so a rental often shows a tax loss while cash-flowing — sheltering income. Rental losses are passive: they offset passive income freely, and up to $25,000/yr can offset ordinary (W-2) income if you actively participate and your MAGI is under $100k (phasing out to $0 by $150k); unused losses carry forward. On sale, claimed depreciation is recaptured at up to 25%, and gains may owe capital-gains tax (a 1031 exchange can defer both). Figures are a year-1 estimate at your 24.0% rate — not tax advice; consult a CPA.
Schools (NCES district)
- District
- Lee
- NCES district ID
- 1201080
- Math proficiency
- 47% ▼ -11.00%
- Reading proficiency
- 50% ▼ -4.00%
- Median HH income
- $49,518
- Composite
- 41.49/100
- National rank
- #3458
- State rank
- #42 of 73 in FL
Livability — Lehigh Acres
- Score
- 59/100
- State rank
- #826
- US rank
- #20055
Category grades
Schools grade is shown separately in the Schools card above.
Census & demographics
- Census place
- Lehigh Acres, FL
- County
- Lee County · 788,662 people
- City population
- 130,638
- Metro
- Cape Coral-Fort Myers, FL
- Population (ZIP)
- 20,277
- Household income
- $72,679
- Rent vs Own
- Severe rent burden
- 574.0
Population outlook (Lee County) Hauer SSP2
- Today (2025)
- 871,946 people
- By 2030
- 955,468 · +9.6%
- By 2040
- 1,113,587 · +27.7%
- By 2050
- 1,256,891 · +44.1%
- By 2075
- 1,560,270 · +78.9%
- By 2100
- 1,726,848 · +98.0%
Race, ethnicity, and origin ACS 2023
- Neighborhood character
- Diverse neighborhood (Simpson 0.65)
- Race & ethnicity
- Hispanic / Latino 50% Two or more races 30% White 24% Black 20% Asian 3%
- Hispanic origin (detail)
- Mexican 8% Puerto Rican 8% Cuban 18% Dominican 4%
- Common ancestry
- Hispanic 8% Slovak 1% Lithuanian 1%
- Foreign-born
- 35% · Canada, Jamaica, Vietnam
- Languages at home
- 46% English-only · Spanish 43% French/Haitian/Cajun 8% Vietnamese 1%
Political lean MEDSL · Lee
- 2024 margin
- Strong R (+28.4) · D 35.5% · R 63.9%
- 2008→2024 swing
- -18.0pp toward R · 2008: -10.4pp · 2024: -28.4pp
- All cycles
- 2024: R+28.4 2020: R+19.2 2016: R+20.4 2012: R+16.6 2008: R+10.4
Not yet ingested
- Civics
- —
Market trends
- HPI YoY
- ▲ 21.77%
- Current HPI
- 340.4255
- Rent YoY
- ▼ -1.54%
- Metro
- Cape Coral-Fort Myers, FL
- State GDP YoY
- ▲ 3.28%
- F500 in state
- 36
Industry mix (Fortune 500 HQ in FL)
| Industry | F500 HQs | Revenue |
|---|---|---|
| Industrial Technology | 2 | $29B |
|
||
| Insurance | 2 | $17B |
|
||
| Retail | 1 | $60B |
|
||
| Technology Distribution | 1 | $58B |
|
||
| Homebuilding | 1 | $35B |
|
||
| Technology Manufacturing | 1 | $35B |
|
||
Price history
+42.4% since first listed2 events — show timeline
- 2026-04-15 Listed $349,000 BEARMLS
- 2005-09-27 Sold (Public Records) $245,000 Public Records
Property tax history
+4.5%/yrLatest (2025): $1,392 · +6.1% YoY. Source: county tax records.
Cash-flow waterfall
monthlySold comps — $/sqft
last 12 mo · ≤1 miLoading sold comps…