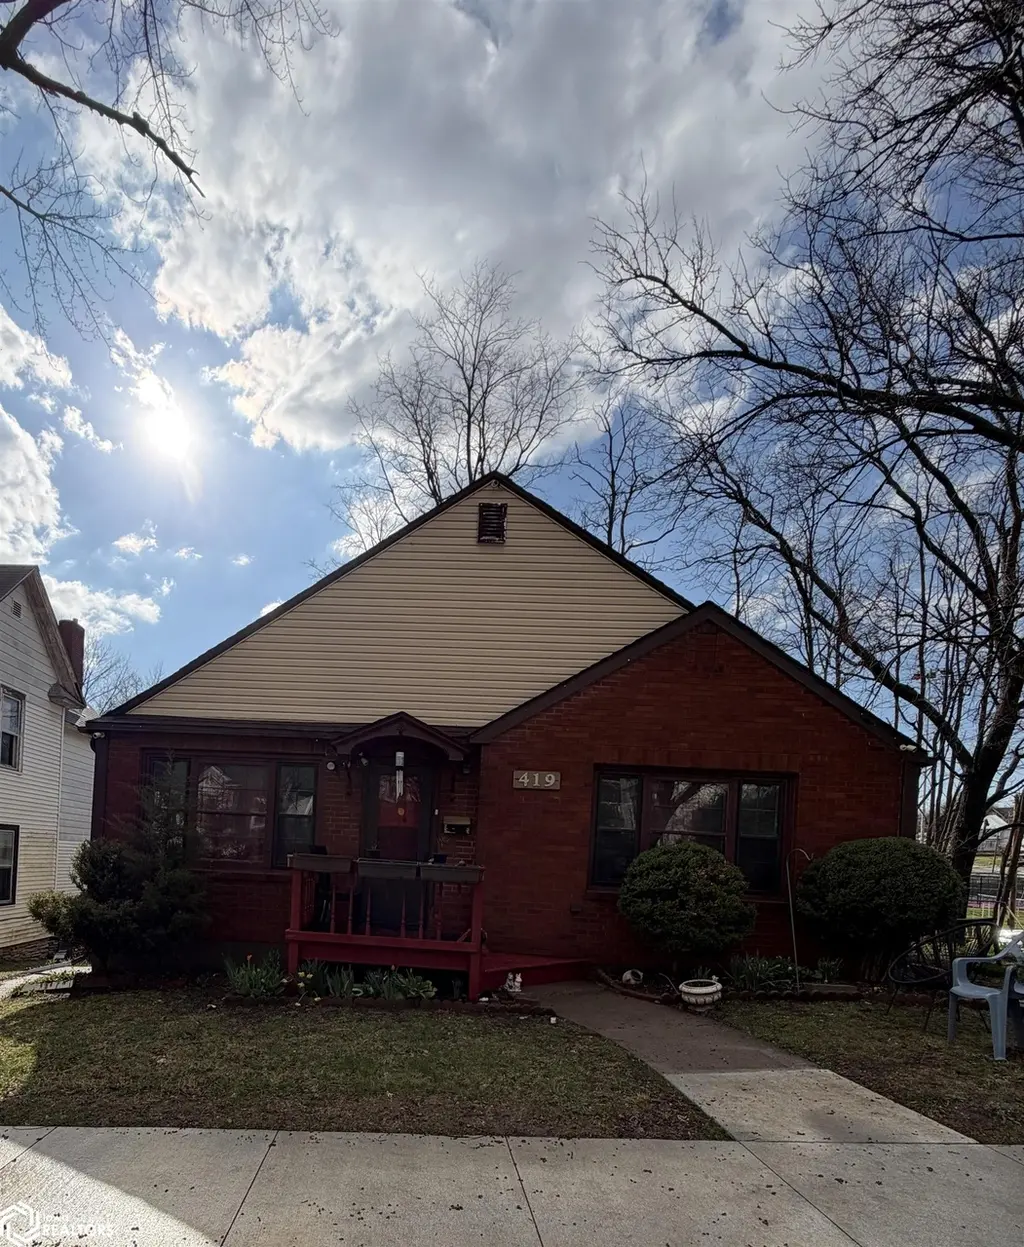
419 N Birch St · Ottumwa, IA
Flood risk 6/10 · Moderate
- FEMA flood zone
- X (unshaded)
- Chance of flooding over 30 yrs
- 0.74%
- Est. flood insurance / yr
- $473 – $860
Fire risk 3/10 · Minor
- Est. fire insurance / yr
- $902 – $1,676
Heat risk 3/10 · Minor
- Hot days now (above 106°F)
- 7 days/yr
- Hot days in 30 yrs
- 15 days/yr
Wind risk 2/10 · Minimal
- Chance of severe wind over 30 yrs
- —
Air-quality risk 2/10 · Minimal
- Unhealthy air days now
- 1 days/yr
- Unhealthy air days in 30 yrs
- 1 days/yr
Risk factors via First Street. Map © Google.
Why this score? — see what drove the F grade
The composite is a weighted blend of 9 inputs, each scored 0–100. Each bar is that input's sub-score; the figure is the points it added to the 100-point composite (weight × sub-score).
- Cash flow +11.8/30.0
- Schools +4.3/10.0
- Livability +4.0/5.0
- DSCR +3.5/10.0
- 1% rule +3.1/10.0
- Rent growth +2.5/5.0
- Condition / age +2.5/5.0
- ARV discount +0.0/15.0
- Appreciation +0.0/10.0
$155,000
🖨 Deal sheet (PDF) 📄 Offer letter ✓ Due diligence
Listing remarks MLS
Spacious and inviting 5-bedroom home offering room for everyone! This property features many updates with a bright, expansive living room and a formal dining area, perfect for everyday living and entertaining. You’ll appreciate the abundance of natural light throughout, along with durable ceramic tile flooring and a beautifully finished ceramic tile shower. The walk-out basement adds additional versatility and extra living space, while the detached 2-car garage provides ample storage and convenience. Exterior highlights include a classic combination of brick and vinyl siding for both charm and low maintenance. Ideally located within walking distance to the high school and numerous amenities, this home offers both comfort and convenience. A fantastic opportunity for a growing or large family looking for space, functionality, and a great location!
Key facts
- Formal dining area
- Walk-out basement
- Ceramic tile shower
Tags
Neighborhood map
What this means for you Summary
Snapshot
- This is a 2-bed/2.0-bath single-family listed at $155k.
Deal economics
- At list price, monthly cash flow is $-43 ($-519/yr) — negative.
- To cash-flow at today's rent, offer at most $147k (4.9% below list).
- To meet the 1% rule (rent ≥ 1% of price), the offer needs to be $125k (19.2% below list).
- Recommended offer: $125k (19.2% below list) — sets the bar for 1% rule.
Location & tenants
- Location reads 80/100 on livability (#91 in IA, #1,900 nationally) — a professional / high-income tenant draw. Strengths: cost of living A+, housing A+, health & safety A+; Watch: crime D-, employment D-.
- Ottumwa Community School District (town): math 50% / reading 54% proficiency, ranked #277 of 289 in IA (top 96%) — acceptable for families but not a draw, mixed tenant base, ~2y average lease.
- Zoned schools: Evans Middle School (math 45% / reading 53%, grade C-, #219 of 246 statewide, top 90%, 1,047 students, 46% FRL) — zoned schools at 46% FRL track the district average.
- Market conditions: 191 active listings in the ZIP; 44 units permitted in Wapello County in 2024 (0 in 5+ unit buildings).
Forward outlook
- Local home prices are declining (-3.0%/yr); year-one equity from $1k of loan paydown is wiped out by about $5k of value loss. Plan a longer hold.
- Wapello County population projected at +5% by 2050 — modest demand growth; plan on rents tracking national, not racing it.
Negotiation context
- It's been on market 80 days — a 6% lower offer ($146k) is reasonable based on typical stale-listing flexibility.
- Current owner paid $72k; list at $155k implies a 115% gain — meaningful room to come down on a strong offer.
Risks & watch-outs
- Watch-outs: built in 1920 — expect roof / HVAC / electrical / plumbing capex.
- Climate carrying-cost: major flood risk — expect insurance premiums to compound above CPI over the hold.
Questions for the listing agent
- What do current leases actually rent for vs. the listed asking? Can we see a recent rent roll and the last 12 months of T-12 income?
- It's been on market 80 days. Have you received any prior offers? Is the seller open to a 19% concession, seller financing, or rate buy-down credit?
- Built in 1920 — when were the roof, HVAC, electrical panel, plumbing, and water heater last replaced?
- Why hasn't it sold? Are there any deal-killer items the seller is aware of (foundation, flood, title, zoning, code violations)?
- Is there a deadline driving the sale (1031 exchange, divorce, estate, relocation)? That informs how much negotiation room exists.
- Crime grade is D in this area — have there been break-ins, vandalism, or insurance claims at this property in the last 3 years? What carrier currently insures it and at what premium?
- The area grade is low — what's the realistic commute time and amenity access for the typical tenant pool here? Any planned neighborhood developments (good or bad) we should know about?
- What's the average days-on-market for RENTAL listings here right now (not sales)? A rising rental-DOM trend means longer vacancies and softer asking-rent achievability than the comps imply.
- What's the recent tenant-quality profile in this submarket — average credit score on applications, eviction rate, late-payment / NSF rate, and stable-employment percentage? A property-management company in the area should have these aggregated.
- How much new for-sale + rental construction is in the pipeline within 1–3 miles? Heavy new supply typically softens prices + rents 12–24 months out; constrained supply supports both.
Investment metrics
- 1% rule
- 0.81% ✗
- Cap rate
- 5.96%
- Cash-on-cash
- -1.20%
- DSCR
- 0.95
- GRM
- 10.3
CMA / ARV
- ARV (median comp)
- $105,665
- List price
- $155,000
- Delta
- 46.69%
- Verdict
- OVERPRICED
- Comps
- 18 within 1.0 mi
Show comp detail 12 sales within ~0.75 mi
| Address | Dist | Beds/Ba | Sqft | Sold | Price | $/sf | Match |
|---|---|---|---|---|---|---|---|
| 445 E 4th St | 0.12mi | 2/1.0 | 1,276 (-1%) | 19mo | $72,500 | $57 | 73 |
| 144 Lincoln Ave | 0.54mi | 2/1.5 | 1,223 (-5%) | 8mo | $70,000 | $57 | 58 |
| 205 N Cooper Ave | 0.26mi | 3/2.0 (+1) | 1,196 (-7%) | 20mo | $150,000 | $125 | 54 |
| 1625 Locust St | 0.56mi | 2/1.0 | 1,326 (+3%) | 21mo | $55,000 | $41 | 47 |
| 1016 Grant St | 0.35mi | 3/1.0 (+1) | 1,122 (-13%) | 8mo | $75,000 | $67 | 46 |
| 1 Terrace Ct | 0.62mi | 3/1.5 (+1) | 1,375 (+7%) | 8mo | $150,000 | $109 | 45 |
| 1209 N Jay St | 0.58mi | 3/3.0 (+1) | 1,294 (+1%) | 22mo | $230,000 | $178 | 44 |
| 1109 E Court St | 0.59mi | 3/2.5 (+1) | 1,224 (-5%) | 16mo | $187,000 | $153 | 44 |
| 1113 Orchard St | 0.68mi | 2/1.0 | 1,432 (+11%) | 7mo | $10,000 | $7 | 39 |
| 325 E Maple Ave | 0.69mi | 3/1.0 (+1) | 1,471 (+14%) | 2mo | $153,000 | $104 | 34 |
| 749 N Green St | 0.65mi | 3/1.0 (+1) | 1,474 (+15%) | 6mo | $22,500 | $15 | 31 |
| 120 S Walnut Ave | 0.73mi | 3/1.0 (+1) | 1,109 (-14%) | 16mo | $80,000 | $72 | 21 |
Match score weights: distance 35% · size 25% · config 20% · recency 20%. Top-matched comps best support the ARV.
Projected returns pro-forma
-3.0% appreciation · 3.0% rent growth · sell at horizon
- IRR
- -18.3%
- Equity multiple
- 0.36×
- Total profit
- $-27,876
- Equity at exit
- $23,111
- IRR
- -10.6%
- Equity multiple
- 0.36×
- Total profit
- $-27,840
- Equity at exit
- $13,402
Cash invested: $43,400 (down + closing). Projections, not guarantees.
Landlord ↔ Tenant lean methodology
- Overall (STATE)
- 83 Strongly Landlord-Friendly
- State Iowa
- 83 Strongly Landlord-Friendly · R+6
- County
- — inherits STATE
- City
- — inherits STATE
ZIP-level market 52501
- Active inventory
- 191
- Price-to-rent
- 10.3×
Monthly cashflow live
- Estimated rent
- $1,253 medium interval (Pro) →
- Mortgage (P&I)
- −$813
- Tax from tax record
- −$155 /mo · $1,864/yr
- Insurance
- −$65
- HOA
- −$0
- Lot rent
- −$0
- Vacancy / Maint / Mgmt
- −$263
- Net cashflow
- $-43
Break-even live
Sensitivity live
| Price | -10% $44 | -5% $1 | +0% $-43 | +5% $-87 | +10% $-131 |
|---|---|---|---|---|---|
| Rent | -10% $-142 | -5% $-93 | +0% $-43 | +5% $6 | +10% $56 |
| Rate | -1.0pp $35 | -0.5pp $-4 | base $-43 | +0.5pp $-83 | +1.0pp $-124 |
UW: 25.0% down · 7.5% · 30yr · 1.5% tax · 5.0% vac · 8.0% maint · 8.0% mgmt
Financing live
Cash to close
- Down payment
- $38,750
- Closing costs
- $4,650
- Reserves months
- —
- Total cash needed
- —
Loan-product check · same deal, 3 products live
Conventional
25% down · 7.5% · 30yr
- Down + closing
- —
- Monthly P&I
- —
- Monthly cashflow
- —
- DSCR
- —
- Eligible?
- —
Personal DTI + credit; lowest rate.
DSCR
20% down · 8.5% · 30yr
- Down + closing
- —
- Monthly P&I
- —
- Monthly cashflow
- —
- DSCR
- —
- Eligible?
- —
No personal income docs; deal must DSCR.
Hard money
10% down · 12.0% · 12mo
- Down + closing
- —
- Monthly P&I
- —
- Monthly cashflow
- —
- DSCR
- —
- Eligible?
- —
Short-term bridge; refi at stabilization.
Listing history 22 events
-
2026-06-22days on market $155,000 Active 80 DOM
-
2026-06-21days on market $155,000 Active 79 DOM
-
2026-06-21days on market $155,000 Active 78 DOM
-
2026-06-18days on market $155,000 Active 76 DOM
-
2026-06-17days on market $155,000 Active 75 DOM
-
2026-06-16days on market $155,000 Active 74 DOM
-
2026-06-15days on market $155,000 Active 73 DOM
-
2026-06-13days on market $155,000 Active 71 DOM
-
2026-06-12pricedays on market $155,000 Active 70 DOM
-
2026-06-09days on market $160,000 Active 67 DOM
-
2026-06-08days on market $160,000 Active 66 DOM
-
2026-06-07days on market $160,000 Active 65 DOM
-
2026-06-07days on market $160,000 Active 64 DOM
-
2026-06-04days on market $160,000 Active 61 DOM
-
2026-06-02days on market $160,000 Active 60 DOM
-
2026-06-01days on market $160,000 Active 59 DOM
-
2026-05-31days on market $160,000 Active 58 DOM
-
2026-05-31days on market $160,000 Active 57 DOM
-
2026-05-07price $165,000 863-char remark
Show marketing remark (863 chars)
Spacious and inviting 5-bedroom home offering room for everyone! This property features many updates with a bright, expansive living room and a formal dining area, perfect for everyday living and entertaining. You’ll appreciate the abundance of natural light throughout, along with durable ceramic tile flooring and a beautifully finished ceramic tile shower. The walk-out basement adds additional versatility and extra living space, while the detached 2-car garage provides ample storage and convenience. Exterior highlights include a classic combination of brick and vinyl siding for both charm and low maintenance. Ideally located within walking distance to the high school and numerous amenities, this home offers both comfort and convenience. A fantastic opportunity for a growing or large family looking for space, functionality, and a great location!
-
2026-04-02$170,000 Active 863-char remark
Show marketing remark (863 chars)
Spacious and inviting 5-bedroom home offering room for everyone! This property features many updates with a bright, expansive living room and a formal dining area, perfect for everyday living and entertaining. You’ll appreciate the abundance of natural light throughout, along with durable ceramic tile flooring and a beautifully finished ceramic tile shower. The walk-out basement adds additional versatility and extra living space, while the detached 2-car garage provides ample storage and convenience. Exterior highlights include a classic combination of brick and vinyl siding for both charm and low maintenance. Ideally located within walking distance to the high school and numerous amenities, this home offers both comfort and convenience. A fantastic opportunity for a growing or large family looking for space, functionality, and a great location!
-
2007-02-26soldstatus $72,000
-
2006-01-27soldstatus $10,000
ⓘ Source: listings_history table (triggers on properties + properties_extension) + one-shot
backfill from property_details.listing_events for pre-trigger history.
Tax reassessment forecast IA · Partial reset (capped growth)
- Current annual tax
- $1,864 · $155/mo
- Projected year-2 tax
- $2,149 · $179/mo
- Expected delta
- +$285/yr (+$24/mo · 15.3%)
ⓘ Screening estimate from a state-policy table — verify with the county assessor before closing.
Climate risk First Street
- Flood 6/10 Major FEMA zone X (unshaded) · 74% chance over 30 yrs
- Wildfire 3/10 Moderate
- Heat 3/10 Moderate 7 d/yr ≥106°F today · 15 d/yr by 30 yrs out
- Wind 2/10 Low
- Air quality 2/10 Low 1 unhealthy d/yr today · 1 by 30 yrs out
Nearby sold comps map
Loading sold comps map…
Walkable amenities ~0.75 mi
Loading nearby amenities…
Taxation est. · year 1
- Rental income
- $15,030
- − Mortgage interest
- −$8,682
- − Property taxes
- −$1,864
- − Insurance
- −$775
- − Repairs & maintenance
- −$1,202
- − Management
- −$1,202
- − Depreciation
- −$4,509
- Taxable loss
- −$3,205
- Est. tax savings @ 24.0%
- +$769
- After-tax cash flow
- $250/yr
For passive investors: Depreciation is non-cash, so a rental often shows a tax loss while cash-flowing — sheltering income. Rental losses are passive: they offset passive income freely, and up to $25,000/yr can offset ordinary (W-2) income if you actively participate and your MAGI is under $100k (phasing out to $0 by $150k); unused losses carry forward. On sale, claimed depreciation is recaptured at up to 25%, and gains may owe capital-gains tax (a 1031 exchange can defer both). Figures are a year-1 estimate at your 24.0% rate — not tax advice; consult a CPA.
Schools (NCES district)
- District
- Ottumwa Community School District
- NCES district ID
- 1922110
- Math proficiency
- 50% ▼ -9.00%
- Reading proficiency
- 54% ▲ 1.00%
- Median HH income
- $39,864
- Composite
- 43.46/100
- National rank
- #3004
- State rank
- #277 of 289 in IA
Livability — Ottumwa
- Score
- 80/100
- State rank
- #91
- US rank
- #1900
Category grades
Schools grade is shown separately in the Schools card above.
Census & demographics
- Census place
- Ottumwa, IA
- Population (ZIP)
- 30,341
Population outlook (Wapello County) Hauer SSP2
- Today (2025)
- 35,472 people
- By 2030
- 35,563 · +0.3%
- By 2040
- 36,083 · +1.7%
- By 2050
- 37,287 · +5.1%
- By 2075
- 43,898 · +23.8%
- By 2100
- 52,973 · +49.3%
Race, ethnicity, and origin ACS 2023
- Neighborhood character
- Predominantly White (74%)
- Race & ethnicity
- White 74% Hispanic / Latino 14% Two or more races 7% Black 4% Pacific Islander 2% Asian 2%
- Hispanic origin (detail)
- Mexican 9%
- Common ancestry
- Iranian 4% Italian 1% Slovak 1%
- Foreign-born
- 11% · Canada
- Languages at home
- 84% English-only · Spanish 10% Other Asian/Pacific 3% Tagalog/Filipino 1%
Political lean MEDSL · Wapello
- 2024 margin
- Solid R (+31.4) · D 33.6% · R 65.0% · Other 1.4%
- 2008→2024 swing
- -45.0pp toward R · 2008: 13.5pp · 2024: -31.4pp
- All cycles
- 2024: R+31.4 2020: R+23.6 2016: R+20.8 2012: D+11.8 2008: D+13.5
Not yet ingested
- Civics
- —
Market trends
- HPI YoY
- ▼ -94.66%
- Current HPI
- 174.6021
- Rent YoY
- —
- Metro
- —
- State GDP YoY
- ▲ 2.48%
- F500 in state
- 4
Industry mix (Fortune 500 HQ in IA)
| Industry | F500 HQs | Revenue |
|---|---|---|
| Financial Services | 1 | $16B |
|
||
| Retail / Convenience | 1 | $15B |
|
||
Price history
+1550.0% since first listed4 events — show timeline
- 2026-05-07 Price Changed $165,000 IAR
- 2026-04-02 Listed $170,000 IAR
- 2007-02-26 Sold (Public Records) $72,000 Public Records
- 2006-01-27 Sold (Public Records) $10,000 Public Records
Property tax history
+1.4%/yrLatest (2025): $1,864 · +5.7% YoY. Source: county tax records.
Cash-flow waterfall
monthlySold comps — $/sqft
last 12 mo · ≤1 miLoading sold comps…