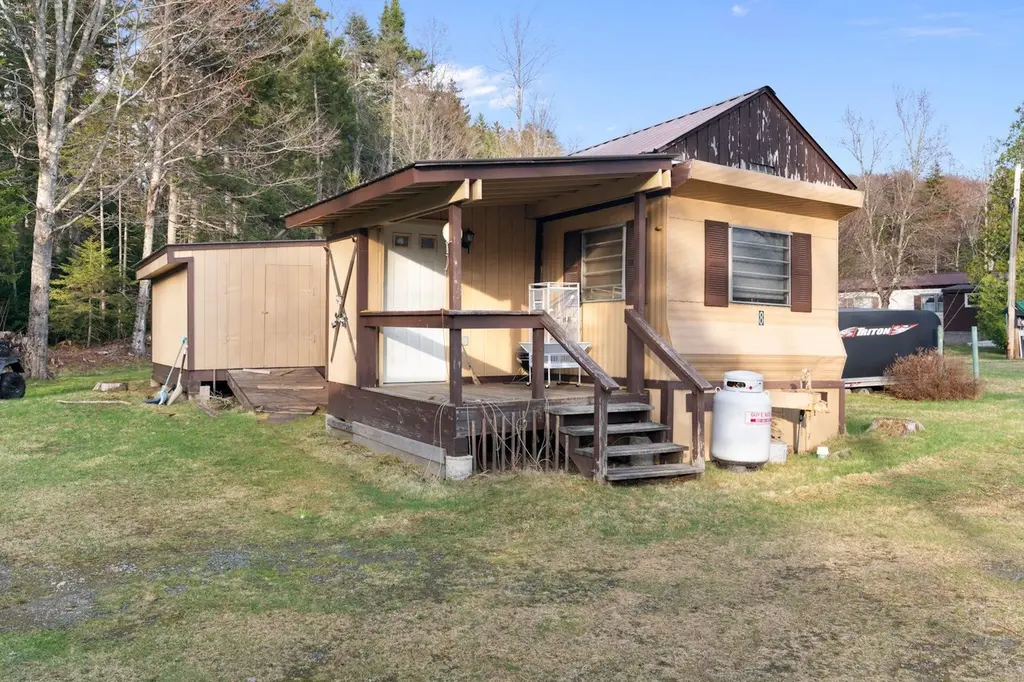
8 Dorf Auf Radar Rd · Wilmington, VT
Flood risk 7/10 · Major
- FEMA flood zone
- X (unshaded)
- Chance of flooding over 30 yrs
- 0.99%
- Est. flood insurance / yr
- $473 – $860
Fire risk 3/10 · Minor
- Est. fire insurance / yr
- $480 – $892
Heat risk 1/10 · Minimal
- Hot days now (above 85°F)
- 7 days/yr
- Hot days in 30 yrs
- 16 days/yr
Wind risk 4/10 · Minor
- Chance of severe wind over 30 yrs
- 8.0%
Air-quality risk 2/10 · Minimal
- Unhealthy air days now
- 0 days/yr
- Unhealthy air days in 30 yrs
- 1 days/yr
Risk factors via First Street. Map © Google.
Why this score? — see what drove the B+ grade
The composite is a weighted blend of 9 inputs, each scored 0–100. Each bar is that input's sub-score; the figure is the points it added to the 100-point composite (weight × sub-score).
- Cash flow +30.0/30.0
- 1% rule +10.0/10.0
- DSCR +10.0/10.0
- ARV discount +7.5/15.0
- Appreciation +6.3/10.0
- Schools +5.0/10.0
- Condition / age +3.8/5.0
- Livability +3.2/5.0
- Rent growth +2.5/5.0
$39,900
🖨 Deal sheet 📄 Offer letter ✓ Due diligence
Listing remarks MLS
Delightful, affordable! Be right in the heart of ski country with access to hiking, boating, fishing and biking! This tidy 2 bedroom home has a 10x16 storage shed for your gear! Big enough for a weekend of fun but small enough to keep the costs reasonable. This is better than renting, and always available when you are! This is an exciting find! The property can only be a vacation/second home only.
Key facts
- Built 1970
- Listed 59 days
Neighborhood map
What this means for you Summary
Snapshot
- This is a 2-bed/1.0-bath manufactured listed at $40k. Condition is rated good.
Deal economics
- At list price, monthly cash flow is $827 ($10k/yr) — positive.
- The deal already cash-flows at list — no discount required.
- Meets the 1% rule at list price ($2k rent vs $40k).
- Recommended offer: $39k (3.0% below list) — sets the bar for market timing.
- Cap rate 32.8% vs local median 2.5% in Wilmington — top-decile yield for the area; either an underpriced asset or a hidden risk that comps aren't pricing in. Stress-test before assuming the spread holds.
Location & tenants
- Location reads 65/100 on livability (#57 in VT) — a middle-class / working-renter tenant base. Strengths: crime A+, housing A+, employment B; Watch: schools D, health & safety D, amenities F.
- Market conditions: 65 active listings in the ZIP; 188 units permitted in Windham County in 2024 (0 in 5+ unit buildings).
Forward outlook
- In year one you build about $1k of equity ($276 loan paydown + $1k appreciation (2.6% local appreciation)).
- Windham County population projected at -26% by 2050 — secular population decline; favor cash flow + early exit over multi-decade hold.
- At projected returns (2.6% appreciation + 3.0% rent growth), your $11k cash investment doubles in ~1 year — after that, you're playing with house money.
Negotiation context
- It's been on market 59 days — a 3% lower offer ($39k) is reasonable based on typical stale-listing flexibility.
Risks & watch-outs
- Watch-outs: flood insurance adds $56/mo.
- Climate carrying-cost: major flood risk — expect insurance premiums to compound above CPI over the hold.
Questions for the listing agent
- It's been on market 59 days. Have you received any prior offers? Is the seller open to a 3% concession, seller financing, or rate buy-down credit?
- Built in 1970 — when were the roof, HVAC, electrical panel, plumbing, and water heater last replaced?
- What's the actual annual flood-insurance premium (NFIP or private), and is the property in a SFHA with mandatory coverage?
- What does the HOA fee cover, when was the last increase, and are there any pending special assessments or reserve-fund shortfalls?
- Is there a deadline driving the sale (1031 exchange, divorce, estate, relocation)? That informs how much negotiation room exists.
- Schools are D-rated, which usually means shorter tenancies and higher turnover. Who's the typical renter profile here, and what's been the actual vacancy rate?
- What's the average days-on-market for RENTAL listings here right now (not sales)? A rising rental-DOM trend means longer vacancies and softer asking-rent achievability than the comps imply.
- What's the recent tenant-quality profile in this submarket — average credit score on applications, eviction rate, late-payment / NSF rate, and stable-employment percentage? A property-management company in the area should have these aggregated.
- How much new for-sale + rental construction is in the pipeline within 1–3 miles? Heavy new supply typically softens prices + rents 12–24 months out; constrained supply supports both.
Investment metrics
- 1% rule
- 4.15% ✓
- Cap rate
- 32.83%
- Cash-on-cash
- 94.78%
- DSCR
- 5.22
- GRM
- 2.0
CMA / ARV
- ARV (median comp)
- $106,492
- List price
- $39,900
- Delta
- -62.53%
- Verdict
- UNDERPRICED
- Comps
- 1 within 2.0 mi
Projected returns pro-forma
2.65% appreciation · 3.0% rent growth · sell at horizon
- IRR
- 93.0%
- Equity multiple
- 6.09×
- Total profit
- $56,894
- Equity at exit
- $17,170
- IRR
- 92.8%
- Equity multiple
- 12.62×
- Total profit
- $129,863
- Equity at exit
- $25,876
Cash invested: $11,172 (down + closing). Projections, not guarantees.
Landlord ↔ Tenant lean methodology
- Overall (STATE)
- 41 Moderately Tenant-Leaning
- State Vermont
- 41 Moderately Tenant-Leaning · D+15
- County
- — inherits STATE
- City
- — inherits STATE
ZIP-level market 05363
- Home prices YoY
- 0.7%
- Active inventory
- 65
- Price-to-rent
- 2.0×
Monthly cashflow live
- Estimated rent
- $1,656 medium interval (Pro) →
- Mortgage (P&I)
- −$209
- Tax est. 1.5%
- −$50 /mo · $598/yr
- Insurance
- −$17
- Flood insurance flood zone
- −$56 /mo · $666/yr
- HOA
- −$150
- Vacancy / Maint / Mgmt
- −$348
- Net cashflow
- $827
Break-even live
UW: 25.0% down · 7.5% · 30yr · 1.5% tax · 5.0% vac · 8.0% maint · 8.0% mgmt
Financing live
Cash to close
- Down payment
- $9,975
- Closing costs
- $1,197
- Reserves months
- —
- Total cash needed
- —
Loan-product check · same deal, 3 products live
Conventional
25% down · 7.5% · 30yr
- Down + closing
- —
- Monthly P&I
- —
- Monthly cashflow
- —
- DSCR
- —
- Eligible?
- —
Personal DTI + credit; lowest rate.
DSCR
20% down · 8.5% · 30yr
- Down + closing
- —
- Monthly P&I
- —
- Monthly cashflow
- —
- DSCR
- —
- Eligible?
- —
No personal income docs; deal must DSCR.
Hard money
10% down · 12.0% · 12mo
- Down + closing
- —
- Monthly P&I
- —
- Monthly cashflow
- —
- DSCR
- —
- Eligible?
- —
Short-term bridge; refi at stabilization.
HOA detail
- Monthly dues
- $150 · $1,800/yr
Listing history 18 events
-
2026-06-18days on market $39,900 Active 59 DOM
-
2026-06-17days on market $39,900 Active 58 DOM
-
2026-06-16days on market $39,900 Active 57 DOM
-
2026-06-15days on market $39,900 Active 56 DOM
-
2026-06-14days on market $39,900 Active 54 DOM
-
2026-06-13days on market $39,900 Active 53 DOM
-
2026-06-10days on market $39,900 Active 51 DOM
-
2026-06-09days on market $39,900 Active 50 DOM
-
2026-06-09price $39,900 Active 49 DOM
-
2026-06-08days on market $50,000 Active 49 DOM
-
2026-06-07days on market $50,000 Active 48 DOM
-
2026-06-05days on market $50,000 Active 45 DOM
-
2026-06-03days on market $50,000 Active 44 DOM
-
2026-06-02days on market $50,000 Active 43 DOM
-
2026-06-01days on market $50,000 Active 42 DOM
-
2026-05-31days on market $50,000 Active 41 DOM
-
2026-05-31days on market $50,000 Active 40 DOM
-
2026-04-20$50,000 Active 404-char remark
Show marketing remark (404 chars)
Delightful, affordable! Be right in the heart of ski country with access to hiking, boating, fishing and biking! This tidy 2 bedroom home has a 10x16 storage shed for your gear! Big enough for a weekend of fun but small enough to keep the costs reasonable. This is better than renting, and always available when you are! This is an exciting find! The property can only be a vacation/second home only.
ⓘ Source: listings_history table (triggers on properties + properties_extension) + one-shot
backfill from property_details.listing_events for pre-trigger history.
Climate risk First Street
- Flood 7/10 Severe FEMA zone X (unshaded) · 99% chance over 30 yrs
- Wildfire 3/10 Moderate
- Heat 1/10 Low 7 d/yr ≥85°F today · 16 d/yr by 30 yrs out
- Wind 4/10 Moderate 8% chance of damaging wind over 30 yrs
- Air quality 2/10 Low 0 unhealthy d/yr today · 1 by 30 yrs out
Nearby sold comps map
Loading sold comps map…
Walkable amenities ~0.75 mi
Loading nearby amenities…
Taxation est. · year 1
- Rental income
- $19,870
- − Mortgage interest
- −$2,235
- − Property taxes
- −$598
- − Insurance
- −$866
- − Repairs & maintenance
- −$1,590
- − Management
- −$1,590
- − HOA
- −$1,800
- − Depreciation
- −$1,161
- Taxable income
- $10,031
- Est. tax owed @ 24.0%
- −$2,407
- After-tax cash flow
- $7,515/yr
For passive investors: Depreciation is non-cash, so a rental often shows a tax loss while cash-flowing — sheltering income. Rental losses are passive: they offset passive income freely, and up to $25,000/yr can offset ordinary (W-2) income if you actively participate and your MAGI is under $100k (phasing out to $0 by $150k); unused losses carry forward. On sale, claimed depreciation is recaptured at up to 25%, and gains may owe capital-gains tax (a 1031 exchange can defer both). Figures are a year-1 estimate at your 24.0% rate — not tax advice; consult a CPA.
Condition & rehab AI · 13 photos
This mobile home is in good condition with cosmetic updates needed to modernize the kitchen and bathroom. It's located in a desirable area with access to outdoor activities, making it an attractive investment for both buyers and renters.
Repairs flagged
- Minor kitchen cabinets — slight wear
- Minor kitchen appliances — dated and possibly worn
- Minor bathroom vanity — dated and possibly worn
Value-add opportunities
- Both update kitchen cabinets and appliances — modernizing the kitchen would appeal to both buyers and renters
- Both update bathroom vanity — modernizing the bathroom would appeal to both buyers and renters
- Both paint interior walls — painting the interior walls would improve the home's curb appeal and make it more inviting
Renovation cost estimate screening
| Repair item | Severity | Est. cost |
|---|---|---|
| kitchen cabinets · slight wear | Minor | $500–3,000 |
| kitchen appliances · dated and possibly worn | Minor | $500–3,000 |
| bathroom vanity · dated and possibly worn | Minor | $500–3,000 |
| Total estimated repair cost · 3 items | $1,500–9,000 |
Value-add ROI direction
- Both update kitchen cabinets and appliances — modernizing the kitchen would appeal to both buyers and renters ↑
- Both update bathroom vanity — modernizing the bathroom would appeal to both buyers and renters ↑
- Both paint interior walls — painting the interior walls would improve the home's curb appeal and make it more inviting ↑
ⓘ Cost ranges are severity-bucket heuristics (US national rule-of-thumb). Get contractor quotes + a written scope before underwriting a rehab budget.
Schools (NCES district)
No district data.
Livability — Wilmington
- Score
- 65/100
- State rank
- #57
- US rank
- #12863
Category grades
Schools grade is shown separately in the Schools card above.
Census & demographics
- Population (ZIP)
- 2,008
Population outlook (Windham County) Hauer SSP2
- Today (2025)
- 40,432 people
- By 2030
- 38,472 · -4.8%
- By 2040
- 33,954 · -16.0%
- By 2050
- 29,774 · -26.4%
- By 2075
- 22,351 · -44.7%
- By 2100
- 15,961 · -60.5%
Race, ethnicity, and origin ACS 2023
- Neighborhood character
- Predominantly White (89%)
- Race & ethnicity
- White 89% Hispanic / Latino 6% Two or more races 4% Asian 1%
- Hispanic origin (detail)
- Mexican 3% Puerto Rican 1%
- Common ancestry
- Lithuanian 4% Iranian 4% Slovak 4%
- Foreign-born
- 8% · Canada, Philippines
- Languages at home
- 90% English-only · Spanish 5% Other Indo-European 2% Other Asian/Pacific 1%
Political lean MEDSL · Windham
- 2024 margin
- Solid D (+42.7) · D 69.6% · R 26.9% · Other 3.5%
- 2008→2024 swing
- -5.4pp toward R · 2008: 48.1pp · 2024: 42.7pp
- All cycles
- 2024: D+42.7 2020: D+47.3 2016: D+42.0 2012: D+49.2 2008: D+48.1
Not yet ingested
- Civics
- —
Market trends
- HPI YoY
- ▲ 2.65%
- Current HPI
- 362.8468
- Rent YoY
- —
- Metro
- —
- State GDP YoY
- —
- F500 in state
- 0
Price history
1 event — show timeline
- 2026-04-20 Listed $50,000 PrimeMLS
Cash-flow waterfall
monthlySold comps — $/sqft
last 12 mo · ≤1 miLoading sold comps…