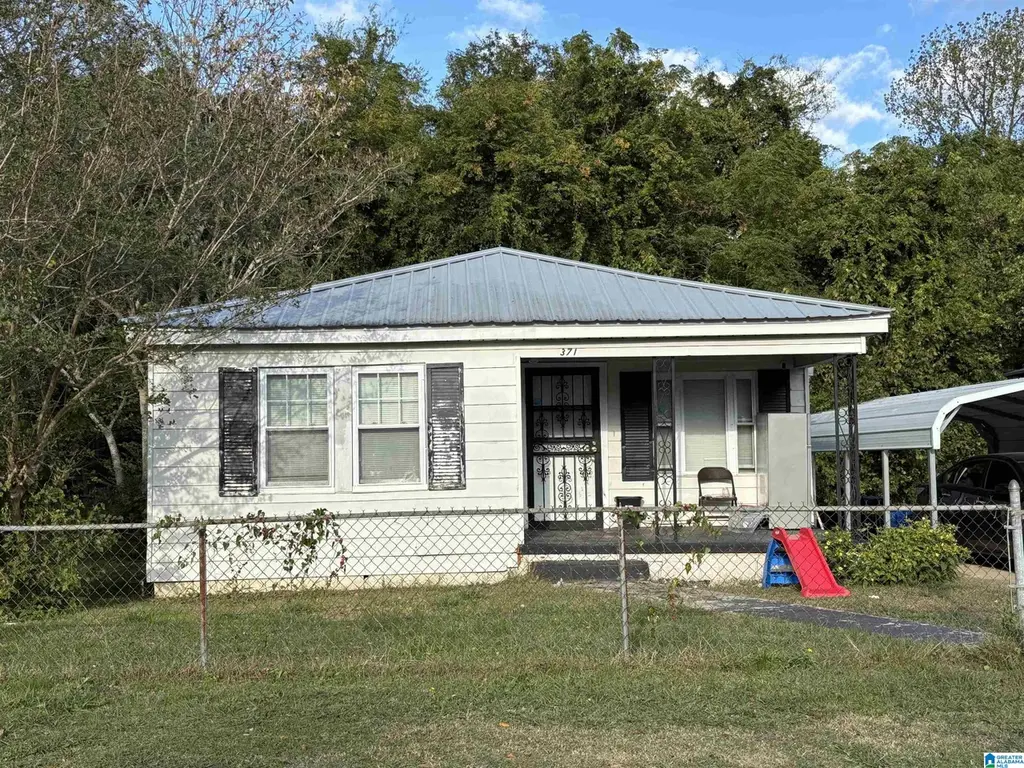
3716 Fir Ave SW · Birmingham, AL
Flood risk 6/10 · Moderate
- FEMA flood zone
- X (unshaded)
- Chance of flooding over 30 yrs
- 0.75%
- Est. flood insurance / yr
- $507 – $1,088
Fire risk 3/10 · Minor
- Est. fire insurance / yr
- $916 – $1,700
Heat risk 6/10 · Moderate
- Hot days now (above 108°F)
- 7 days/yr
- Hot days in 30 yrs
- 19 days/yr
Wind risk 6/10 · Moderate
- Chance of severe wind over 30 yrs
- 27.0%
Air-quality risk 4/10 · Minor
- Unhealthy air days now
- 5 days/yr
- Unhealthy air days in 30 yrs
- 5 days/yr
Risk factors via First Street. Map © Google.
Why this score? — see what drove the C grade
The composite is a weighted blend of 9 inputs, each scored 0–100. Each bar is that input's sub-score; the figure is the points it added to the 100-point composite (weight × sub-score).
- Cash flow +23.9/30.0
- DSCR +7.7/10.0
- ARV discount +7.5/15.0
- 1% rule +5.6/10.0
- Appreciation +4.3/10.0
- Livability +3.4/5.0
- Rent growth +2.5/5.0
- Condition / age +2.5/5.0
- Schools +0.9/10.0
$99,000
🖨 Deal sheet 📄 Offer letter ✓ Due diligence
Listing remarks MLS
Great investment opportunity! New HVAC system including duct work, vents, registers, and thermostat. Current tenant pays $980/mo. This property is 1 of 3 offered in a portfolio of other properties. Seller willing to sell individually or all 3 together. Other properties in portfolio are 2709 9th Street NE $125K, and 704 Falmouth Street, $81,900. Seller will not entertain subject 2 or owner financing options. Property is tenant occupied - Please DO NOT DISTURB TENANT. Only AFTER property is under contract are showings scheduled 48HRS in advance. Don't miss Rent Roll in document section.
Key facts
- Thermostat
- Duct work
- Vents
Tags
Neighborhood map
What this means for you Summary
Snapshot
- This is a 3-bed/1.0-bath single-family listed at $99k.
Deal economics
- At list price, monthly cash flow is $191 ($2k/yr) — positive.
- The deal already cash-flows at list — no discount required.
- Meets the 1% rule at list price ($1k rent vs $99k).
- Recommended offer: $87k (12.0% below list) — sets the bar for market timing.
- Cap rate 8.6% vs local median 6.2% in Birmingham — top-decile yield for the area; either an underpriced asset or a hidden risk that comps aren't pricing in. Stress-test before assuming the spread holds.
Location & tenants
- Location reads 67/100 on livability (#78 in AL) — a middle-class / working-renter tenant base. Strengths: commute A+, cost of living A+, housing A+; Watch: amenities C-, schools F, crime F.
- Birmingham City (urban): math 4% / reading 20% proficiency, ranked #116 of 129 in AL (top 90%) — low school quality limits family demand, transient renter base, plan for 1-2y turnover; 82% free/reduced lunch — lower-income household profile, screen leases tightly.
- Market conditions: 26 active listings in the ZIP; 40 comparable units currently listed for rent nearby; rentals lingering (median 44d on market — plan ~5-8 weeks vacancy on turnover, expect pricing pressure); 55% of comp listings sitting > 30 days — soft ceiling on asking rent; 2,114 units permitted in Jefferson County in 2024 (556 in 5+ unit buildings).
Forward outlook
- Local home prices are declining (-1.3%/yr); year-one equity from $684 of loan paydown is wiped out by about $1k of value loss. Plan a longer hold.
- Jefferson County population projected to shrink 4% by 2050 — rents likely to lag national; underwrite the cash flow, not the appreciation.
- At projected returns (-1.3% appreciation + 3.0% rent growth), your $28k cash investment doubles in ~9 years — after that, you're playing with house money.
Negotiation context
- It's been on market 218 days — a 12% lower offer ($87k) is reasonable based on typical stale-listing flexibility.
- 5 sale attempts since 2y ago with the ask held roughly flat each time — persistent listings suggest the price (not the market) is what's stuck; bring a comps-based counter.
Risks & watch-outs
- Watch-outs: built in 1954 — expect roof / HVAC / electrical / plumbing capex.
- Climate carrying-cost: major flood risk; major wind risk, 27% chance of damaging wind over 30y; extreme-heat days projected 7→19/yr by 2055 (HVAC capex compounding) — expect insurance premiums to compound above CPI over the hold.
Questions for the listing agent
- It's been on market 218 days. Have you received any prior offers? Is the seller open to a 12% concession, seller financing, or rate buy-down credit?
- Built in 1954 — when were the roof, HVAC, electrical panel, plumbing, and water heater last replaced?
- Why hasn't it sold? Are there any deal-killer items the seller is aware of (foundation, flood, title, zoning, code violations)?
- Is there a deadline driving the sale (1031 exchange, divorce, estate, relocation)? That informs how much negotiation room exists.
- Schools are F-rated, which usually means shorter tenancies and higher turnover. Who's the typical renter profile here, and what's been the actual vacancy rate?
- Crime grade is F in this area — have there been break-ins, vandalism, or insurance claims at this property in the last 3 years? What carrier currently insures it and at what premium?
- What's the average days-on-market for RENTAL listings here right now (not sales)? A rising rental-DOM trend means longer vacancies and softer asking-rent achievability than the comps imply.
- What's the recent tenant-quality profile in this submarket — average credit score on applications, eviction rate, late-payment / NSF rate, and stable-employment percentage? A property-management company in the area should have these aggregated.
- How much new for-sale + rental construction is in the pipeline within 1–3 miles? Heavy new supply typically softens prices + rents 12–24 months out; constrained supply supports both.
Investment metrics
- 1% rule
- 1.06% ✓
- Cap rate
- 8.61%
- Cash-on-cash
- 8.28%
- DSCR
- 1.37
- GRM
- 7.8
CMA / ARV
- ARV (median comp)
- $63,558
- List price
- $99,000
- Delta
- 55.76%
- Verdict
- OVERPRICED
- Comps
- 20 within 1.0 mi
Show comp detail 12 sales within ~0.75 mi
| Address | Dist | Beds/Ba | Sqft | Sold | Price | $/sf | Match |
|---|---|---|---|---|---|---|---|
| 3729 Pine Ave SW | 0.47mi | 3/1.0 | 1,067 (+0%) | 5mo | $70,000 | $66 | 74 |
| 1417 Brighton Rd | 0.61mi | 3/1.5 | 1,048 (-2%) | 6mo | $110,000 | $105 | 62 |
| 1101 Susan Ln | 0.62mi | 3/2.0 | 1,025 (-4%) | 1mo | $164,000 | $160 | 60 |
| 3329 Park Ave SW | 0.38mi | 3/1.0 | 1,176 (+10%) | 6mo | $59,900 | $51 | 60 |
| 6633 Avenue | 0.68mi | 3/2.0 | 1,107 (+4%) | 2mo | $99,900 | $90 | 56 |
| 2812 32nd Way SW | 0.45mi | 3/1.0 | 1,205 (+13%) | 4mo | $35,000 | $29 | 54 |
| 1205 Brighton Rd | 0.65mi | 3/1.5 | 1,147 (+8%) | 3mo | $93,000 | $81 | 53 |
| 4100 Park Ave | 0.63mi | 3/1.0 | 1,125 (+6%) | 10mo | $82,500 | $73 | 53 |
| 1240 Rayfield Dr | 0.58mi | 3/1.0 | 1,192 (+12%) | 2mo | $75,313 | $63 | 52 |
| 1376 Creel Ct | 0.73mi | 3/1.0 | 1,008 (-5%) | 8mo | $72,500 | $72 | 50 |
| 3417 Maple Ave SW | 0.42mi | 2/1.0 (-1) | 910 (-15%) | 2mo | $50,000 | $55 | 49 |
| 6636 Avenue | 0.68mi | 3/2.0 | 1,134 (+6%) | 9mo | $165,000 | $146 | 46 |
Match score weights: distance 35% · size 25% · config 20% · recency 20%. Top-matched comps best support the ARV.
Projected returns pro-forma
-1.32% appreciation · 3.0% rent growth · sell at horizon
- IRR
- 2.8%
- Equity multiple
- 1.12×
- Total profit
- $3,311
- Equity at exit
- $22,396
- IRR
- 9.7%
- Equity multiple
- 1.91×
- Total profit
- $25,162
- Equity at exit
- $22,262
Cash invested: $27,720 (down + closing). Projections, not guarantees.
Landlord ↔ Tenant lean methodology
- Overall (STATE)
- 90 Strongly Landlord-Friendly
- State Alabama
- 90 Strongly Landlord-Friendly · R+15
- County
- — inherits STATE
- City
- — inherits STATE
ZIP-level market 35221
- Home prices YoY
- -1.1%
- Active inventory
- 26
- Price-to-rent
- 7.8×
Monthly cashflow live
- Estimated rent
- $1,053 high interval (Pro) →
- Mortgage (P&I)
- −$519
- Tax from tax record
- −$80 /mo · $958/yr
- Insurance
- −$41
- HOA
- −$0
- Vacancy / Maint / Mgmt
- −$221
- Net cashflow
- $191
Break-even live
UW: 25.0% down · 7.5% · 30yr · 1.5% tax · 5.0% vac · 8.0% maint · 8.0% mgmt
Financing live
Cash to close
- Down payment
- $24,750
- Closing costs
- $2,970
- Reserves months
- —
- Total cash needed
- —
Loan-product check · same deal, 3 products live
Conventional
25% down · 7.5% · 30yr
- Down + closing
- —
- Monthly P&I
- —
- Monthly cashflow
- —
- DSCR
- —
- Eligible?
- —
Personal DTI + credit; lowest rate.
DSCR
20% down · 8.5% · 30yr
- Down + closing
- —
- Monthly P&I
- —
- Monthly cashflow
- —
- DSCR
- —
- Eligible?
- —
No personal income docs; deal must DSCR.
Hard money
10% down · 12.0% · 12mo
- Down + closing
- —
- Monthly P&I
- —
- Monthly cashflow
- —
- DSCR
- —
- Eligible?
- —
Short-term bridge; refi at stabilization.
Rent comps 40 comps
| Address | Beds | Baths | Sqft | Rent | $/sqft | DOM | Units | Dist |
|---|---|---|---|---|---|---|---|---|
| 3400 Walnut Ave SW Birmingham, AL | 3.0 | 1.0 | 1133 | $1,200 | $1.06 | 43d | 1 | 0.28mi |
| 3332 Walnut Ave SW Birmingham, AL | 3.0 | 1.0 | 1339 | $750 | $0.56 | 19d | 1 | 0.32mi |
| 3616 Maple Ave SW Birmingham, AL | 2.0 | 1.0 | 1488 | $950 | $0.64 | 43d | 1 | 0.33mi |
| 3417 Park Ave SW Birmingham, AL | 4.0 | 1.0 | 1402 | $900 | $0.64 | 43d | 1 | 0.34mi |
| 3729 Maple Ave SW Birmingham, AL | 3.0 | 2.0 | 1008 | $1,200 | $1.19 | 43d | 1 | 0.34mi |
| 3736 Oak Ave SW Birmingham, AL | 3.0 | 2.0 | 984 | $1,050 | $1.07 | 23d | 1 | 0.38mi |
| 2804 32nd Way SW Birmingham, AL | 3.0 | 1.0 | 840 | $900 | $1.07 | 43d | 1 | 0.45mi |
| 3729 Pine Ave SW Birmingham, AL | 3.0 | 1.0 | 1067 | $1,100 | $1.03 | 21d | 1 | 0.47mi |
| 2805 32nd Way SW Birmingham, AL | 3.0 | 1.0 | 792 | $900 | $1.14 | 43d | 1 | 0.48mi |
| 1112 S Gale Dr Birmingham, AL | 3.0 | 1.5 | 1053 | $1,175 | $1.12 | 43d | 1 | 0.53mi |
| 913 Daniel Cir Birmingham, AL | 4.0 | 2.0 | 1317 | $1,300 | $0.99 | 43d | 1 | 0.58mi |
| 1441 Creel St Birmingham, AL | 3.0 | 2.0 | 1319 | $1,275 | $0.97 | 3d | 1 | 0.60mi |
| 1417 Brighton Rd Birmingham, AL | 3.0 | 2.0 | 1048 | $1,200 | $1.15 | 43d | 1 | 0.61mi |
| 408 Midway St Birmingham, AL | 3.0 | 1.0 | 1301 | $1,075 | $0.83 | 19d | 1 | 0.63mi |
| 2300 31st St SW Unit ENSLEY2316 A Birmingham, AL | 2.0 | 1.0 | 750 | $1,000 | $1.33 | 2d | 1 | 0.63mi |
| 4029 Walnut Ave SW Birmingham, AL | 2.0 | 1.0 | 1300 | $1,369 | $1.05 | 3d | 1 | 0.65mi |
| 1376 Creel Ct Birmingham, AL | 3.0 | 1.0 | 1008 | $1,000 | $0.99 | 43d | 1 | 0.72mi |
| 1433 Rayfield Dr Birmingham, AL | 3.0 | 1.0 | 1064 | $950 | $0.89 | 43d | 1 | 0.76mi |
| 1838 31st St SW Birmingham, AL | 3.0 | 2.0 | 1400 | $1,223 | $0.87 | 16d | 1 | 0.81mi |
| 1412 Woodward Rd Birmingham, AL | 3.0 | 1.0 | 1220 | $1,203 | $0.99 | 16d | 1 | 0.81mi |
| 3720 Howard Ave SW Birmingham, AL | 3.0 | 1.0 | 1092 | $1,200 | $1.10 | 23d | 1 | 0.82mi |
| 4120 George Ave SW Birmingham, AL | 2.0 | 1.0 | 944 | $850 | $0.90 | 23d | 1 | 0.84mi |
| 3000 Dawson Ave SW Birmingham, AL | 3.0 | 1.0 | 1092 | $925 | $0.85 | 43d | 1 | 0.85mi |
| 340 McPherson Ave Birmingham, AL | 2.0 | 1.0 | 924 | $910 | $0.98 | 43d | 1 | 0.88mi |
| 336 McPherson Ave Birmingham, AL | 3.0 | 1.0 | 1094 | $1,100 | $1.01 | 23d | 1 | 0.88mi |
| 373 Belcher Dr Birmingham, AL | 4.0 | 1.0 | 1255 | $1,100 | $0.88 | 43d | 1 | 0.88mi |
| 1272 Meadow Ln Birmingham, AL | 2.0 | 1.0 | 744 | $800 | $1.08 | 43d | 1 | 0.93mi |
| 4009 Grasselli Ave SW Birmingham, AL | 3.0 | 1.0 | 875 | $900 | $1.03 | 23d | 1 | 0.94mi |
| 1341 Pineview Rd Birmingham, AL | 4.0 | 2.0 | 1409 | $1,300 | $0.92 | 43d | 1 | 1.06mi |
| 120 Parkwood St Birmingham, AL | 3.0 | 1.5 | 1224 | $1,150 | $0.94 | 16d | 1 | 1.07mi |
| 1012 33rd St SW Birmingham, AL | 1.0–2.0 | 1.0–2.0 | 800 | $750 | $0.94 | 2d | 1 | 1.07mi |
| 1721 Collier Dr Birmingham, AL | 2.0 | 1.0 | 925 | $800 | $0.86 | 43d | 1 | 1.09mi |
| 1340 Pineview Rd Birmingham, AL | 3.0 | 2.0 | 1116 | $1,075 | $0.96 | 43d | 1 | 1.10mi |
| 537 Grant St Birmingham, AL | 3.0 | 1.0 | 1444 | $1,200 | $0.83 | 23d | 1 | 1.11mi |
| 3116 Steiner Ave SW Birmingham, AL | 3.0 | 1.0 | 1362 | $1,200 | $0.88 | 43d | 1 | 1.12mi |
| 2709 Powderly Ave SW Birmingham, AL | 3.0 | 2.0 | 1056 | $950 | $0.90 | 23d | 1 | 1.15mi |
| 517 Grant St Birmingham, AL | 3.0 | 1.0 | 912 | $850 | $0.93 | 23d | 1 | 1.15mi |
| 2516 Powderly Ave SW Birmingham, AL | 3.0 | 1.0 | 1236 | $1,050 | $0.85 | 43d | 1 | 1.21mi |
| 5808 Court O Birmingham, AL | 3.0 | 1.5 | 1227 | $1,100 | $0.90 | 43d | 1 | 1.23mi |
| 5832 Court Q Birmingham, AL | 3.0 | 1.0 | 912 | $950 | $1.04 | 44d | 1 | 1.26mi |
Listing history 24 events
-
2026-06-18days on market $99,000 Active 218 DOM
-
2026-06-17days on market $99,000 Active 217 DOM
-
2026-06-16days on market $99,000 Active 216 DOM
-
2026-06-15days on market $99,000 Active 215 DOM
-
2026-06-13days on market $99,000 Active 213 DOM
-
2026-06-10days on market $99,000 Active 210 DOM
-
2026-06-09days on market $99,000 Active 209 DOM
-
2026-06-08days on market $99,000 Active 208 DOM
-
2026-06-07days on market $99,000 Active 207 DOM
-
2026-06-03days on market $99,000 Active 203 DOM
-
2026-06-02days on market $99,000 Active 202 DOM
-
2026-06-01days on market $99,000 Active 201 DOM
-
2026-05-31days on market $99,000 Active 200 DOM
-
2026-05-08status Active 591-char remark
Show marketing remark (591 chars)
Great investment opportunity! New HVAC system including duct work, vents, registers, and thermostat. Current tenant pays $980/mo. This property is 1 of 3 offered in a portfolio of other properties. Seller willing to sell individually or all 3 together. Other properties in portfolio are 2709 9th Street NE $125K, and 704 Falmouth Street, $81,900. Seller will not entertain subject 2 or owner financing options. Property is tenant occupied - Please DO NOT DISTURB TENANT. Only AFTER property is under contract are showings scheduled 48HRS in advance. Don't miss Rent Roll in document section.
-
2026-05-08historical 591-char remark
Show marketing remark (591 chars)
Great investment opportunity! New HVAC system including duct work, vents, registers, and thermostat. Current tenant pays $980/mo. This property is 1 of 3 offered in a portfolio of other properties. Seller willing to sell individually or all 3 together. Other properties in portfolio are 2709 9th Street NE $125K, and 704 Falmouth Street, $81,900. Seller will not entertain subject 2 or owner financing options. Property is tenant occupied - Please DO NOT DISTURB TENANT. Only AFTER property is under contract are showings scheduled 48HRS in advance. Don't miss Rent Roll in document section.
-
2025-11-11$99,000 Active 591-char remark
Show marketing remark (591 chars)
Great investment opportunity! New HVAC system including duct work, vents, registers, and thermostat. Current tenant pays $980/mo. This property is 1 of 3 offered in a portfolio of other properties. Seller willing to sell individually or all 3 together. Other properties in portfolio are 2709 9th Street NE $125K, and 704 Falmouth Street, $81,900. Seller will not entertain subject 2 or owner financing options. Property is tenant occupied - Please DO NOT DISTURB TENANT. Only AFTER property is under contract are showings scheduled 48HRS in advance. Don't miss Rent Roll in document section.
-
2024-08-23historical $980
-
2024-08-06historical $980
-
2024-08-01$980
-
2024-07-28historical $980
-
2024-07-23$980
-
2024-05-23$980
-
2023-10-31soldstatus $154,137
-
2022-07-10price $42,500
ⓘ Source: listings_history table (triggers on properties + properties_extension) + one-shot
backfill from property_details.listing_events for pre-trigger history.
Tax reassessment forecast AL · Resets to sale price
- Current annual tax
- $958 · $80/mo
- Projected year-2 tax
- $958 · $80/mo
- Expected delta
- $0/yr ($0/mo · 0.0%)
ⓘ Screening estimate from a state-policy table — verify with the county assessor before closing.
Climate risk First Street
- Flood 6/10 Major FEMA zone X (unshaded) · 75% chance over 30 yrs
- Wildfire 3/10 Moderate
- Heat 6/10 Major 7 d/yr ≥108°F today · 19 d/yr by 30 yrs out
- Wind 6/10 Major 27% chance of damaging wind over 30 yrs
- Air quality 4/10 Moderate 5 unhealthy d/yr today · 5 by 30 yrs out
Nearby sold comps map
Loading sold comps map…
Walkable amenities ~0.75 mi
Loading nearby amenities…
Taxation est. · year 1
- Rental income
- $12,633
- − Mortgage interest
- −$5,546
- − Property taxes
- −$958
- − Insurance
- −$495
- − Repairs & maintenance
- −$1,011
- − Management
- −$1,011
- − Depreciation
- −$2,880
- Taxable income
- $732
- Est. tax owed @ 24.0%
- −$176
- After-tax cash flow
- $2,120/yr
For passive investors: Depreciation is non-cash, so a rental often shows a tax loss while cash-flowing — sheltering income. Rental losses are passive: they offset passive income freely, and up to $25,000/yr can offset ordinary (W-2) income if you actively participate and your MAGI is under $100k (phasing out to $0 by $150k); unused losses carry forward. On sale, claimed depreciation is recaptured at up to 25%, and gains may owe capital-gains tax (a 1031 exchange can defer both). Figures are a year-1 estimate at your 24.0% rate — not tax advice; consult a CPA.
Schools (NCES district)
- District
- Birmingham City
- NCES district ID
- 0100390
- Math proficiency
- 4% ▼ -17.00%
- Reading proficiency
- 20% ▼ -4.00%
- Median HH income
- $31,988
- Composite
- 9.49/100
- National rank
- #9850
- State rank
- #116 of 129 in AL
Livability — Birmingham
- Score
- 67/100
- State rank
- #78
- US rank
- #10412
Category grades
Schools grade is shown separately in the Schools card above.
Census & demographics
- Census place
- Birmingham, AL
- City population
- 210,422
- Population (ZIP)
- 3,127
Population outlook (Jefferson County) Hauer SSP2
- Today (2025)
- 669,185 people
- By 2030
- 669,694 · +0.1%
- By 2040
- 661,388 · -1.2%
- By 2050
- 643,086 · -3.9%
- By 2075
- 577,267 · -13.7%
- By 2100
- 474,758 · -29.1%
Race, ethnicity, and origin ACS 2023
- Neighborhood character
- Predominantly Black (89%)
- Race & ethnicity
- Black 89% Two or more races 7% Hispanic / Latino 6% White 4%
- Hispanic origin (detail)
- Mexican 6%
- Foreign-born
- 3% · Canada
- Languages at home
- 93% English-only · Spanish 6%
Political lean MEDSL · Jefferson
- 2024 margin
- D (+10.4) · D 54.6% · R 44.2% · Other 1.2%
- 2008→2024 swing
- +5.4pp toward D · 2008: 5.1pp · 2024: 10.4pp
- All cycles
- 2024: D+10.4 2020: D+13.2 2016: D+7.2 2012: D+6.0 2008: D+5.1
Not yet ingested
- Civics
- —
Market trends
- HPI YoY
- ▼ -1.32%
- Current HPI
- 121.0566
- Rent YoY
- —
- Metro
- —
- State GDP YoY
- ▲ 2.94%
- F500 in state
- 4
Industry mix (Fortune 500 HQ in AL)
| Industry | F500 HQs | Revenue |
|---|---|---|
| Financial Services | 1 | $8B |
|
||
| Healthcare | 1 | $5B |
|
||
Price history
+132.9% since first listed11 events — show timeline
- 2026-05-08 Relisted — Greater Alabama MLS
- 2026-05-08 Delisted — Greater Alabama MLS
- 2025-11-11 Listed $99,000 Greater Alabama MLS
- 2024-08-23 Rental Removed $980 APPFOLIO
- 2024-08-06 Rental Removed $980 RENT.
- 2024-08-01 Listed for Rent $980 RENT.
- 2024-07-28 Rental Removed $980 RENT.
- 2024-07-23 Listed for Rent $980 RENT.
- 2024-05-23 Listed for Rent $980 APPFOLIO
- 2023-10-31 Sold (Public Records) $154,137 Public Records
- 2022-07-10 Price Changed $42,500 Greater Alabama MLS
Property tax history
+3.5%/yrLatest (2025): $958 · +0.0% YoY. Source: county tax records.
Cash-flow waterfall
monthlySold comps — $/sqft
last 12 mo · ≤1 miLoading sold comps…