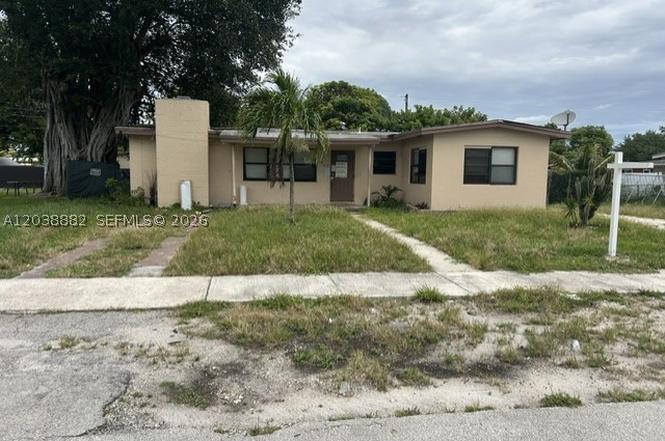
1001 NW 13th Ct · Fort Lauderdale, FL
Flood risk 3/10 · Minor
- FEMA flood zone
- X (shaded)
- Chance of flooding over 30 yrs
- 0.12%
- Est. flood insurance / yr
- $507 – $1,088
Fire risk 1/10 · Minimal
- Est. fire insurance / yr
- $947 – $1,759
Heat risk 10/10 · Severe
- Hot days now (above 105°F)
- 7 days/yr
- Hot days in 30 yrs
- 27 days/yr
Wind risk 10/10 · Severe
- Chance of severe wind over 30 yrs
- 99.0%
Air-quality risk 2/10 · Minimal
- Unhealthy air days now
- 2 days/yr
- Unhealthy air days in 30 yrs
- 2 days/yr
Risk factors via First Street. Map © Google.
Why this score? — see what drove the C+ grade
The composite is a weighted blend of 9 inputs, each scored 0–100. Each bar is that input's sub-score; the figure is the points it added to the 100-point composite (weight × sub-score).
- Cash flow +19.6/30.0
- ARV discount +15.0/15.0
- 1% rule +7.2/10.0
- DSCR +6.2/10.0
- Schools +4.1/10.0
- Livability +4.1/5.0
- Rent growth +3.2/5.0
- Condition / age +2.5/5.0
- Appreciation +0.0/10.0
$232,000
🖨 Deal sheet 📄 Offer letter ✓ Due diligence
Listing remarks
This property offers endless possibilities, sits on a well-sized lot perfect for outdoor gatherings and relaxation. Its proximity to downtown Fort Lauderdale and the airport enhances its appeal, making it an ideal choice for first-time homebuyers, families, or investors.
Key facts
- Proximity to airport
- Well-sized lot
- 9,687 sq ft lot
Tags
Property features AI
Finance
- Financial info: Annual property tax information available
Exterior
- Utilities: Public water
- Home design: Single-story home; Faces south; Resale property
- Construction: Block construction; Shingle roof
- Exterior features: Patio; Less than quarter acre lot; Zoned RS-8
Interior
- Bedrooms: Includes a family room
- Bathrooms: 2 full bathrooms
- Heating & cooling: Wall/window cooling units
- Interior features: Other interior features
Neighborhood map
What this means for you Summary
Snapshot
- This is a 3-bed/2.0-bath single-family listed at $232k.
Deal economics
- At list price, monthly cash flow is $269 ($3k/yr) — positive.
- The deal already cash-flows at list — no discount required.
- Meets the 1% rule at list price ($3k rent vs $232k).
- Cap rate 7.7% vs local median 2.2% in Fort Lauderdale — top-decile yield for the area; either an underpriced asset or a hidden risk that comps aren't pricing in. Stress-test before assuming the spread holds.
Location & tenants
- Location reads 82/100 on livability (#78 in FL, #1,293 nationally) — a professional / high-income tenant draw. Strengths: crime A+, amenities A+, health & safety A+; Watch: cost of living D-.
- Broward (suburban): math 42% / reading 53% proficiency, ranked #46 of 73 in FL (top 63%) — families likely to look elsewhere, expect single-tenant / working-renter base with shorter leases.
- Market conditions: Rents rising (+2.8%/yr); 585 active listings in the ZIP; 40 comparable units currently listed for rent nearby; rentals at typical pace (median 22d on market — plan ~3-4 weeks tenant-placement turnaround); 2,111 units permitted in Broward County in 2024 (1,265 in 5+ unit buildings).
- At $2,825/mo this rent would consume 63% of the median local household income ($54k/yr) (locally 5068% of renters already pay >50% of income on rent) — very limited rent-growth headroom before tenants either downsize or default.
Forward outlook
- Local home prices are declining (-3.0%/yr); year-one equity from $2k of loan paydown is wiped out by about $7k of value loss. Plan a longer hold.
- Broward County population projected at +34% by 2050 — long-run rental-demand tailwind backs the buy-and-hold thesis.
Negotiation context
- Only 1 days on market — expect competitive offers; lowballing is unlikely to land.
- 4 sale attempts since 2y ago with the ask held roughly flat each time — persistent listings suggest the price (not the market) is what's stuck; bring a comps-based counter.
- Current owner paid $48k; list at $232k implies a 383% gain — meaningful room to come down on a strong offer.
Risks & watch-outs
- Watch-outs: property tax is 3.4% of price; built in 1955 — expect roof / HVAC / electrical / plumbing capex.
- Climate carrying-cost: severe wind risk, 99% chance of damaging wind over 30y; extreme-heat days projected 7→27/yr by 2055 (HVAC capex compounding) — expect insurance premiums to compound above CPI over the hold.
Questions for the listing agent
- Built in 1955 — when were the roof, HVAC, electrical panel, plumbing, and water heater last replaced?
- Property tax is high relative to price — has the assessment been appealed recently, and will the sale trigger a re-assessment?
- Is there a deadline driving the sale (1031 exchange, divorce, estate, relocation)? That informs how much negotiation room exists.
- Schools are B-rated — typically a magnet for longer-tenancy family renters. What's the average tenant stay here, and is there a school-zone premium baked into asking?
- What's the average days-on-market for RENTAL listings here right now (not sales)? A rising rental-DOM trend means longer vacancies and softer asking-rent achievability than the comps imply.
- What's the recent tenant-quality profile in this submarket — average credit score on applications, eviction rate, late-payment / NSF rate, and stable-employment percentage? A property-management company in the area should have these aggregated.
- How much new for-sale + rental construction is in the pipeline within 1–3 miles? Heavy new supply typically softens prices + rents 12–24 months out; constrained supply supports both.
Investment metrics
- 1% rule
- 1.22% ✓
- Cap rate
- 7.69%
- Cash-on-cash
- 4.97%
- DSCR
- 1.22
- GRM
- 6.8
CMA / ARV
- ARV (on-the-fly)
- $444,166
- Comps found
- 8
Show comp detail 8 sales within ~0.75 mi
| Address | Dist | Beds/Ba | Sqft | Sold | Price | $/sf | Match |
|---|---|---|---|---|---|---|---|
| 1031 NW 13th St | 0.09mi | 3/2.0 | 1,336 (+1%) | 1mo | $430,000 | $322 | 92 |
| 1000 NW 13th St | 0.08mi | 4/2.0 (+1) | 1,378 (+5%) | 8mo | $465,000 | $337 | 77 |
| 1109 NW 15th Ave | 0.49mi | 3/2.0 | 1,291 (-2%) | 4mo | $439,000 | $340 | 71 |
| 1018 NW 13th Ct | 0.06mi | 4/2.0 (+1) | 1,411 (+7%) | 18mo | $373,000 | $264 | 66 |
| 1440 NW 7th Ter | 0.32mi | 3/2.0 | 1,128 (-14%) | 3mo | $550,000 | $488 | 58 |
| 1536 NW 15th Ave | 0.44mi | 4/2.0 (+1) | 1,344 (+2%) | 20mo | $400,000 | $298 | 55 |
| 1171 NW 19th St | 0.62mi | 3/2.0 | 1,354 (+3%) | 22mo | $375,000 | $277 | 48 |
| 1304 NW 19th Ave | 0.69mi | 3/2.0 | 1,193 (-10%) | 14mo | $466,300 | $391 | 40 |
Match score weights: distance 35% · size 25% · config 20% · recency 20%. Top-matched comps best support the ARV.
Projected returns pro-forma
-3.0% appreciation · 2.78% rent growth · sell at horizon
- IRR
- -8.7%
- Equity multiple
- 0.68×
- Total profit
- $-20,813
- Equity at exit
- $34,592
- IRR
- 0.5%
- Equity multiple
- 1.04×
- Total profit
- $2,471
- Equity at exit
- $20,059
Cash invested: $64,960 (down + closing). Projections, not guarantees.
Landlord ↔ Tenant lean methodology
- Overall (STATE)
- 87 Strongly Landlord-Friendly
- State Florida
- 87 Strongly Landlord-Friendly · R+3
- County
- — inherits STATE
- City
- — inherits STATE
ZIP-level market 33311
- Rents YoY
- 2.8%
- Active inventory
- 585
- Price-to-rent
- 6.8×
Monthly cashflow live
- Estimated rent
- $2,825 high interval (Pro) →
- Mortgage (P&I)
- −$1,217
- Tax from tax record
- −$650 /mo · $7,794/yr
- Insurance
- −$97
- HOA
- −$0
- Vacancy / Maint / Mgmt
- −$593
- Net cashflow
- $269
Break-even live
UW: 25.0% down · 7.5% · 30yr · 1.5% tax · 5.0% vac · 8.0% maint · 8.0% mgmt
Financing live
Cash to close
- Down payment
- $58,000
- Closing costs
- $6,960
- Reserves months
- —
- Total cash needed
- —
Loan-product check · same deal, 3 products live
Conventional
25% down · 7.5% · 30yr
- Down + closing
- —
- Monthly P&I
- —
- Monthly cashflow
- —
- DSCR
- —
- Eligible?
- —
Personal DTI + credit; lowest rate.
DSCR
20% down · 8.5% · 30yr
- Down + closing
- —
- Monthly P&I
- —
- Monthly cashflow
- —
- DSCR
- —
- Eligible?
- —
No personal income docs; deal must DSCR.
Hard money
10% down · 12.0% · 12mo
- Down + closing
- —
- Monthly P&I
- —
- Monthly cashflow
- —
- DSCR
- —
- Eligible?
- —
Short-term bridge; refi at stabilization.
Rent comps 40 comps
| Address | Beds | Baths | Sqft | Rent | $/sqft | DOM | Units | Dist |
|---|---|---|---|---|---|---|---|---|
| 918 NW 13th Ct Unit 1 Fort Lauderdale, FL | 3.0 | 2.0 | 1802 | $2,800 | $1.55 | 24d | 1 | 0.06mi |
| 1329 NW 8th Ave Unit A Fort Lauderdale, FL | 3.0 | 2.0 | 1134 | $2,350 | $2.07 | 10d | 1 | 0.16mi |
| 1414 NW 8th Ave Unit 1 Fort Lauderdale, FL | 3.0 | 2.0 | 1300 | $2,300 | $1.77 | 24d | 1 | 0.22mi |
| 1335 NW 7th Ter Fort Lauderdale, FL | 3.0 | 1.5 | 1200 | $2,550 | $2.12 | 1d | 1 | 0.22mi |
| 1203 Chateau Park Dr Fort Lauderdale, FL | 2.0 | 1.0 | 1104 | $2,000 | $1.81 | 14d | 1 | 0.23mi |
| 1129 NW 7th Ter Fort Lauderdale, FL | 4.0 | 1.0 | 1213 | $2,550 | $2.10 | 7d | 1 | 0.33mi |
| 1213 NW 6th Ave Fort Lauderdale, FL | 4.0 | 2.0 | 1323 | $3,500 | $2.65 | 24d | 1 | 0.38mi |
| 1306 NW 11th Ct Fort Lauderdale, FL | 2.0 | 1.0 | 950 | $1,827 | $1.92 | 20d | 1 | 0.40mi |
| 1325 NW 11th Ct Fort Lauderdale, FL | 3.0 | 2.0 | 1084 | $3,000 | $2.77 | 24d | 1 | 0.40mi |
| 1621 NW 7th Ter Unit B Fort Lauderdale, FL | 2.0 | 1.0 | 1344 | $2,300 | $1.71 | 24d | 1 | 0.41mi |
| 1325 NW 11th St Unit 1325 Fort Lauderdale, FL | 3.0 | 2.0 | 1084 | $3,000 | $2.77 | 24d | 1 | 0.44mi |
| 1513 NW 15th Ave Fort Lauderdale, FL | 4.0 | 2.0 | 1739 | $3,250 | $1.87 | 24d | 1 | 0.44mi |
| 1601 NW 6th Ave Fort Lauderdale, FL | 3.0 | 3.5 | 1584 | $4,500 | $2.84 | 24d | 1 | 0.45mi |
| 1531 NW 15th Ave Fort Lauderdale, FL | 3.0 | 1.0 | 960 | $3,500 | $3.65 | 4d | 1 | 0.46mi |
| 1418 NW 11th St Fort Lauderdale, FL | 3.0 | 2.0 | 1417 | $4,300 | $3.03 | 24d | 1 | 0.50mi |
| 1418 NW 11th St Fort Lauderdale, FL | 3.0 | 2.0 | 1417 | $3,750 | $2.65 | 5d | 1 | 0.50mi |
| 1600 NW 13th Ct Unit 1 Fort Lauderdale, FL | 3.0 | 1.0 | 1308 | $2,550 | $1.95 | 1d | 1 | 0.50mi |
| 1329 NW 3rd Ave Fort Lauderdale, FL | 3.0 | 2.0 | 1400 | $3,000 | $2.14 | 7d | 1 | 0.53mi |
| 1512 NW 4th Ave Fort Lauderdale, FL | 2.0 | 3.0 | 1345 | $4,700 | $3.49 | 24d | 1 | 0.53mi |
| 1629 NW 5th Ave Fort Lauderdale, FL | 2.0 | 2.0 | 1245 | $3,500 | $2.81 | 7d | 1 | 0.54mi |
| 1332 NW 3rd Ave Fort Lauderdale, FL | 4.0 | 2.0 | 1250 | $3,450 | $2.76 | 4d | 1 | 0.56mi |
| 1014 NW 6th Ave Fort Lauderdale, FL | 2.0 | 2.0 | 1350 | $1,900 | $1.41 | 24d | 1 | 0.56mi |
| 1420 NW 3rd Ave Fort Lauderdale, FL | 2.0 | 1.0 | 1076 | $2,650 | $2.46 | 24d | 1 | 0.56mi |
| 1432 NW 3rd Ave Fort Lauderdale, FL | 3.0 | 2.0 | 1047 | $3,200 | $3.06 | 24d | 1 | 0.57mi |
| 1500 NW 3rd Ave Fort Lauderdale, FL | 3.0 | 1.0 | 1072 | $2,725 | $2.54 | 24d | 1 | 0.58mi |
| 700 NW 18th St Unit 1-2 Fort Lauderdale, FL | 3.0 | 2.0 | 1012 | $3,000 | $2.96 | 21d | 1 | 0.59mi |
| 1200 NW 9th St Unit A Fort Lauderdale, FL | 2.0 | 1.0 | 1023 | $1,950 | $1.91 | 14d | 1 | 0.59mi |
| 600 NW 18th St Fort Lauderdale, FL | 2.0 | 2.0 | 1100 | $2,600 | $2.36 | 24d | 1 | 0.62mi |
| 1608 NW 16th St Fort Lauderdale, FL | 4.0 | 2.0 | 1382 | $2,830 | $2.05 | 2d | 1 | 0.63mi |
| 1218 NW 2nd Ave Fort Lauderdale, FL | 3.0 | 2.0 | 1209 | $3,199 | $2.65 | 7d | 1 | 0.63mi |
| 1218 NW 2nd Ave Fort Lauderdale, FL | 3.0 | 2.0 | 1209 | $3,199 | $2.65 | 3d | 1 | 0.63mi |
| 1025 NW 3rd Ave #1 Fort Lauderdale, FL | 2.0 | 1.0 | 1356 | $1,900 | $1.40 | 24d | 1 | 0.65mi |
| 680 Tennis Club Dr Fort Lauderdale, FL | 3.0 | 2.5–3.0 | 1342 | $2,400 | $1.79 | 17d | 2 | 0.67mi |
| 1244 NW 1st Ave Fort Lauderdale, FL | 3.0 | 2.0 | 1316 | $3,100 | $2.36 | 24d | 1 | 0.68mi |
| 535 NW 18th St Unit B Fort Lauderdale, FL | 2.0 | 1.0 | 1758 | $1,850 | $1.05 | 24d | 1 | 0.68mi |
| 701 NW 19th St Fort Lauderdale, FL | 1.0–2.0 | 1.0–2.0 | 825 | $2,000 | $2.42 | 7d | 2 | 0.68mi |
| 1533 NW 1st Ave Unit A Fort Lauderdale, FL | 3.0 | 2.0 | 1185 | $2,520 | $2.13 | 7d | 1 | 0.69mi |
| 1508 NW 1st Ave Fort Lauderdale, FL | 3.0 | 1.0 | 1202 | $2,600 | $2.16 | 24d | 1 | 0.70mi |
| 1508 NW 1st Ave Fort Lauderdale, FL | 3.0 | 1.0 | 1325 | $2,550 | $1.92 | 20d | 1 | 0.70mi |
| 1337 N Andrews Ave Unit 2 Fort Lauderdale, FL | 2.0 | 2.0 | 1121 | $2,500 | $2.23 | 10d | 1 | 0.70mi |
Listing history 2 events
-
2026-06-17remarks 271-char remark
-
2026-06-17$232,000 Active 1 DOM
ⓘ Source: listings_history table (triggers on properties + properties_extension) + one-shot
backfill from property_details.listing_events for pre-trigger history.
Tax reassessment forecast FL · Resets to sale price
- Current annual tax
- $7,794 · $650/mo
- Projected year-2 tax
- $7,794 · $650/mo
- Expected delta
- $0/yr ($0/mo · 0.0%)
ⓘ Screening estimate from a state-policy table — verify with the county assessor before closing.
Climate risk First Street
- Flood 3/10 Moderate FEMA zone X (shaded) · 12% chance over 30 yrs
- Wildfire 1/10 Low
- Heat 10/10 Extreme 7 d/yr ≥105°F today · 27 d/yr by 30 yrs out
- Wind 10/10 Extreme 99% chance of damaging wind over 30 yrs
- Air quality 2/10 Low 2 unhealthy d/yr today · 2 by 30 yrs out
Nearby sold comps map
Loading sold comps map…
Walkable amenities ~0.75 mi
Loading nearby amenities…
Taxation est. · year 1
- Rental income
- $33,903
- − Mortgage interest
- −$12,996
- − Property taxes
- −$7,794
- − Insurance
- −$1,160
- − Repairs & maintenance
- −$2,712
- − Management
- −$2,712
- − Depreciation
- −$6,749
- Taxable loss
- −$220
- Est. tax savings @ 24.0%
- +$53
- After-tax cash flow
- $3,283/yr
For passive investors: Depreciation is non-cash, so a rental often shows a tax loss while cash-flowing — sheltering income. Rental losses are passive: they offset passive income freely, and up to $25,000/yr can offset ordinary (W-2) income if you actively participate and your MAGI is under $100k (phasing out to $0 by $150k); unused losses carry forward. On sale, claimed depreciation is recaptured at up to 25%, and gains may owe capital-gains tax (a 1031 exchange can defer both). Figures are a year-1 estimate at your 24.0% rate — not tax advice; consult a CPA.
Schools (NCES district)
- District
- Broward
- NCES district ID
- 1200180
- Math proficiency
- 42% ▼ -18.00%
- Reading proficiency
- 53% ▼ -5.00%
- Median HH income
- $52,139
- Composite
- 40.88/100
- National rank
- #3621
- State rank
- #46 of 73 in FL
Livability — Fort Lauderdale
- Score
- 82/100
- State rank
- #78
- US rank
- #1293
Category grades
Schools grade is shown separately in the Schools card above.
Census & demographics
- Census place
- Fort Lauderdale, FL
- County
- Broward County · 1,963,430 people
- Metro
- Miami-Fort Lauderdale-Pompano Beach, FL
- Population (ZIP)
- 74,898
- Household income
- $53,973
- Rent vs Own
- Severe rent burden
- 5068.0
Population outlook (Broward County) Hauer SSP2
- Today (2025)
- 2,207,033 people
- By 2030
- 2,360,704 · +7.0%
- By 2040
- 2,661,208 · +20.6%
- By 2050
- 2,946,698 · +33.5%
- By 2075
- 3,602,273 · +63.2%
- By 2100
- 3,970,984 · +79.9%
Race, ethnicity, and origin ACS 2023
- Neighborhood character
- Predominantly Black (77%)
- Race & ethnicity
- Black 77% Two or more races 9% White 9% Hispanic / Latino 9%
- Hispanic origin (detail)
- Mexican 1% Puerto Rican 2% Cuban 1%
- Common ancestry
- Hispanic 15% Lithuanian 1% Romanian 0%
- Foreign-born
- 24% · Canada, Jamaica
- Languages at home
- 78% English-only · French/Haitian/Cajun 14% Spanish 6% Other Indo-European 1%
Political lean MEDSL · Broward
- 2024 margin
- D (+17.0) · D 58.0% · R 41.0%
- 2008→2024 swing
- -17.8pp toward R · 2008: 34.7pp · 2024: 17.0pp
- All cycles
- 2024: D+17.0 2020: D+29.8 2016: D+35.0 2012: D+34.9 2008: D+34.7
Not yet ingested
- Civics
- —
Market trends
- HPI YoY
- ▼ -300.68%
- Current HPI
- 535.2504
- Rent YoY
- ▲ 2.78%
- Metro
- Miami-Fort Lauderdale-Pompano Beach, FL
- State GDP YoY
- ▲ 3.28%
- F500 in state
- 36
Industry mix (Fortune 500 HQ in FL)
| Industry | F500 HQs | Revenue |
|---|---|---|
| Industrial Technology | 2 | $29B |
|
||
| Insurance | 2 | $17B |
|
||
| Retail | 1 | $60B |
|
||
| Technology Distribution | 1 | $58B |
|
||
| Homebuilding | 1 | $35B |
|
||
| Technology Manufacturing | 1 | $35B |
|
||
Price history
+383.3% since first listed8 events — show timeline
- 2026-06-17 Listed $232,000 MARMLS
- 2025-03-18 Listing Removed — MARMLS
- 2024-12-26 Listing Removed — CPARMLS
- 2024-11-24 Listing Removed — Stellar MLS as Distributed by MLS Grid
- 2024-11-11 Listed $5,000 Stellar MLS as Distributed by MLS Grid
- 2024-11-04 Listed $490,000 MARMLS
- 2024-11-01 Listed $5,000 CPARMLS
- 1984-02-01 Sold (Public Records) $48,000 Public Records
Property tax history
+17.3%/yrLatest (2025): $7,794 · +9.2% YoY. Source: county tax records.
Cash-flow waterfall
monthlySold comps — $/sqft
last 12 mo · ≤1 miLoading sold comps…