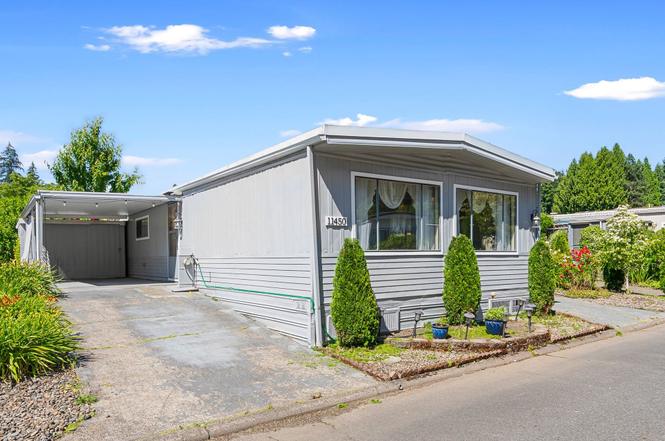
11450 SW Royal Villa Dr · Tigard, OR
Flood risk 1/10 · Minimal
- FEMA flood zone
- X (unshaded)
- Chance of flooding over 30 yrs
- 0.0%
- Est. flood insurance / yr
- $507 – $1,088
Fire risk 1/10 · Minimal
- Est. fire insurance / yr
- $498 – $926
Heat risk 3/10 · Minor
- Hot days now (above 92°F)
- 7 days/yr
- Hot days in 30 yrs
- 13 days/yr
Wind risk 1/10 · Minimal
- Chance of severe wind over 30 yrs
- —
Air-quality risk 9/10 · Severe
- Unhealthy air days now
- 12 days/yr
- Unhealthy air days in 30 yrs
- 13 days/yr
Risk factors via First Street. Map © Google.
Why this score? — see what drove the A- grade
The composite is a weighted blend of 9 inputs, each scored 0–100. Each bar is that input's sub-score; the figure is the points it added to the 100-point composite (weight × sub-score).
- Cash flow +30.0/30.0
- ARV discount +15.0/15.0
- 1% rule +10.0/10.0
- DSCR +10.0/10.0
- Schools +4.9/10.0
- Livability +4.4/5.0
- Condition / age +3.8/5.0
- Rent growth +2.4/5.0
- Appreciation +0.0/10.0
$55,000
🖨 Deal sheet 📄 Offer letter ✓ Due diligence
Listing remarks
Don’t miss out on a move in ready home nestled in a peaceful, well-maintained neighborhood that is filled with friendly, welcoming neighbors, beautiful mature trees, and active social atmosphere. The community boast top-tier amenities, including a swimming pool, a putting green, and a vibrant clubhouse. Located just minutes from the heart of Tigard, this home places everyday essentials right at your doorstep. Including a Trader Joes just 4 minutes away for convent shopping or take advantage of the fantastic surrounding dining options, ranging from casual morning stops to excellent dinner spots. With easy access to Pacific Highway, you are beautifully situated to enjoy both community t
Key facts
- Move in ready home
- Vibrant clubhouse
- Top tier amenities
Tags
Property features AI
Finance
- Other: Lot is level with paved road access; Lot classified within 0 to 2,999 sq ft range
- Financial info: Monthly lot rent of $1,225
- HOA & community: Located in Royal Villa park; Senior community
Exterior
- Parking: Carport; Off-street parking
- Utilities: Public water; Public sewer; Electric fuel
- Home design: Manufactured home in a park (model: SKYline); Residential property, resale; Single-story (main level living); No notable view
- Construction: Metal roof; Built in 1972; Crawl space foundation; Manufactured housing construction
- Exterior features: Covered patio; Aluminum exterior
Interior
- Kitchen: Built-in range; Free-standing refrigerator; Gas appliances
- Bedrooms: Primary bedroom on the main level; Second bedroom
- Bathrooms: 2 full bathrooms, both on the main level
- Heating & cooling: Forced air heating; Central air conditioning
- Interior features: One-level layout with accessibility features; Aluminum window frames; Crawl space basement
- Laundry & utility: Electric hot water
Neighborhood map
What this means for you Summary
Snapshot
- This is a 2-bed/2.0-bath manufactured listed at $55k. Condition is rated good.
Deal economics
- At list price, monthly cash flow is $993 ($12k/yr) — positive.
- The deal already cash-flows at list — no discount required.
- Meets the 1% rule at list price ($2k rent vs $55k).
- Cap rate 28.0% vs local median 2.5% in Tigard — top-decile yield for the area; either an underpriced asset or a hidden risk that comps aren't pricing in. Stress-test before assuming the spread holds.
Location & tenants
- Location reads 87/100 on livability (#14 in OR, #311 nationally) — a professional / high-income tenant draw. Strengths: amenities A+, commute A+, employment A+; Watch: crime D-, cost of living F.
- Tigard-Tualatin SD 23J (suburban): math 47% / reading 65% proficiency, ranked #6 of 58 in OR (top 10%) — acceptable for families but not a draw, mixed tenant base, ~2y average lease.
- Zoned schools: James Templeton Elementary School (reading 24%, 514 students, 47% FRL); Twality Middle School (math 54% / reading 64%, grade B, #17 of 128 statewide, top 14%, 918 students, 31% FRL); Tigard High School (math 24% / reading 75%, grade D+, #32 of 143 statewide, top 34%, 1,799 students, 31% FRL).
- Market conditions: Rents soft (-0.4%/yr); 412 active listings in the ZIP; 40 comparable units currently listed for rent nearby; rentals at typical pace (median 24d on market — plan ~3-4 weeks tenant-placement turnaround); solid renter incomes; 2,224 units permitted in Washington County in 2024 (242 in 5+ unit buildings).
Forward outlook
- Local home prices are declining (-3.0%/yr); year-one equity from $380 of loan paydown is wiped out by about $2k of value loss. Plan a longer hold.
- Washington County population projected at +33% by 2050 — long-run rental-demand tailwind backs the buy-and-hold thesis.
- At projected returns (-3.0% appreciation + 0.0% rent growth), your $15k cash investment doubles in ~2 years — after that, you're playing with house money.
Negotiation context
- Only 7 days on market — expect competitive offers; lowballing is unlikely to land.
Questions for the listing agent
- Built in 1972 — when were the roof, HVAC, electrical panel, plumbing, and water heater last replaced?
- Is there a deadline driving the sale (1031 exchange, divorce, estate, relocation)? That informs how much negotiation room exists.
- Schools are B-rated — typically a magnet for longer-tenancy family renters. What's the average tenant stay here, and is there a school-zone premium baked into asking?
- Crime grade is D in this area — have there been break-ins, vandalism, or insurance claims at this property in the last 3 years? What carrier currently insures it and at what premium?
- What's the average days-on-market for RENTAL listings here right now (not sales)? A rising rental-DOM trend means longer vacancies and softer asking-rent achievability than the comps imply.
- What's the recent tenant-quality profile in this submarket — average credit score on applications, eviction rate, late-payment / NSF rate, and stable-employment percentage? A property-management company in the area should have these aggregated.
- How much new for-sale + rental construction is in the pipeline within 1–3 miles? Heavy new supply typically softens prices + rents 12–24 months out; constrained supply supports both.
Investment metrics
- 1% rule
- 3.16% ✓
- Cap rate
- 27.96%
- Cash-on-cash
- 77.38%
- DSCR
- 4.44
- GRM
- 2.6
CMA / ARV
- ARV (on-the-fly)
- $70,720
- Comps found
- 12
Show comp detail 12 sales within ~0.75 mi
| Address | Dist | Beds/Ba | Sqft | Sold | Price | $/sf | Match |
|---|---|---|---|---|---|---|---|
| 11489 SW Royal Villa Dr #196 | 0.00mi | 2/2.0 | 1,080 (+4%) | 10mo | $73,000 | $68 | 85 |
| 11550 SW Royal Villa Dr | 0.00mi | 2/2.0 | 968 (-7%) | 11mo | $145,000 | $150 | 79 |
| 11526 SW Royal Villa Dr | 0.19mi | 2/2.0 | 960 (-8%) | 2mo | $25,000 | $26 | 77 |
| 11491 SW Royal Villa Dr | 0.16mi | 2/2.0 | 1,152 (+11%) | 10mo | $129,000 | $112 | 66 |
| 11568 SW Royal Villa Dr | 0.21mi | 2/2.0 | 1,152 (+11%) | 9mo | $155,000 | $135 | 65 |
| 17009 SW Eldorado Dr #5 | 0.65mi | 2/2.0 | 1,152 (+11%) | 1mo | $60,000 | $52 | 51 |
| 17041 SW Eldorado Dr | 0.64mi | 2/2.0 | 1,152 (+11%) | 3mo | $81,500 | $71 | 50 |
| 17003 SW Eldorado Dr | 0.62mi | 2/2.0 | 960 (-8%) | 10mo | $65,000 | $68 | 50 |
| 17084 SW Eldorado Dr | 0.62mi | 2/2.0 | 1,152 (+11%) | 7mo | $42,000 | $36 | 48 |
| 12450 SW Fischer Rd #143 | 0.52mi | 2/1.0 | 960 (-8%) | 18mo | $60,000 | $63 | 44 |
| 17229 SW Eldorado Dr | 0.71mi | 2/2.0 | 1,153 (+11%) | 10mo | $74,000 | $64 | 40 |
| 17191 SW Eldorado Dr | 0.69mi | 2/2.0 | 1,152 (+11%) | 18mo | $70,500 | $61 | 35 |
Match score weights: distance 35% · size 25% · config 20% · recency 20%. Top-matched comps best support the ARV.
Projected returns pro-forma
-3.0% appreciation · 0.0% rent growth · sell at horizon
- IRR
- 74.0%
- Equity multiple
- 4.20×
- Total profit
- $49,265
- Equity at exit
- $8,201
- IRR
- 76.9%
- Equity multiple
- 7.80×
- Total profit
- $104,759
- Equity at exit
- $4,755
Cash invested: $15,400 (down + closing). Projections, not guarantees.
Landlord ↔ Tenant lean methodology
- Overall (STATE)
- 28 Tenant-Leaning
- State Oregon
- 28 Tenant-Leaning · D+6
- County
- — inherits STATE
- City
- — inherits STATE
ZIP-level market 97224
- Rents YoY
- -0.4%
- Active inventory
- 412
- Price-to-rent
- 2.6×
Monthly cashflow live
- Estimated rent
- $1,738 high interval (Pro) →
- Mortgage (P&I)
- −$288
- Tax est. 1.5%
- −$69 /mo · $825/yr
- Insurance
- −$23
- HOA
- −$0
- Vacancy / Maint / Mgmt
- −$365
- Net cashflow
- $993
Break-even live
UW: 25.0% down · 7.5% · 30yr · 1.5% tax · 5.0% vac · 8.0% maint · 8.0% mgmt
Financing live
Cash to close
- Down payment
- $13,750
- Closing costs
- $1,650
- Reserves months
- —
- Total cash needed
- —
Loan-product check · same deal, 3 products live
Conventional
25% down · 7.5% · 30yr
- Down + closing
- —
- Monthly P&I
- —
- Monthly cashflow
- —
- DSCR
- —
- Eligible?
- —
Personal DTI + credit; lowest rate.
DSCR
20% down · 8.5% · 30yr
- Down + closing
- —
- Monthly P&I
- —
- Monthly cashflow
- —
- DSCR
- —
- Eligible?
- —
No personal income docs; deal must DSCR.
Hard money
10% down · 12.0% · 12mo
- Down + closing
- —
- Monthly P&I
- —
- Monthly cashflow
- —
- DSCR
- —
- Eligible?
- —
Short-term bridge; refi at stabilization.
Rent comps 40 comps
| Address | Beds | Baths | Sqft | Rent | $/sqft | DOM | Units | Dist |
|---|---|---|---|---|---|---|---|---|
| 17000 SW Pacific Hwy Portland, OR | 1.0–2.0 | 1.0–2.0 | 684 | $1,575 | $2.30 | 44d | 3 | 0.20mi |
| 12070 SW Fischer Rd Portland, OR | 1.0–3.0 | 1.0–2.0 | 925 | $1,812 | $1.96 | 2d | 9 | 0.34mi |
| 10900 SW Gaarde St Unit 273-16 Tigard, OR | 2.0 | 1.0 | 900 | $1,575 | $1.75 | 23d | 1 | 0.41mi |
| 10900 SW Gaarde St Portland, OR | 2.0 | 1.0 | 825 | $1,525 | $1.85 | 8d | 4 | 0.41mi |
| 11865 SW Tualatin Rd Tualatin, OR | 2.0–3.0 | 2.0–2.5 | 1154 | $1,697 | $1.47 | 2d | 19 | 0.46mi |
| 16055 SW 108th Ave Tigard, OR | 1.0–2.0 | 1.0–2.0 | 852 | $1,940 | $2.28 | 8d | 9 | 0.51mi |
| 17979 SW 115th Ave Unit 6 Tualatin, OR | 2.0 | 1.5 | 1064 | $1,625 | $1.53 | 23d | 1 | 0.55mi |
| 17989 SW 115th Ave Tualatin, OR | 2.0 | 1.0–1.5 | 982 | $1,550 | $1.58 | 23d | 2 | 0.56mi |
| 17987 SW 115th Ave Unit 1 Tualatin, OR | 2.0 | 1.0 | 900 | $1,475 | $1.64 | 23d | 1 | 0.56mi |
| 17865 SW Pacific Hwy Tualatin, OR | 1.0–3.0 | 1.0–2.0 | 970 | $1,970 | $2.03 | 2d | 13 | 0.69mi |
| 16444 SW 130th Ter King City, OR | 2.0 | 2.0 | 1002 | $1,695 | $1.69 | 44d | 1 | 0.82mi |
| 11773 SW King George Dr King City, OR | 1.0–2.0 | 1.0–2.0 | 826 | $2,500 | $3.03 | 11d | 7 | 0.85mi |
| 13060 SW Dickson St Portland, OR | 2.0 | 2.0 | 1108 | $1,850 | $1.67 | 44d | 1 | 0.86mi |
| 16849 SW 131st Ave Portland, OR | 2.0 | 2.0 | 1029 | $1,950 | $1.90 | 15d | 1 | 0.89mi |
| 11390 SW Naeve St Tigard, OR | 1.0–2.0 | 1.0–2.0 | 893 | $2,119 | $2.37 | 3d | 5 | 0.90mi |
| 15199 SW Royalty Pkwy Portland, OR | 1.0–3.0 | 1.0–2.0 | 884 | $1,805 | $2.04 | 2d | 12 | 0.90mi |
| 16901 SW 132nd Ter Unit 16915 B Tigard, OR | 1.0 | 1.0 | 714 | $1,695 | $2.37 | 4d | 1 | 0.92mi |
| 11545 SW Beef Bend Rd Portland, OR | 2.0 | 2.0 | 935 | $1,514 | $1.62 | 3d | 1 | 0.98mi |
| 9720 SW Tualatin Rd Tualatin, OR | 2.0 | 2.0 | 1100 | $1,750 | $1.59 | 44d | 1 | 1.03mi |
| 14844 SW 109th Ave Portland, OR | 2.0 | 1.5 | 1024 | $1,950 | $1.90 | 44d | 1 | 1.04mi |
| 14799 SW 109th Ave Unit 2502 Tigard, OR | 2.0 | 2.0 | 986 | $1,645 | $1.67 | 44d | 1 | 1.08mi |
| 14799 SW 109th Ave Unit 5702 Tigard, OR | 2.0 | 2.0 | 986 | $1,745 | $1.77 | 22d | 1 | 1.08mi |
| 14799 SW 109th Ave Unit 7504 Tigard, OR | 2.0 | 2.0 | 986 | $1,575 | $1.60 | 23d | 1 | 1.08mi |
| 14799 SW 109th Ave Unit 3102 Tigard, OR | 2.0 | 2.0 | 986 | $1,695 | $1.72 | 8d | 1 | 1.08mi |
| 11430 SW Bull Mountain Rd Tigard, OR | 2.0 | 2.0 | 986 | $1,970 | $2.00 | 3d | 6 | 1.10mi |
| 10695 SW Murdock St Tigard, OR | 2.0 | 1.0 | 793 | $1,806 | $2.28 | 2d | 13 | 1.11mi |
| 10779 SW Canterbury Ln Tigard, OR | 3.0 | 2.5 | 1350 | $2,275 | $1.69 | 15d | 1 | 1.28mi |
| 10775 SW Canterbury Ln #102 Portland, OR | 3.0 | 3.0 | 1373 | $2,495 | $1.82 | 23d | 1 | 1.30mi |
| 14100 SW 112th Ave Unit I08 Portland, OR | 2.0 | 1.0 | 1084 | $1,614 | $1.49 | 12d | 1 | 1.35mi |
| 14100 SW 112th Ave Unit A03 Portland, OR | 1.0 | 1.0 | 840 | $1,550 | $1.85 | 44d | 1 | 1.35mi |
| 14100 SW 112th Ave Unit F06 Portland, OR | 2.0 | 1.0 | 840 | $1,614 | $1.92 | 44d | 1 | 1.35mi |
| 13830 SW Chinn Ln Portland, OR | 1.0–3.0 | 1.0–2.0 | 839 | $1,724 | $2.05 | 3d | 11 | 1.35mi |
| 15870 SW 88th Ave Unit A Tigard, OR | 2.0 | 1.0 | 1013 | $1,745 | $1.72 | 44d | 1 | 1.37mi |
| 11050 SW Gaarde St Portland, OR | 2.0 | 1.0 | 776 | $1,400 | $1.80 | 44d | 1 | 1.38mi |
| 10900 SW Gaarde St Unit 273-04 Tigard, OR | 2.0 | 1.0 | 750 | $1,350 | $1.80 | 23d | 1 | 1.39mi |
| 14130 SW 105th Ave Portland, OR | 2.0 | 1.0 | 900 | $1,495 | $1.66 | 23d | 1 | 1.41mi |
| 14070 SW 112th Ave Portland, OR | 1.0 | 1.0 | 700 | $1,250 | $1.79 | 44d | 1 | 1.42mi |
| 10450 SW McDonald St Unit 46 Portland, OR | 2.0 | 1.0 | 800 | $1,475 | $1.84 | 44d | 1 | 1.46mi |
| 10450 SW McDonald St Unit 51 Portland, OR | 1.0 | 1.0 | 700 | $1,325 | $1.89 | 44d | 1 | 1.47mi |
| 10450 SW McDonald St Unit 5 Tigard, OR | 2.0 | 1.0 | 800 | $1,475 | $1.84 | 20d | 1 | 1.48mi |
Listing history 6 events
-
2026-06-18days on market $55,000 Active 7 DOM
-
2026-06-17days on market $55,000 Active 6 DOM
-
2026-06-16days on market $55,000 Active 5 DOM
-
2026-06-15days on market $55,000 Active 4 DOM
-
2026-06-13remarks 693-char remark
-
2026-06-13$55,000 Active 2 DOM
ⓘ Source: listings_history table (triggers on properties + properties_extension) + one-shot
backfill from property_details.listing_events for pre-trigger history.
Climate risk First Street
- Flood 1/10 Low FEMA zone X (unshaded) · 0% chance over 30 yrs
- Wildfire 1/10 Low
- Heat 3/10 Moderate 7 d/yr ≥92°F today · 13 d/yr by 30 yrs out
- Wind 1/10 Low
- Air quality 9/10 Extreme 12 unhealthy d/yr today · 13 by 30 yrs out
Nearby sold comps map
Loading sold comps map…
Walkable amenities ~0.75 mi
Loading nearby amenities…
Taxation est. · year 1
- Rental income
- $20,857
- − Mortgage interest
- −$3,081
- − Property taxes
- −$825
- − Insurance
- −$275
- − Repairs & maintenance
- −$1,669
- − Management
- −$1,669
- − Depreciation
- −$1,600
- Taxable income
- $11,739
- Est. tax owed @ 24.0%
- −$2,817
- After-tax cash flow
- $9,099/yr
For passive investors: Depreciation is non-cash, so a rental often shows a tax loss while cash-flowing — sheltering income. Rental losses are passive: they offset passive income freely, and up to $25,000/yr can offset ordinary (W-2) income if you actively participate and your MAGI is under $100k (phasing out to $0 by $150k); unused losses carry forward. On sale, claimed depreciation is recaptured at up to 25%, and gains may owe capital-gains tax (a 1031 exchange can defer both). Figures are a year-1 estimate at your 24.0% rate — not tax advice; consult a CPA.
Condition & rehab AI · 12 photos
This move-in ready manufactured home is in good condition with a good condition score of 75. It has a good exterior, interior walls, flooring, kitchen, bathrooms, roof, exterior siding, windows, foundation, structure, HVAC, and landscaping. The home has a good curb appeal and is located in a peaceful, well-maintained neighborhood with top-tier amenities. The home is located just minutes from the heart of Tigard and has easy access to Pacific Highway. The home has a good resale and rental value and can be improved with some cosmetic updates and maintenance.
Value-add opportunities
- Both Paint the exterior siding — Painting the exterior siding can enhance the curb appeal and increase the home's value.
- Both Replace the windows — Replacing old windows with energy-efficient ones can improve the home's energy efficiency and increase its value.
- Resale Update the kitchen cabinets — Updating the kitchen cabinets can make the home more appealing to potential buyers.
- Resale Update the flooring — Updating the flooring can make the home more appealing to potential buyers.
- Resale Update the bathrooms — Updating the bathrooms can make the home more appealing to potential buyers.
- Both Upgrade the HVAC system — Upgrading the HVAC system can improve the home's energy efficiency and increase its value.
- Both Landscaping improvements — Landscaping improvements can enhance the curb appeal and increase the home's value.
Renovation cost estimate screening
Value-add ROI direction
- Both Paint the exterior siding — Painting the exterior siding can enhance the curb appeal and increase the home's value. ↑
- Both Replace the windows — Replacing old windows with energy-efficient ones can improve the home's energy efficiency and increase its value. ↑
- Resale Update the kitchen cabinets — Updating the kitchen cabinets can make the home more appealing to potential buyers. ↑
- Resale Update the flooring — Updating the flooring can make the home more appealing to potential buyers. ↑
- Resale Update the bathrooms — Updating the bathrooms can make the home more appealing to potential buyers. ↑
- Both Upgrade the HVAC system — Upgrading the HVAC system can improve the home's energy efficiency and increase its value. ↑
- Both Landscaping improvements — Landscaping improvements can enhance the curb appeal and increase the home's value. ↑
ⓘ Cost ranges are severity-bucket heuristics (US national rule-of-thumb). Get contractor quotes + a written scope before underwriting a rehab budget.
Schools (NCES district)
- District
- Tigard-Tualatin SD 23J
- NCES district ID
- 4112240
- Math proficiency
- 47% ▼ -3.00%
- Reading proficiency
- 65% ▲ 3.00%
- Median HH income
- $60,739
- Composite
- 48.72/100
- National rank
- #2100
- State rank
- #6 of 58 in OR
Livability — Tigard
- Score
- 87/100
- State rank
- #14
- US rank
- #311
Category grades
Schools grade is shown separately in the Schools card above.
Census & demographics
- County
- Washington County · 583,254 people
- City population
- 87,096
- Metro
- Portland-Vancouver-Hillsboro, OR-WA
- Population (ZIP)
- 36,569
- Household income
- $98,125
- Rent vs Own
- Severe rent burden
- 1468.0
Population outlook (Washington County) Hauer SSP2
- Today (2025)
- 674,042 people
- By 2030
- 721,804 · +7.1%
- By 2040
- 812,732 · +20.6%
- By 2050
- 895,143 · +32.8%
- By 2075
- 1,058,806 · +57.1%
- By 2100
- 1,131,692 · +67.9%
Race, ethnicity, and origin ACS 2023
- Neighborhood character
- Predominantly White (73%)
- Race & ethnicity
- White 73% Hispanic / Latino 10% Two or more races 8% Asian 8% Black 3%
- Hispanic origin (detail)
- Mexican 7%
- Common ancestry
- Italian 4% Lithuanian 4% Slovak 3%
- Foreign-born
- 13% · Canada, Vietnam, China
- Languages at home
- 83% English-only · Spanish 7% Other Indo-European 3% Vietnamese 2%
Political lean MEDSL · Washington
- 2024 margin
- Solid D (+34.0) · D 65.3% · R 31.3% · Other 3.4%
- 2008→2024 swing
- +11.8pp toward D · 2008: 22.1pp · 2024: 34.0pp
- All cycles
- 2024: D+34.0 2020: D+34.6 2016: D+26.7 2012: D+17.5 2008: D+22.1
Not yet ingested
- Civics
- —
Market trends
- HPI YoY
- ▼ -287.40%
- Current HPI
- 277.57
- Rent YoY
- ▼ -0.38%
- Metro
- Portland-Vancouver-Hillsboro, OR-WA
- State GDP YoY
- ▲ 2.05%
- F500 in state
- 2
Industry mix (Fortune 500 HQ in OR)
| Industry | F500 HQs | Revenue |
|---|---|---|
| Consumer Goods | 1 | $51B |
|
||
Price history
1 event — show timeline
- 2026-06-11 Listed $55,000 RMLS
Cash-flow waterfall
monthlySold comps — $/sqft
last 12 mo · ≤1 miLoading sold comps…