 🌊 Lakefront
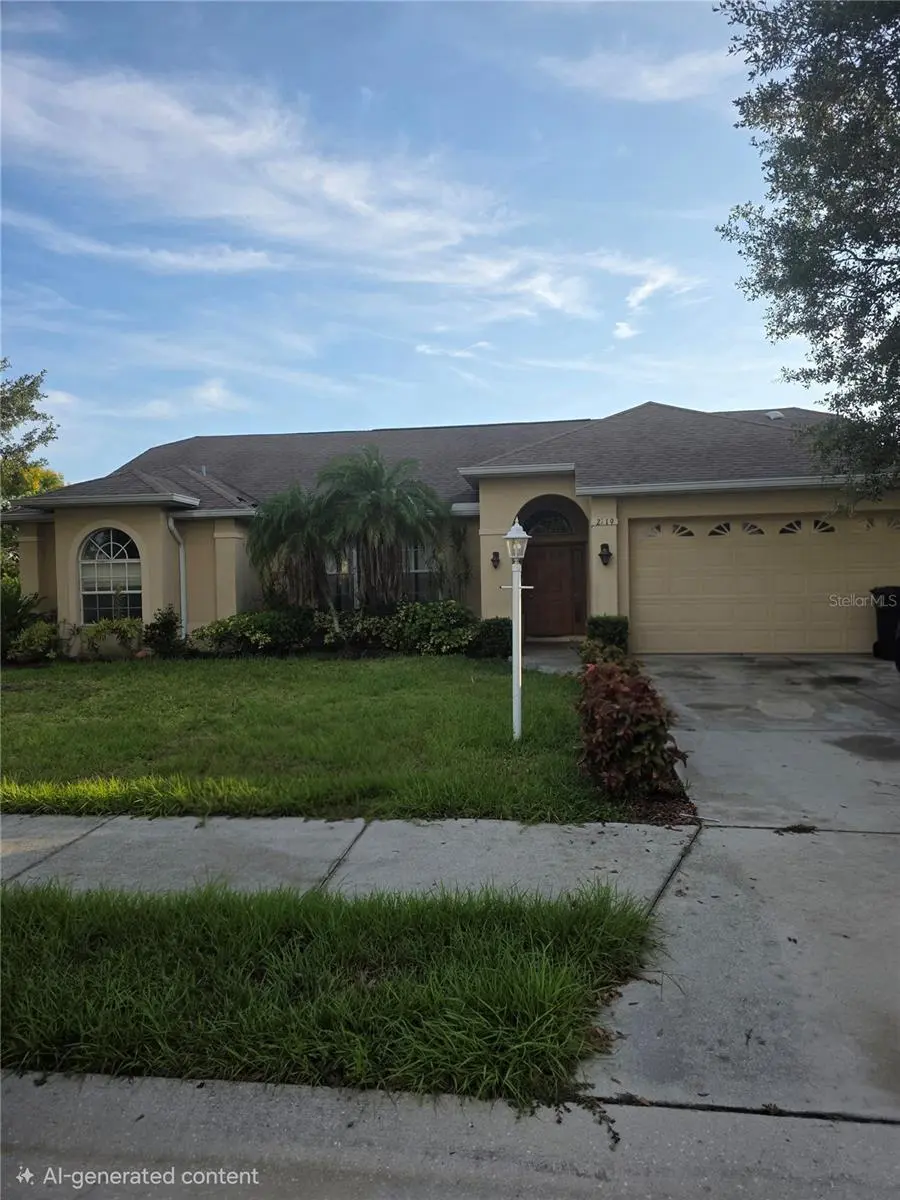
2719 46th St E · Ellenton, FL
Flood risk 1/10 · Minimal
- FEMA flood zone
- X (unshaded)
- Chance of flooding over 30 yrs
- 0.0%
- Est. flood insurance / yr
- $507 – $1,088
Fire risk 3/10 · Minor
- Est. fire insurance / yr
- $947 – $1,759
Heat risk 10/10 · Severe
- Hot days now (above 107°F)
- 7 days/yr
- Hot days in 30 yrs
- 30 days/yr
Wind risk 10/10 · Severe
- Chance of severe wind over 30 yrs
- 99.0%
Air-quality risk 3/10 · Minor
- Unhealthy air days now
- 3 days/yr
- Unhealthy air days in 30 yrs
- 3 days/yr
Risk factors via First Street. Map © Google.
Why this score? — see what drove the D+ grade
The composite is a weighted blend of 9 inputs, each scored 0–100. Each bar is that input's sub-score; the figure is the points it added to the 100-point composite (weight × sub-score).
- ARV discount +15.0/15.0
- Cash flow +12.8/30.0
- Schools +4.4/10.0
- 1% rule +4.1/10.0
- DSCR +3.8/10.0
- Livability +3.8/5.0
- Condition / age +2.5/5.0
- Rent growth +1.8/5.0
- Appreciation +0.0/10.0
$299,900
🖨 Deal sheet (PDF) 📄 Offer letter ✓ Due diligence
Listing remarks MLS
Glorious home looking for the right family
Key facts
- Lakefront lot
- Formal dining room
- Living room
Tags
Property features AI
Finance
- Other: Pets allowed
- Financial info: Lease restrictions apply
- HOA & community: Has HOA; association name listed and approval required; Quarterly association fee of $260 (approximately $86.67/month)
Exterior
- Parking: Attached garage; 2-car garage
- Utilities: Public water (available & connected); Public sewer; Electricity available and connected
- Home design: Single family residence; One story; Faces north; Residential property
- Construction: Block and stucco construction; Shingle roof; Slab foundation; Building area about 2,976 square feet
- Exterior features: Paved road access; Lot approximately 0.25 acres (1/4 to less than 1/2 acre)
Interior
- Kitchen: No appliances listed
- Bedrooms: 4 bedrooms
- Flooring: Tile
- Bathrooms: 2 full bathrooms
- Heating & cooling: Central heating; Central air conditioning
- Interior features: Vaulted ceilings; Tile flooring
- Laundry & utility: Laundry located inside
Neighborhood map
What this means for you Summary
Snapshot
- This is a 4-bed/2.0-bath single-family listed at $300k.
Deal economics
- At list price, monthly cash flow is $-28 ($-336/yr) — negative.
- To cash-flow at today's rent, offer at most $295k (1.6% below list).
- To meet the 1% rule (rent ≥ 1% of price), the offer needs to be $274k (8.5% below list).
- Recommended offer: $274k (8.5% below list) — sets the bar for 1% rule.
- Cap rate 6.2% vs local median 4.5% in Ellenton — top-decile yield for the area; either an underpriced asset or a hidden risk that comps aren't pricing in. Stress-test before assuming the spread holds.
Location & tenants
- Location reads 76/100 on livability (#232 in FL, #3,666 nationally) — a middle-class / working-renter tenant base. Strengths: cost of living A+, housing A+, health & safety A+; Watch: amenities F, commute F.
- Manatee (suburban): math 54% / reading 50% proficiency, ranked #26 of 73 in FL (top 36%) — acceptable for families but not a draw, mixed tenant base, ~2y average lease.
- Zoned schools: James Tillman Elementary Magnet School (math 65% / reading 34%, grade D, #1,088 of 2,144 statewide, top 53%, 520 students, 74% FRL); Palmetto High School (math 22% / reading 36%, grade F, #456 of 667 statewide, top 68%, 2,100 students, 61% FRL) — zoned schools average 68% FRL vs 51% district-wide (17 pts higher); higher-poverty schools than district average — tighter screening recommended.
- Zoned-school proficiency averages 39% at this address vs 52% district-wide (-13 pts) — the specific schools serving this property underperform the Manatee average; the district grade overstates school quality for this exact location.
- Market conditions: Rents soft (-3.0%/yr); 1170 active listings in the ZIP; 10 comparable units currently listed for rent nearby; rentals leasing fast (median 14d on market — plan ~1-2 weeks tenant-placement turnaround); solid renter incomes; 7,472 units permitted in Manatee County in 2024 (1,782 in 5+ unit buildings).
- This rent runs 42% of the median local income ($78k/yr) — at the standard rent-burdened threshold; future hikes will face affordability resistance.
Forward outlook
- Local home prices are declining (-3.0%/yr); year-one equity from $2k of loan paydown is wiped out by about $9k of value loss. Plan a longer hold.
- Manatee County population projected at +43% by 2050 — long-run rental-demand tailwind backs the buy-and-hold thesis.
Negotiation context
- Only 10 days on market — expect competitive offers; lowballing is unlikely to land.
- 5 sale attempts since 16y ago; this cycle's ask has dropped $20k (6%) from the opening price — seller is motivated, your offer sets the floor, not the list.
- Current owner paid $212k; 41% above their basis — modest negotiation headroom, anchor on the comps not their cost.
Risks & watch-outs
- Climate carrying-cost: severe wind risk, 99% chance of damaging wind over 30y; extreme-heat days projected 7→30/yr by 2055 (HVAC capex compounding) — expect insurance premiums to compound above CPI over the hold.
Questions for the listing agent
- What do current leases actually rent for vs. the listed asking? Can we see a recent rent roll and the last 12 months of T-12 income?
- What does the HOA fee cover, when was the last increase, and are there any pending special assessments or reserve-fund shortfalls?
- Is there a deadline driving the sale (1031 exchange, divorce, estate, relocation)? That informs how much negotiation room exists.
- Schools are D-rated, which usually means shorter tenancies and higher turnover. Who's the typical renter profile here, and what's been the actual vacancy rate?
- The area grade is low — what's the realistic commute time and amenity access for the typical tenant pool here? Any planned neighborhood developments (good or bad) we should know about?
- This sits on a lake — are riparian / water-frontage rights deeded with the parcel? Any dock permits, shoreline easements, or HOA water-use restrictions?
- What's the documented flood / surge / shoreline-erosion history here (FEMA AND non-FEMA — e.g., storm surge, creek backup, septic-field saturation)?
- Any water-quality or seasonal algae-bloom issues that affect tenant satisfaction or short-term-rental demand?
- What's the average days-on-market for RENTAL listings here right now (not sales)? A rising rental-DOM trend means longer vacancies and softer asking-rent achievability than the comps imply.
- What's the recent tenant-quality profile in this submarket — average credit score on applications, eviction rate, late-payment / NSF rate, and stable-employment percentage? A property-management company in the area should have these aggregated.
- How much new for-sale + rental construction is in the pipeline within 1–3 miles? Heavy new supply typically softens prices + rents 12–24 months out; constrained supply supports both.
Investment metrics
- 1% rule
- 0.91% ✗
- Cap rate
- 6.18%
- Cash-on-cash
- -0.40%
- DSCR
- 0.98
- GRM
- 9.1
CMA / ARV
- ARV (on-the-fly)
- $533,875
- Comps found
- 12
Show comp detail 12 sales within ~0.75 mi
| Address | Dist | Beds/Ba | Sqft | Sold | Price | $/sf | Match |
|---|---|---|---|---|---|---|---|
| 2819 47th St E | 0.08mi | 3/2.0 (-1) | 2,038 (-6%) | 3mo | $392,777 | $193 | 79 |
| 3827 Mossy Limb Ct | 0.67mi | 4/2.0 | 2,068 (-4%) | 0mo | $460,000 | $222 | 61 |
| 3844 Mossy Limb Ct | 0.71mi | 4/2.0 | 2,068 (-4%) | 1mo | $375,000 | $181 | 59 |
| 2235 50th Street Cir E | 0.38mi | 4/3.0 | 2,398 (+11%) | 6mo | $365,000 | $152 | 55 |
| 3821 Silver Strand Trl | 0.70mi | 4/2.5 | 2,260 (+5%) | 6mo | $389,000 | $172 | 53 |
| 5506 Skylight Way | 0.73mi | 3/2.5 (-1) | 2,081 (-4%) | 1mo | $382,479 | $184 | 52 |
| 3825 Silver Strand Trl | 0.71mi | 4/2.5 | 2,045 (-5%) | 6mo | $409,000 | $200 | 51 |
| 4710 35th Ave E | 0.50mi | 3/2.0 (-1) | 1,940 (-10%) | 6mo | $355,000 | $183 | 50 |
| 5643 Skylight Way 5643 Skylight Way | 0.71mi | 4/3.0 | 2,323 (+8%) | 2mo | $409,000 | $176 | 49 |
| 5647 Skylight Way | 0.72mi | 3/2.5 (-1) | 2,007 (-7%) | 1mo | $387,959 | $193 | 47 |
| 2271 50th Street Cir E | 0.57mi | 4/3.0 | 2,414 (+12%) | 4mo | $370,000 | $153 | 46 |
| 2267 50th Street Cir E | 0.55mi | 4/3.0 | 2,416 (+12%) | 6mo | $360,000 | $149 | 45 |
Match score weights: distance 35% · size 25% · config 20% · recency 20%. Top-matched comps best support the ARV.
Projected returns pro-forma
-3.0% appreciation · 0.0% rent growth · sell at horizon
- IRR
- -20.5%
- Equity multiple
- 0.31×
- Total profit
- $-58,301
- Equity at exit
- $44,716
- IRR
- -23.1%
- Equity multiple
- 0.00×
- Total profit
- $-83,654
- Equity at exit
- $25,930
Cash invested: $83,972 (down + closing). Projections, not guarantees.
Landlord ↔ Tenant lean methodology
- Overall (STATE)
- 87 Strongly Landlord-Friendly
- State Florida
- 87 Strongly Landlord-Friendly · R+3
- County
- — inherits STATE
- City
- — inherits STATE
ZIP-level market 34221
- Rents YoY
- -3.0%
- Active inventory
- 1170
- Price-to-rent
- 9.1×
Monthly cashflow live
- Estimated rent
- $2,743 high interval (Pro) →
- Mortgage (P&I)
- −$1,573
- Tax from tax record
- −$411 /mo · $4,935/yr
- Insurance
- −$125
- HOA
- −$86
- Vacancy / Maint / Mgmt
- −$576
- Net cashflow
- $-28
Break-even live
Sensitivity live
| Price | -10% $142 | -5% $57 | +0% $-28 | +5% $-113 | +10% $-198 |
|---|---|---|---|---|---|
| Rent | -10% $-245 | -5% $-136 | +0% $-28 | +5% $80 | +10% $189 |
| Rate | -1.0pp $123 | -0.5pp $48 | base $-28 | +0.5pp $-106 | +1.0pp $-185 |
UW: 25.0% down · 7.5% · 30yr · 1.5% tax · 5.0% vac · 8.0% maint · 8.0% mgmt
Financing live
Cash to close
- Down payment
- $74,975
- Closing costs
- $8,997
- Reserves months
- —
- Total cash needed
- —
Loan-product check · same deal, 3 products live
Conventional
25% down · 7.5% · 30yr
- Down + closing
- —
- Monthly P&I
- —
- Monthly cashflow
- —
- DSCR
- —
- Eligible?
- —
Personal DTI + credit; lowest rate.
DSCR
20% down · 8.5% · 30yr
- Down + closing
- —
- Monthly P&I
- —
- Monthly cashflow
- —
- DSCR
- —
- Eligible?
- —
No personal income docs; deal must DSCR.
Hard money
10% down · 12.0% · 12mo
- Down + closing
- —
- Monthly P&I
- —
- Monthly cashflow
- —
- DSCR
- —
- Eligible?
- —
Short-term bridge; refi at stabilization.
Rent comps 10 comps
| Address | Beds | Baths | Sqft | Rent | $/sqft | DOM | Units | Dist |
|---|---|---|---|---|---|---|---|---|
| 3616 Mossy Limb Ct Palmetto, FL | 4.0 | 2.0 | 2068 | $2,500 | $1.21 | 13d | 1 | 0.55mi |
| 3911 Willow Walk Dr Palmetto, FL | 3.0 | 2.0 | 1978 | $2,636 | $1.33 | 5d | 1 | 0.99mi |
| 5514 Night Owl Ter Palmetto, FL | 4.0 | 2.0 | 1752 | $2,650 | $1.51 | 17d | 1 | 1.01mi |
| 4042 Wayfarer Way Palmetto, FL | 4.0 | 2.0 | 1828 | $2,600 | $1.42 | 17d | 1 | 1.06mi |
| 5185 Rocky Coast Pl Palmetto, FL | 3.0 | 2.0 | 1529 | $2,450 | $1.60 | 16d | 1 | 1.09mi |
| 5520 Flagstone Trl Palmetto, FL | 4.0 | 2.5 | 2248 | $3,200 | $1.42 | 25d | 1 | 1.09mi |
| 5141 Rocky Coast Pl Palmetto, FL | 4.0 | 2.5 | 2260 | $2,650 | $1.17 | 5d | 1 | 1.17mi |
| 4916 Willow Breeze Way Palmetto, FL | 4.0 | 2.5 | 1997 | $2,245 | $1.12 | 3d | 1 | 1.27mi |
| 5029 Rocky Coast Pl Palmetto, FL | 3.0 | 2.0 | 1482 | $2,400 | $1.62 | 12d | 1 | 1.28mi |
| 4648 Lindever Ln Palmetto, FL | 3.0 | 2.0 | 1498 | $2,289 | $1.53 | 4d | 1 | 1.30mi |
HOA detail
- Monthly dues
- $86 · $1,032/yr
Listing history 9 events
-
2026-06-22pricedays on market $299,900 Active 10 DOM
-
2026-06-18price $300,000 Active 7 DOM
-
2026-06-18days on market $320,000 Active 7 DOM
-
2026-06-17days on market $320,000 Active 6 DOM
-
2026-06-16days on market $320,000 Active 5 DOM
-
2026-06-15days on market $320,000 Active 4 DOM
-
2026-06-13days on market $320,000 Active 2 DOM
-
2026-06-13remarks 669-char remark
-
2026-06-13$320,000 Active 1 DOM
ⓘ Source: listings_history table (triggers on properties + properties_extension) + one-shot
backfill from property_details.listing_events for pre-trigger history.
Tax reassessment forecast FL · Resets to sale price
- Current annual tax
- $4,935 · $411/mo
- Projected year-2 tax
- $4,935 · $411/mo
- Expected delta
- $0/yr ($0/mo · 0.0%)
ⓘ Screening estimate from a state-policy table — verify with the county assessor before closing.
Climate risk First Street
- Flood 1/10 Low FEMA zone X (unshaded) · 0% chance over 30 yrs
- Wildfire 3/10 Moderate
- Heat 10/10 Extreme 7 d/yr ≥107°F today · 30 d/yr by 30 yrs out
- Wind 10/10 Extreme 99% chance of damaging wind over 30 yrs
- Air quality 3/10 Moderate 3 unhealthy d/yr today · 3 by 30 yrs out
Nearby sold comps map
Loading sold comps map…
Walkable amenities ~0.75 mi
Loading nearby amenities…
Taxation est. · year 1
- Rental income
- $32,916
- − Mortgage interest
- −$16,799
- − Property taxes
- −$4,935
- − Insurance
- −$1,500
- − Repairs & maintenance
- −$2,633
- − Management
- −$2,633
- − HOA
- −$1,032
- − Depreciation
- −$8,724
- Taxable loss
- −$5,341
- Est. tax savings @ 24.0%
- +$1,282
- After-tax cash flow
- $946/yr
For passive investors: Depreciation is non-cash, so a rental often shows a tax loss while cash-flowing — sheltering income. Rental losses are passive: they offset passive income freely, and up to $25,000/yr can offset ordinary (W-2) income if you actively participate and your MAGI is under $100k (phasing out to $0 by $150k); unused losses carry forward. On sale, claimed depreciation is recaptured at up to 25%, and gains may owe capital-gains tax (a 1031 exchange can defer both). Figures are a year-1 estimate at your 24.0% rate — not tax advice; consult a CPA.
Schools (NCES district)
- District
- Manatee
- NCES district ID
- 1201230
- Math proficiency
- 54% ▼ -6.00%
- Reading proficiency
- 50% ▼ -2.00%
- Median HH income
- $49,607
- Composite
- 44.43/100
- National rank
- #2806
- State rank
- #26 of 73 in FL
Livability — Ellenton
- Score
- 76/100
- State rank
- #232
- US rank
- #3666
Category grades
Schools grade is shown separately in the Schools card above.
Census & demographics
- County
- Manatee County · 416,364 people
- City population
- 14,819
- Metro
- North Port-Sarasota-Bradenton, FL
- Population (ZIP)
- 56,208
- Household income
- $77,712
- Rent vs Own
- Severe rent burden
- 1193.0
Population outlook (Manatee County) Hauer SSP2
- Today (2025)
- 447,342 people
- By 2030
- 488,911 · +9.3%
- By 2040
- 567,934 · +27.0%
- By 2050
- 637,995 · +42.6%
- By 2075
- 781,970 · +74.8%
- By 2100
- 848,272 · +89.6%
Race, ethnicity, and origin ACS 2023
- Neighborhood character
- Diverse neighborhood (Simpson 0.58)
- Race & ethnicity
- White 59% Hispanic / Latino 22% Black 14% Two or more races 11%
- Hispanic origin (detail)
- Mexican 14% Puerto Rican 3%
- Common ancestry
- Romanian 2% Lithuanian 2% Italian 2%
- Foreign-born
- 10% · Canada, Dominican Republic, Jamaica
- Languages at home
- 81% English-only · Spanish 16% Other Indo-European 1%
Political lean MEDSL · Manatee
- 2024 margin
- Strong R (+23.5) · D 37.9% · R 61.4%
- 2008→2024 swing
- -16.5pp toward R · 2008: -7.0pp · 2024: -23.5pp
- All cycles
- 2024: R+23.5 2020: R+16.1 2016: R+17.1 2012: R+12.5 2008: R+7.0
Not yet ingested
- Civics
- —
Market trends
- HPI YoY
- ▼ -383.53%
- Current HPI
- 302.1458
- Rent YoY
- ▼ -2.98%
- Metro
- North Port-Sarasota-Bradenton, FL
- State GDP YoY
- ▲ 3.28%
- F500 in state
- 36
Industry mix (Fortune 500 HQ in FL)
| Industry | F500 HQs | Revenue |
|---|---|---|
| Industrial Technology | 2 | $29B |
|
||
| Insurance | 2 | $17B |
|
||
| Retail | 1 | $60B |
|
||
| Technology Distribution | 1 | $58B |
|
||
| Homebuilding | 1 | $35B |
|
||
| Technology Manufacturing | 1 | $35B |
|
||
Price history
-94.9% since first listed10 events — show timeline
- 2026-06-11 Listed $320,000 Stellar MLS as Distributed by MLS Grid
- 2015-08-03 Sold (Public Records) $212,000 Public Records
- 2015-07-30 Listed $212,000 Stellar MLS as Distributed by MLS Grid
- 2015-07-28 Sold (MLS) $212,000 Stellar MLS as Distributed by MLS Grid
- 2013-09-24 Listing Removed — Stellar MLS as Distributed by MLS Grid
- 2013-07-30 Listed $229,900 Stellar MLS as Distributed by MLS Grid
- 2010-06-23 Listed $174,900 Stellar MLS as Distributed by MLS Grid
- 2010-03-10 Listing Removed — Stellar MLS as Distributed by MLS Grid
- 2010-02-05 Listed $185,000 Stellar MLS as Distributed by MLS Grid
- 2006-01-24 Sold (Public Records) $6,229,000 Public Records
Property tax history
+6.9%/yrLatest (2024): $4,935 · +4.1% YoY. Source: county tax records.
Cash-flow waterfall
monthlySold comps — $/sqft
last 12 mo · ≤1 miLoading sold comps…