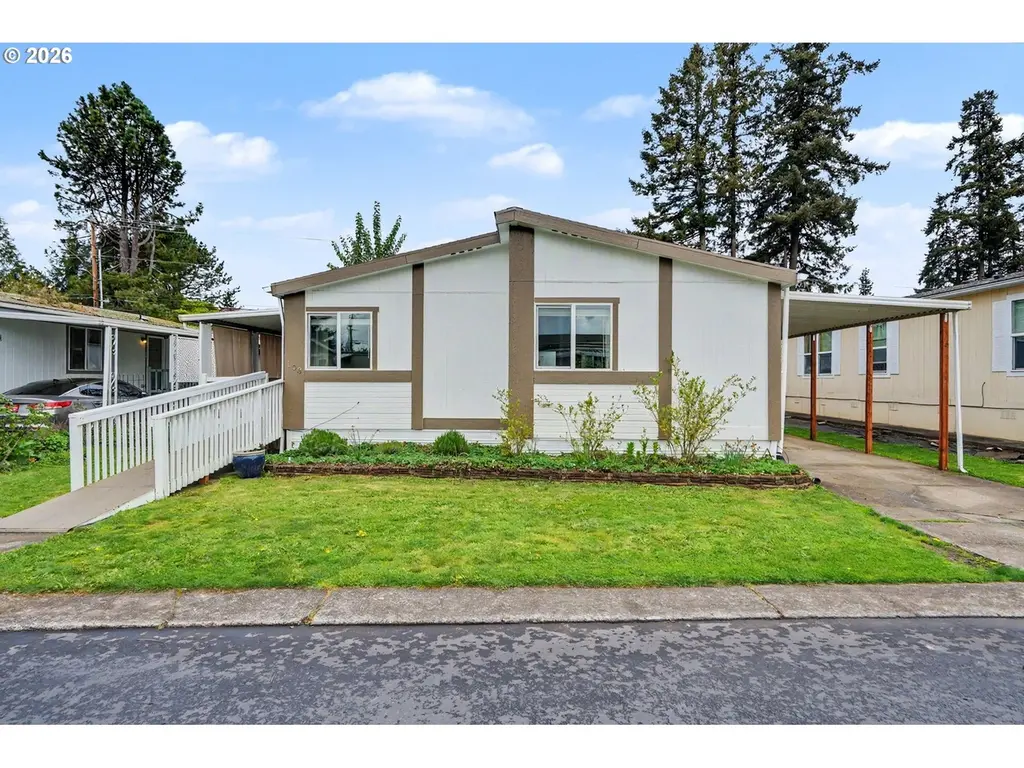
12450 SW Fischer Rd #103 · King City, OR
Flood risk 1/10 · Minimal
- FEMA flood zone
- X (shaded)
- Chance of flooding over 30 yrs
- 0.0%
- Est. flood insurance / yr
- $507 – $1,088
Fire risk 4/10 · Minor
- Est. fire insurance / yr
- $498 – $926
Heat risk 3/10 · Minor
- Hot days now (above 92°F)
- 7 days/yr
- Hot days in 30 yrs
- 14 days/yr
Wind risk 1/10 · Minimal
- Chance of severe wind over 30 yrs
- —
Air-quality risk 9/10 · Severe
- Unhealthy air days now
- 12 days/yr
- Unhealthy air days in 30 yrs
- 13 days/yr
Risk factors via First Street. Map © Google.
Why this score? — see what drove the B grade
The composite is a weighted blend of 9 inputs, each scored 0–100. Each bar is that input's sub-score; the figure is the points it added to the 100-point composite (weight × sub-score).
- Cash flow +30.0/30.0
- DSCR +10.0/10.0
- 1% rule +8.6/10.0
- ARV discount +7.5/15.0
- Schools +4.9/10.0
- Livability +4.2/5.0
- Condition / age +2.5/5.0
- Rent growth +2.4/5.0
- Appreciation +0.0/10.0
$169,000
🖨 Deal sheet 📄 Offer letter ✓ Due diligence
Listing remarks MLS
Beautifully updated and spacious 1508 sq ft home in desirable King Village! This well-maintained home features numerous upgrades, including new windows, updated plumbing, fresh exterior paint, and a newer heat pump with A/C for year-round comfort. The large, updated kitchen offers abundant space and comes complete with newer appliances.Enjoy outdoor living with two decks—perfect for entertaining—along with a yard featuring garden boxes and a storage shed. A standout feature is the versatile additional outbuilding ideal for a hobby space, entertaining area, or extra storage.Move-in ready with thoughtful updates throughout—don’t miss this opportunity!
Key facts
- Newer appliances
- Two decks
- Updated kitchen
Tags
Neighborhood map
What this means for you Summary
Snapshot
- This is a 3-bed/2.0-bath manufactured listed at $169k.
Deal economics
- At list price, monthly cash flow is $778 ($9k/yr) — positive.
- The deal already cash-flows at list — no discount required.
- Meets the 1% rule at list price ($2k rent vs $169k).
- Recommended offer: $164k (3.0% below list) — sets the bar for market timing.
- Cap rate 11.8% vs local median 2.7% in King City — top-decile yield for the area; either an underpriced asset or a hidden risk that comps aren't pricing in. Stress-test before assuming the spread holds.
Location & tenants
- Location reads 85/100 on livability (#24 in OR, #539 nationally) — a professional / high-income tenant draw. Strengths: crime A+, commute A+, housing A+.
- Tigard-Tualatin SD 23J (suburban): math 47% / reading 65% proficiency, ranked #6 of 58 in OR (top 10%) — acceptable for families but not a draw, mixed tenant base, ~2y average lease.
- Market conditions: Rents soft (-0.4%/yr); 412 active listings in the ZIP; 13 comparable units currently listed for rent nearby; rentals leasing fast (median 11d on market — plan ~1-2 weeks tenant-placement turnaround); solid renter incomes; 2,224 units permitted in Washington County in 2024 (242 in 5+ unit buildings).
Forward outlook
- Local home prices are declining (-3.0%/yr); year-one equity from $1k of loan paydown is wiped out by about $5k of value loss. Plan a longer hold.
- Washington County population projected at +33% by 2050 — long-run rental-demand tailwind backs the buy-and-hold thesis.
- At projected returns (-3.0% appreciation + 0.0% rent growth), your $47k cash investment doubles in ~8 years — after that, you're playing with house money.
Negotiation context
- It's been on market 52 days — a 3% lower offer ($164k) is reasonable based on typical stale-listing flexibility.
- Current owner paid $50k; list at $169k implies a 238% gain — meaningful room to come down on a strong offer.
Questions for the listing agent
- It's been on market 52 days. Have you received any prior offers? Is the seller open to a 3% concession, seller financing, or rate buy-down credit?
- Is there a deadline driving the sale (1031 exchange, divorce, estate, relocation)? That informs how much negotiation room exists.
- What's the average days-on-market for RENTAL listings here right now (not sales)? A rising rental-DOM trend means longer vacancies and softer asking-rent achievability than the comps imply.
- What's the recent tenant-quality profile in this submarket — average credit score on applications, eviction rate, late-payment / NSF rate, and stable-employment percentage? A property-management company in the area should have these aggregated.
- How much new for-sale + rental construction is in the pipeline within 1–3 miles? Heavy new supply typically softens prices + rents 12–24 months out; constrained supply supports both.
Investment metrics
- 1% rule
- 1.36% ✓
- Cap rate
- 11.82%
- Cash-on-cash
- 19.72%
- DSCR
- 1.88
- GRM
- 6.1
CMA / ARV
- ARV (median comp)
- $76,316
- List price
- $169,000
- Delta
- 121.45%
- Verdict
- OVERPRICED
- Comps
- 20 within 1.0 mi
Show comp detail 12 sales within ~0.75 mi
| Address | Dist | Beds/Ba | Sqft | Sold | Price | $/sf | Match |
|---|---|---|---|---|---|---|---|
| 17123 SW Eldorado Dr | 0.30mi | 3/2.0 | 1,568 (+4%) | 2mo | $129,985 | $83 | 78 |
| 17088 SW Eldorado Dr | 0.23mi | 2/2.0 (-1) | 1,440 (-4%) | 2mo | $23,000 | $16 | 76 |
| 13620 SW Beef Bend Rd #1 | 0.66mi | 3/2.0 | 1,525 (+1%) | 1mo | $199,000 | $130 | 66 |
| 11668 SW Royal Villa Dr #77 | 0.49mi | 2/2.0 (-1) | 1,440 (-4%) | 3mo | $67,000 | $47 | 62 |
| 17151 SW Eldorado Dr #85 | 0.32mi | 2/2.0 (-1) | 1,344 (-11%) | 3mo | $62,000 | $46 | 60 |
| 18485 SW Pacific Dr #64 | 0.74mi | 3/2.0 | 1,456 (-3%) | 4mo | $94,000 | $65 | 57 |
| 11656 SW Royal Villa Dr #71 | 0.48mi | 3/2.0 | 1,344 (-11%) | 6mo | $42,500 | $32 | 55 |
| 18485 SW Pacific Dr #53 | 0.72mi | 2/2.0 (-1) | 1,440 (-4%) | 3mo | $120,000 | $83 | 52 |
| 13620 SW Beef Bend Rd #66 | 0.64mi | 3/2.0 | 1,684 (+12%) | 1mo | $120,000 | $71 | 50 |
| 11560 SW Royal Villa Dr | 0.53mi | 2/2.0 (-1) | 1,334 (-12%) | 5mo | $35,000 | $26 | 47 |
| 13620 SW Beef Bend Rd #146 | 0.63mi | 3/2.0 | 1,728 (+15%) | 0mo | $115,000 | $67 | 46 |
| 18485 SW Pacific Dr #37 | 0.70mi | 3/2.0 | 1,296 (-14%) | 0mo | $85,000 | $66 | 44 |
Match score weights: distance 35% · size 25% · config 20% · recency 20%. Top-matched comps best support the ARV.
Projected returns pro-forma
-3.0% appreciation · 0.0% rent growth · sell at horizon
- IRR
- 8.6%
- Equity multiple
- 1.32×
- Total profit
- $15,363
- Equity at exit
- $25,198
- IRR
- 15.2%
- Equity multiple
- 2.08×
- Total profit
- $50,931
- Equity at exit
- $14,612
Cash invested: $47,320 (down + closing). Projections, not guarantees.
Landlord ↔ Tenant lean methodology
- Overall (STATE)
- 28 Tenant-Leaning
- State Oregon
- 28 Tenant-Leaning · D+6
- County
- — inherits STATE
- City
- — inherits STATE
ZIP-level market 97224
- Rents YoY
- -0.4%
- Active inventory
- 412
- Price-to-rent
- 6.1×
Monthly cashflow live
- Estimated rent
- $2,300 high interval (Pro) →
- Mortgage (P&I)
- −$886
- Tax from tax record
- −$83 /mo · $990/yr
- Insurance
- −$70
- HOA
- −$0
- Vacancy / Maint / Mgmt
- −$483
- Net cashflow
- $778
Break-even live
UW: 25.0% down · 7.5% · 30yr · 1.5% tax · 5.0% vac · 8.0% maint · 8.0% mgmt
Financing live
Cash to close
- Down payment
- $42,250
- Closing costs
- $5,070
- Reserves months
- —
- Total cash needed
- —
Loan-product check · same deal, 3 products live
Conventional
25% down · 7.5% · 30yr
- Down + closing
- —
- Monthly P&I
- —
- Monthly cashflow
- —
- DSCR
- —
- Eligible?
- —
Personal DTI + credit; lowest rate.
DSCR
20% down · 8.5% · 30yr
- Down + closing
- —
- Monthly P&I
- —
- Monthly cashflow
- —
- DSCR
- —
- Eligible?
- —
No personal income docs; deal must DSCR.
Hard money
10% down · 12.0% · 12mo
- Down + closing
- —
- Monthly P&I
- —
- Monthly cashflow
- —
- DSCR
- —
- Eligible?
- —
Short-term bridge; refi at stabilization.
Rent comps 13 comps
| Address | Beds | Baths | Sqft | Rent | $/sqft | DOM | Units | Dist |
|---|---|---|---|---|---|---|---|---|
| 12070 SW Fischer Rd Portland, OR | 1.0–3.0 | 1.0–2.0 | 925 | $2,099 | $2.27 | 2d | 9 | 0.20mi |
| 13060 SW Dickson St Portland, OR | 2.0 | 2.0 | 1108 | $1,850 | $1.67 | 44d | 1 | 0.38mi |
| 17865 SW Pacific Hwy Tualatin, OR | 1.0–3.0 | 1.0–2.0 | 970 | $2,242 | $2.31 | 2d | 13 | 0.38mi |
| 16903 SW 133rd Ter Portland, OR | 3.0 | 2.5 | 1665 | $2,845 | $1.71 | 10d | 1 | 0.45mi |
| 11865 SW Tualatin Rd Tualatin, OR | 2.0–3.0 | 2.0–2.5 | 1154 | $2,737 | $2.37 | 2d | 19 | 0.48mi |
| 17979 SW 115th Ave Unit 6 Tualatin, OR | 2.0 | 1.5 | 1064 | $1,625 | $1.53 | 24d | 1 | 0.59mi |
| 17335 SW Montague Way Portland, OR | 3.0 | 2.5 | 1687 | $3,175 | $1.88 | 2d | 1 | 0.63mi |
| 17989 SW 115th Ave Tualatin, OR | 2.0 | 1.0–1.5 | 982 | $1,550 | $1.58 | 24d | 2 | 0.65mi |
| 15205 SW 119th Ave Portland, OR | 2.0 | 2.0 | 1650 | $2,150 | $1.30 | 20d | 1 | 0.93mi |
| 15199 SW Royalty Pkwy Portland, OR | 1.0–3.0 | 1.0–2.0 | 884 | $2,205 | $2.49 | 2d | 12 | 1.18mi |
| 15050 SW 141st Ave Portland, OR | 3.0 | 2.0 | 2051 | $3,495 | $1.70 | 18d | 1 | 1.26mi |
| 10695 SW Murdock St Tigard, OR | 2.0 | 1.0 | 793 | $1,806 | $2.28 | 2d | 13 | 1.41mi |
| 9720 SW Tualatin Rd Tualatin, OR | 2.0 | 2.0 | 1100 | $1,750 | $1.59 | 44d | 1 | 1.44mi |
Listing history 8 events
-
2026-06-07statusdays on market $169,000 Pending 52 DOM
-
2026-06-05days on market $169,000 Active 51 DOM
-
2026-06-03days on market $169,000 Active 50 DOM
-
2026-06-02days on market $169,000 Active 49 DOM
-
2026-06-01days on market $169,000 Active 48 DOM
-
2026-05-31days on market $169,000 Active 47 DOM
-
2026-04-14$179,000 Active 681-char remark
Show marketing remark (681 chars)
Beautifully updated and spacious 1508 sq ft home in desirable King Village! This well-maintained home features numerous upgrades, including new windows, updated plumbing, fresh exterior paint, and a newer heat pump with A/C for year-round comfort. The large, updated kitchen offers abundant space and comes complete with newer appliances.Enjoy outdoor living with two decks—perfect for entertaining—along with a yard featuring garden boxes and a storage shed. A standout feature is the versatile additional outbuilding ideal for a hobby space, entertaining area, or extra storage.Move-in ready with thoughtful updates throughout—don’t miss this opportunity!
-
1989-12-29soldstatus $50,000
ⓘ Source: listings_history table (triggers on properties + properties_extension) + one-shot
backfill from property_details.listing_events for pre-trigger history.
Tax reassessment forecast OR · Resets to sale price
- Current annual tax
- $990 · $83/mo
- Projected year-2 tax
- $1,639 · $137/mo
- Expected delta
- +$649/yr (+$54/mo · 65.5%)
ⓘ Screening estimate from a state-policy table — verify with the county assessor before closing.
Climate risk First Street
- Flood 1/10 Low FEMA zone X (shaded) · 0% chance over 30 yrs
- Wildfire 4/10 Moderate
- Heat 3/10 Moderate 7 d/yr ≥92°F today · 14 d/yr by 30 yrs out
- Wind 1/10 Low
- Air quality 9/10 Extreme 12 unhealthy d/yr today · 13 by 30 yrs out
Nearby sold comps map
Loading sold comps map…
Walkable amenities ~0.75 mi
Loading nearby amenities…
Taxation est. · year 1
- Rental income
- $27,599
- − Mortgage interest
- −$9,467
- − Property taxes
- −$990
- − Insurance
- −$845
- − Repairs & maintenance
- −$2,208
- − Management
- −$2,208
- − Depreciation
- −$4,916
- Taxable income
- $6,965
- Est. tax owed @ 24.0%
- −$1,671
- After-tax cash flow
- $7,661/yr
For passive investors: Depreciation is non-cash, so a rental often shows a tax loss while cash-flowing — sheltering income. Rental losses are passive: they offset passive income freely, and up to $25,000/yr can offset ordinary (W-2) income if you actively participate and your MAGI is under $100k (phasing out to $0 by $150k); unused losses carry forward. On sale, claimed depreciation is recaptured at up to 25%, and gains may owe capital-gains tax (a 1031 exchange can defer both). Figures are a year-1 estimate at your 24.0% rate — not tax advice; consult a CPA.
Schools (NCES district)
- District
- Tigard-Tualatin SD 23J
- NCES district ID
- 4112240
- Math proficiency
- 47% ▼ -3.00%
- Reading proficiency
- 65% ▲ 3.00%
- Median HH income
- $60,739
- Composite
- 48.72/100
- National rank
- #2100
- State rank
- #6 of 58 in OR
Livability — King City
- Score
- 85/100
- State rank
- #24
- US rank
- #539
Category grades
Schools grade is shown separately in the Schools card above.
Census & demographics
- County
- Washington County · 583,254 people
- Metro
- Portland-Vancouver-Hillsboro, OR-WA
- Population (ZIP)
- 36,569
- Household income
- $98,125
- Rent vs Own
- Severe rent burden
- 1468.0
Population outlook (Washington County) Hauer SSP2
- Today (2025)
- 674,042 people
- By 2030
- 721,804 · +7.1%
- By 2040
- 812,732 · +20.6%
- By 2050
- 895,143 · +32.8%
- By 2075
- 1,058,806 · +57.1%
- By 2100
- 1,131,692 · +67.9%
Race, ethnicity, and origin ACS 2023
- Neighborhood character
- Predominantly White (73%)
- Race & ethnicity
- White 73% Hispanic / Latino 10% Two or more races 8% Asian 8% Black 3%
- Hispanic origin (detail)
- Mexican 7%
- Common ancestry
- Italian 4% Lithuanian 4% Slovak 3%
- Foreign-born
- 13% · Canada, Vietnam, China
- Languages at home
- 83% English-only · Spanish 7% Other Indo-European 3% Vietnamese 2%
Political lean MEDSL · Washington
- 2024 margin
- Solid D (+34.0) · D 65.3% · R 31.3% · Other 3.4%
- 2008→2024 swing
- +11.8pp toward D · 2008: 22.1pp · 2024: 34.0pp
- All cycles
- 2024: D+34.0 2020: D+34.6 2016: D+26.7 2012: D+17.5 2008: D+22.1
Not yet ingested
- Civics
- —
Market trends
- HPI YoY
- ▼ -287.40%
- Current HPI
- 277.57
- Rent YoY
- ▼ -0.38%
- Metro
- Portland-Vancouver-Hillsboro, OR-WA
- State GDP YoY
- ▲ 2.05%
- F500 in state
- 2
Industry mix (Fortune 500 HQ in OR)
| Industry | F500 HQs | Revenue |
|---|---|---|
| Consumer Goods | 1 | $51B |
|
||
Price history
+258.0% since first listed2 events — show timeline
- 2026-04-14 Listed $179,000 RMLS
- 1989-12-29 Sold (Public Records) $50,000 Public Records
Property tax history
+4.8%/yrLatest (2025): $990 · +10.4% YoY. Source: county tax records.
Cash-flow waterfall
monthlySold comps — $/sqft
last 12 mo · ≤1 miLoading sold comps…