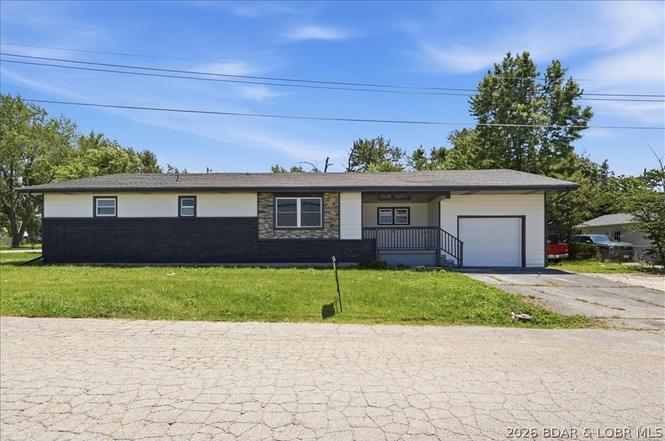
1024 Jay St · Eldon, MO
Flood risk 1/10 · Minimal
- FEMA flood zone
- X (unshaded)
- Chance of flooding over 30 yrs
- 0.0%
- Est. flood insurance / yr
- $507 – $1,088
Fire risk 3/10 · Minor
- Est. fire insurance / yr
- $1,054 – $1,958
Heat risk 4/10 · Minor
- Hot days now (above 108°F)
- 7 days/yr
- Hot days in 30 yrs
- 19 days/yr
Wind risk 2/10 · Minimal
- Chance of severe wind over 30 yrs
- —
Air-quality risk 1/10 · Minimal
- Unhealthy air days now
- 0 days/yr
- Unhealthy air days in 30 yrs
- 0 days/yr
Risk factors via First Street. Map © Google.
Why this score? — see what drove the D grade
The composite is a weighted blend of 9 inputs, each scored 0–100. Each bar is that input's sub-score; the figure is the points it added to the 100-point composite (weight × sub-score).
- Appreciation +10.0/10.0
- Cash flow +7.8/30.0
- ARV discount +7.5/15.0
- Schools +4.1/10.0
- Livability +3.3/5.0
- Rent growth +2.5/5.0
- Condition / age +2.5/5.0
- DSCR +1.9/10.0
- 1% rule +1.1/10.0
$215,000
🖨 Deal sheet 📄 Offer letter ✓ Due diligence
Listing remarks
Welcome home to this beautifully remodeled 4-bedroom, 2-bath property located in the heart of Eldon. Situated on a spacious 1/3-acre fenced corner lot, this move-in-ready home has been thoughtfully updated inside and out! Step inside to discover updated finishes throughout, including refreshed flooring, fixtures, and contemporary touches that create a warm and inviting atmosphere. Multiple living spaces provide flexibility for entertaining, relaxing, working from home, or accommodating a growing family. The well-designed layout offers comfortable bedrooms, updated bathrooms, and plenty of room to spread out. Outside, you'll appreciate the fully fenced yard, perfect for pets, play, gardening
Key facts
- Updated finishes
- One-car garage
- Fenced corner lot
Tags
Property features AI
Exterior
- Parking: Attached garage with garage door opener (1 space); Concrete driveway
- Utilities: Public water; Public sewer
- Home design: Single-family detached home; One level; Updated/remodeled condition
- Construction: Brick construction; Shingle roof; Crawl space foundation; Built or significantly updated (updated/remodeled)
- Exterior features: Covered deck; City lot; Level lot; Asphalt-paved road access
Interior
- Kitchen: Cooktop; Range; Dishwasher
- Flooring: Vinyl flooring
- Bathrooms: 2 full bathrooms
- Heating & cooling: Electric forced-air heating; Central air conditioning
- Interior features: Unfurnished; Accessible full bathroom; Fireplace (1)
Neighborhood map
What this means for you Summary
Snapshot
- This is a 4-bed/2.0-bath other listed at $215k.
Deal economics
- At list price, monthly cash flow is $-241 ($-3k/yr) — negative.
- To cash-flow at today's rent, offer at most $172k (19.8% below list).
- To meet the 1% rule (rent ≥ 1% of price), the offer needs to be $132k (38.8% below list).
- Recommended offer: $132k (38.8% below list) — sets the bar for 1% rule.
Location & tenants
- Location reads 66/100 on livability (#249 in MO) — a middle-class / working-renter tenant base. Strengths: cost of living A+, housing A+, crime B+; Watch: employment D, amenities F, commute F.
- Eldon R-I (town): math 46% / reading 54% proficiency, ranked #52 of 324 in MO (top 16%) — acceptable for families but not a draw, mixed tenant base, ~2y average lease.
- Market conditions: 106 active listings in the ZIP; 88 units permitted in Miller County in 2024 (31 in 5+ unit buildings).
Forward outlook
- In year one you build about $23k of equity ($1k loan paydown + $22k appreciation (10.0% local appreciation)).
- Miller County population projected to shrink 8% by 2050 — rents likely to lag national; underwrite the cash flow, not the appreciation.
- By year 2, paydown + projected appreciation supports a ~$37k cash-out refi (75% LTV) — recoverable capital for the next deal without selling this one.
Negotiation context
- Only 1 days on market — expect competitive offers; lowballing is unlikely to land.
Questions for the listing agent
- What do current leases actually rent for vs. the listed asking? Can we see a recent rent roll and the last 12 months of T-12 income?
- Built in 1973 — when were the roof, HVAC, electrical panel, plumbing, and water heater last replaced?
- Is there a deadline driving the sale (1031 exchange, divorce, estate, relocation)? That informs how much negotiation room exists.
- The area grade is low — what's the realistic commute time and amenity access for the typical tenant pool here? Any planned neighborhood developments (good or bad) we should know about?
- What's the average days-on-market for RENTAL listings here right now (not sales)? A rising rental-DOM trend means longer vacancies and softer asking-rent achievability than the comps imply.
- What's the recent tenant-quality profile in this submarket — average credit score on applications, eviction rate, late-payment / NSF rate, and stable-employment percentage? A property-management company in the area should have these aggregated.
- How much new for-sale + rental construction is in the pipeline within 1–3 miles? Heavy new supply typically softens prices + rents 12–24 months out; constrained supply supports both.
Investment metrics
- 1% rule
- 0.61% ✗
- Cap rate
- 4.95%
- Cash-on-cash
- -4.80%
- DSCR
- 0.79
- GRM
- 13.6
CMA / ARV
No comps found within radius.
Projected returns pro-forma
10.0% appreciation · 3.0% rent growth · sell at horizon
- IRR
- 20.9%
- Equity multiple
- 2.69×
- Total profit
- $101,658
- Equity at exit
- $193,689
- IRR
- 18.9%
- Equity multiple
- 6.17×
- Total profit
- $311,210
- Equity at exit
- $417,698
Cash invested: $60,200 (down + closing). Projections, not guarantees.
Landlord ↔ Tenant lean methodology
- Overall (STATE)
- 81 Strongly Landlord-Friendly
- State Missouri
- 81 Strongly Landlord-Friendly · R+10
- County
- — inherits STATE
- City
- — inherits STATE
ZIP-level market 65026
- Home prices YoY
- 5.3%
- Active inventory
- 106
- Price-to-rent
- 13.6×
Monthly cashflow live
- Estimated rent
- $1,316 medium interval (Pro) →
- Mortgage (P&I)
- −$1,127
- Tax from tax record
- −$64 /mo · $763/yr
- Insurance
- −$90
- HOA
- −$0
- Vacancy / Maint / Mgmt
- −$276
- Net cashflow
- $-241
Break-even live
UW: 25.0% down · 7.5% · 30yr · 1.5% tax · 5.0% vac · 8.0% maint · 8.0% mgmt
Financing live
Cash to close
- Down payment
- $53,750
- Closing costs
- $6,450
- Reserves months
- —
- Total cash needed
- —
Loan-product check · same deal, 3 products live
Conventional
25% down · 7.5% · 30yr
- Down + closing
- —
- Monthly P&I
- —
- Monthly cashflow
- —
- DSCR
- —
- Eligible?
- —
Personal DTI + credit; lowest rate.
DSCR
20% down · 8.5% · 30yr
- Down + closing
- —
- Monthly P&I
- —
- Monthly cashflow
- —
- DSCR
- —
- Eligible?
- —
No personal income docs; deal must DSCR.
Hard money
10% down · 12.0% · 12mo
- Down + closing
- —
- Monthly P&I
- —
- Monthly cashflow
- —
- DSCR
- —
- Eligible?
- —
Short-term bridge; refi at stabilization.
Listing history 2 events
-
2026-06-18remarks 699-char remark
-
2026-06-18$215,000 Active 1 DOM
ⓘ Source: listings_history table (triggers on properties + properties_extension) + one-shot
backfill from property_details.listing_events for pre-trigger history.
Tax reassessment forecast MO · Resets to sale price
- Current annual tax
- $763 · $64/mo
- Projected year-2 tax
- $2,086 · $174/mo
- Expected delta
- +$1,322/yr (+$110/mo · 173.2%)
ⓘ Screening estimate from a state-policy table — verify with the county assessor before closing.
Climate risk First Street
- Flood 1/10 Low FEMA zone X (unshaded) · 0% chance over 30 yrs
- Wildfire 3/10 Moderate
- Heat 4/10 Moderate 7 d/yr ≥108°F today · 19 d/yr by 30 yrs out
- Wind 2/10 Low
- Air quality 1/10 Low 0 unhealthy d/yr today · 0 by 30 yrs out
Nearby sold comps map
Loading sold comps map…
Walkable amenities ~0.75 mi
Loading nearby amenities…
Taxation est. · year 1
- Rental income
- $15,797
- − Mortgage interest
- −$12,043
- − Property taxes
- −$763
- − Insurance
- −$1,075
- − Repairs & maintenance
- −$1,264
- − Management
- −$1,264
- − Depreciation
- −$6,255
- Taxable loss
- −$6,867
- Est. tax savings @ 24.0%
- +$1,648
- After-tax cash flow
- $-1,240/yr
For passive investors: Depreciation is non-cash, so a rental often shows a tax loss while cash-flowing — sheltering income. Rental losses are passive: they offset passive income freely, and up to $25,000/yr can offset ordinary (W-2) income if you actively participate and your MAGI is under $100k (phasing out to $0 by $150k); unused losses carry forward. On sale, claimed depreciation is recaptured at up to 25%, and gains may owe capital-gains tax (a 1031 exchange can defer both). Figures are a year-1 estimate at your 24.0% rate — not tax advice; consult a CPA.
Schools (NCES district)
- District
- Eldon R-I
- NCES district ID
- 2911340
- Math proficiency
- 46% ▼ -2.00%
- Reading proficiency
- 54% ▼ -2.00%
- Median HH income
- $34,415
- Composite
- 41.27/100
- National rank
- #3521
- State rank
- #52 of 324 in MO
Livability — Eldon
- Score
- 66/100
- State rank
- #249
- US rank
- #12203
Category grades
Schools grade is shown separately in the Schools card above.
Census & demographics
- Census place
- Eldon, MO
- Population (ZIP)
- 11,648
Population outlook (Miller County) Hauer SSP2
- Today (2025)
- 25,396 people
- By 2030
- 25,344 · -0.2%
- By 2040
- 24,740 · -2.6%
- By 2050
- 23,415 · -7.8%
- By 2075
- 19,426 · -23.5%
- By 2100
- 13,742 · -45.9%
Race, ethnicity, and origin ACS 2023
- Neighborhood character
- Predominantly White (94%)
- Race & ethnicity
- White 94% Two or more races 2% Hispanic / Latino 2%
- Common ancestry
- Slovak 4% Italian 2% Romanian 1%
- Foreign-born
- 1% · China, Canada
- Languages at home
- 95% English-only · Spanish 2% French/Haitian/Cajun 2%
Political lean MEDSL · Miller
- 2024 margin
- Solid R (+67.3) · D 15.9% · R 83.2%
- 2008→2024 swing
- -30.5pp toward R · 2008: -36.8pp · 2024: -67.3pp
- All cycles
- 2024: R+67.3 2020: R+65.7 2016: R+66.0 2012: R+49.4 2008: R+36.8
Not yet ingested
- Civics
- —
Market trends
- HPI YoY
- ▲ 20.13%
- Current HPI
- 400.83
- Rent YoY
- —
- Metro
- —
- State GDP YoY
- ▲ 1.84%
- F500 in state
- 20
Industry mix (Fortune 500 HQ in MO)
| Industry | F500 HQs | Revenue |
|---|---|---|
| Healthcare | 1 | $163B |
|
||
| Insurance | 1 | $21B |
|
||
| Industrial Technology | 1 | $17B |
|
||
| Retail | 1 | $16B |
|
||
| Industrial Distribution | 1 | $10B |
|
||
| Utilities | 1 | $9B |
|
||
Price history
2 events — show timeline
- 2026-06-18 Listed $215,000 LOBR
- 2024-10-17 Sold (Public Records) — Public Records
Property tax history
+1.0%/yrLatest (2025): $763 · +8.8% YoY. Source: county tax records.
Cash-flow waterfall
monthlySold comps — $/sqft
last 12 mo · ≤1 miLoading sold comps…