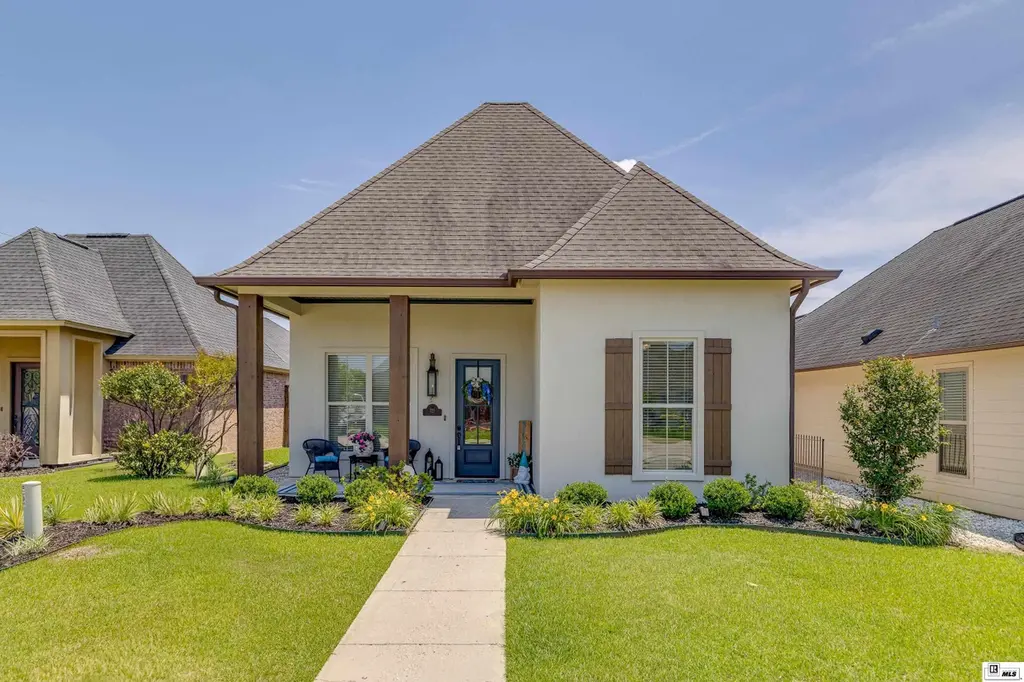
721 Providence Park · Sterlington, LA
Flood risk 1/10 · Minimal
- FEMA flood zone
- X (shaded)
- Chance of flooding over 30 yrs
- 0.0%
- Est. flood insurance / yr
- $507 – $1,088
Fire risk 1/10 · Minimal
- Est. fire insurance / yr
- $1,269 – $2,357
Heat risk 8/10 · Major
- Hot days now (above 111°F)
- 7 days/yr
- Hot days in 30 yrs
- 21 days/yr
Wind risk 8/10 · Major
- Chance of severe wind over 30 yrs
- 80.0%
Air-quality risk 1/10 · Minimal
- Unhealthy air days now
- 0 days/yr
- Unhealthy air days in 30 yrs
- 0 days/yr
Risk factors via First Street. Map © Google.
Why this score? — see what drove the D- grade
The composite is a weighted blend of 9 inputs, each scored 0–100. Each bar is that input's sub-score; the figure is the points it added to the 100-point composite (weight × sub-score).
- Appreciation +10.0/10.0
- Cash flow +7.4/30.0
- ARV discount +4.1/15.0
- Livability +3.5/5.0
- Schools +3.2/10.0
- Rent growth +2.5/5.0
- Condition / age +2.5/5.0
- 1% rule +1.8/10.0
- DSCR +1.5/10.0
$275,000
🖨 Deal sheet (PDF) 📄 Offer letter ✓ Due diligence
Listing remarks
Stunning home with upscale finishes throughout! Features include an open floor plan, soaring ceilings, exposed wood accent ceilings, and a gorgeous kitchen with granite countertops, gas range, large island, and custom vent hood. The spacious primary suite offers a spa-like bath with dual vanities, soaking tub, separate shower, and oversized walk-in closet. Beautifully maintained with manicured landscaping and incredible curb appeal.
Key facts
- 5,662 sq ft lot
- 2 garage spots
- Built 2016
Property features AI
Finance
- Other: Subdivision: STERLING FIELDS; Directions available: Hwy 165 N to right on Lenox Bridge, left on Providence Park Dr., property on right
- HOA & community: Homeowners association present (association amenities listed as other)
Exterior
- Parking: Attached garage with 2 spaces; Open parking available
- Security: Smoke detectors
- Utilities: Public water; Public sewer; Natural gas available and connected; Electric service
- Home design: Single-family residence; Site-built property; One level; Entry at grade
- Construction: Brick veneer and stucco exterior; Slab foundation; Built as one-story
- Exterior features: Covered patio/porch; Wood fencing; Landscaped and cleared yard; Paved road access
Interior
- Kitchen: Dishwasher; Disposal; Gas range
- Bedrooms: 3 bedrooms on the main level
- Bathrooms: 2 full bathrooms on the main level
- Heating & cooling: Central electric heating; Central air conditioning; Ceiling fans
- Interior features: Ceiling fans; Walk-in closets; Double pane windows; Dishwasher, Disposal, Gas Range
Neighborhood map
What this means for you Summary
Snapshot
- This is a 3-bed/2.0-bath single-family listed at $275k.
Deal economics
- At list price, monthly cash flow is $-356 ($-4k/yr) — negative.
- To cash-flow at today's rent, offer at most $212k (22.9% below list).
- To meet the 1% rule (rent ≥ 1% of price), the offer needs to be $188k (31.5% below list).
- Recommended offer: $188k (31.5% below list) — sets the bar for 1% rule.
Location & tenants
- Location reads 70/100 on livability (#60 in LA) — a middle-class / working-renter tenant base. Strengths: cost of living A+, housing A+, crime B+; Watch: health & safety D, amenities F, commute F.
- Ouachita Parish (suburban): math 31% / reading 45% proficiency, ranked #26 of 98 in LA (top 26%) — families likely to look elsewhere, expect single-tenant / working-renter base with shorter leases.
- Zoned schools: Sterlington Elementary School (math 56% / reading 65%, grade B-, #62 of 646 statewide, top 10%, 820 students, 45% FRL); Sterlington Middle School (math 50% / reading 58%, grade B-, #19 of 218 statewide, top 9%, 423 students, 48% FRL); Sterlington High School (math 42% / reading 47%, grade F, #58 of 265 statewide, top 23%, 539 students, 41% FRL).
- Zoned-school proficiency averages 53% at this address vs 38% district-wide (+15 pts) — the actual schools serving this property are materially stronger than the Ouachita Parish average implies; a family-tenant draw the district grade alone would hide.
- Market conditions: 189 active listings in the ZIP; 2 comparable units currently listed for rent nearby; 345 units permitted in Ouachita Parish in 2024 (0 in 5+ unit buildings).
Forward outlook
- In year one you build about $29k of equity ($2k loan paydown + $28k appreciation (10.0% local appreciation)).
- By year 2, paydown + projected appreciation supports a ~$47k cash-out refi (75% LTV) — recoverable capital for the next deal without selling this one.
Negotiation context
- Only 11 days on market — expect competitive offers; lowballing is unlikely to land.
- 2 sale attempts since 3y ago with the ask held roughly flat each time — persistent listings suggest the price (not the market) is what's stuck; bring a comps-based counter.
Risks & watch-outs
- Climate carrying-cost: severe wind risk, 80% chance of damaging wind over 30y; extreme-heat days projected 7→21/yr by 2055 (HVAC capex compounding) — expect insurance premiums to compound above CPI over the hold.
Questions for the listing agent
- What do current leases actually rent for vs. the listed asking? Can we see a recent rent roll and the last 12 months of T-12 income?
- Is there a deadline driving the sale (1031 exchange, divorce, estate, relocation)? That informs how much negotiation room exists.
- Schools are A-rated — typically a magnet for longer-tenancy family renters. What's the average tenant stay here, and is there a school-zone premium baked into asking?
- The area grade is low — what's the realistic commute time and amenity access for the typical tenant pool here? Any planned neighborhood developments (good or bad) we should know about?
- What's the average days-on-market for RENTAL listings here right now (not sales)? A rising rental-DOM trend means longer vacancies and softer asking-rent achievability than the comps imply.
- What's the recent tenant-quality profile in this submarket — average credit score on applications, eviction rate, late-payment / NSF rate, and stable-employment percentage? A property-management company in the area should have these aggregated.
- How much new for-sale + rental construction is in the pipeline within 1–3 miles? Heavy new supply typically softens prices + rents 12–24 months out; constrained supply supports both.
Investment metrics
- 1% rule
- 0.68% ✗
- Cap rate
- 4.74%
- Cash-on-cash
- -5.55%
- DSCR
- 0.75
- GRM
- 12.2
CMA / ARV
- ARV (on-the-fly)
- $255,696
- Comps found
- 4
Show comp detail 4 sales within ~0.75 mi
| Address | Dist | Beds/Ba | Sqft | Sold | Price | $/sf | Match |
|---|---|---|---|---|---|---|---|
| 123 Providence Park | 0.10mi | 3/2.0 | 1,614 (+6%) | 4mo | $243,650 | $151 | 82 |
| 722 Providence Park | 0.03mi | 3/2.0 | 1,728 (+14%) | 11mo | $274,900 | $159 | 67 |
| 604 Providence Park | 0.12mi | 3/2.0 | 1,637 (+8%) | 23mo | $279,900 | $171 | 62 |
| 116 Providence Park | 0.12mi | 3/2.0 | 1,730 (+14%) | 12mo | $290,000 | $168 | 62 |
Match score weights: distance 35% · size 25% · config 20% · recency 20%. Top-matched comps best support the ARV.
Projected returns pro-forma
10.0% appreciation · 3.0% rent growth · sell at horizon
- IRR
- 20.3%
- Equity multiple
- 2.65×
- Total profit
- $127,083
- Equity at exit
- $247,742
- IRR
- 18.6%
- Equity multiple
- 6.09×
- Total profit
- $392,063
- Equity at exit
- $534,265
Cash invested: $77,000 (down + closing). Projections, not guarantees.
Landlord ↔ Tenant lean methodology
- Overall (STATE)
- 90 Strongly Landlord-Friendly
- State Louisiana
- 90 Strongly Landlord-Friendly · R+12
- County
- — inherits STATE
- City
- — inherits STATE
ZIP-level market 71280
- Home prices YoY
- 4.1%
- Active inventory
- 189
- Price-to-rent
- 12.2×
Monthly cashflow live
- Estimated rent
- $1,883 medium interval (Pro) →
- Mortgage (P&I)
- −$1,442
- Tax from tax record
- −$287 /mo · $3,444/yr
- Insurance
- −$115
- HOA
- −$0
- Vacancy / Maint / Mgmt
- −$395
- Net cashflow
- $-356
Break-even live
Sensitivity live
| Price | -10% $-200 | -5% $-278 | +0% $-356 | +5% $-434 | +10% $-512 |
|---|---|---|---|---|---|
| Rent | -10% $-505 | -5% $-431 | +0% $-356 | +5% $-282 | +10% $-207 |
| Rate | -1.0pp $-218 | -0.5pp $-286 | base $-356 | +0.5pp $-427 | +1.0pp $-500 |
UW: 25.0% down · 7.5% · 30yr · 1.5% tax · 5.0% vac · 8.0% maint · 8.0% mgmt
Financing live
Cash to close
- Down payment
- $68,750
- Closing costs
- $8,250
- Reserves months
- —
- Total cash needed
- —
Loan-product check · same deal, 3 products live
Conventional
25% down · 7.5% · 30yr
- Down + closing
- —
- Monthly P&I
- —
- Monthly cashflow
- —
- DSCR
- —
- Eligible?
- —
Personal DTI + credit; lowest rate.
DSCR
20% down · 8.5% · 30yr
- Down + closing
- —
- Monthly P&I
- —
- Monthly cashflow
- —
- DSCR
- —
- Eligible?
- —
No personal income docs; deal must DSCR.
Hard money
10% down · 12.0% · 12mo
- Down + closing
- —
- Monthly P&I
- —
- Monthly cashflow
- —
- DSCR
- —
- Eligible?
- —
Short-term bridge; refi at stabilization.
Rent comps 2 comps
| Address | Beds | Baths | Sqft | Rent | $/sqft | DOM | Units | Dist |
|---|---|---|---|---|---|---|---|---|
| 492 Cliff Bullock Dr Sterlington, LA | 3.0 | 2.0 | 1500 | $2,495 | $1.66 | 45d | 1 | 0.50mi |
| 2120 Old Sterlington Rd Unit 4 Sterlington, LA | 2.0 | 2.0 | 1050 | $925 | $0.88 | 22d | 1 | 0.54mi |
Listing history 10 events
-
2026-06-13statusdays on market $275,000 Pending 11 DOM
-
2026-06-10days on market $275,000 Active 9 DOM
-
2026-06-09days on market $275,000 Active 8 DOM
-
2026-06-08days on market $275,000 Active 7 DOM
-
2026-06-07days on market $275,000 Active 6 DOM
-
2026-06-03days on market $275,000 Active 2 DOM
-
2026-06-01status $275,000 Active 1 DOM
-
2026-05-21status Pending
-
2026-05-21$275,000 Active
-
2023-08-18$260,000 Active
ⓘ Source: listings_history table (triggers on properties + properties_extension) + one-shot
backfill from property_details.listing_events for pre-trigger history.
Tax reassessment forecast LA · Resets to sale price
- Current annual tax
- $3,444 · $287/mo
- Projected year-2 tax
- $3,444 · $287/mo
- Expected delta
- $0/yr ($0/mo · 0.0%)
ⓘ Screening estimate from a state-policy table — verify with the county assessor before closing.
Climate risk First Street
- Flood 1/10 Low FEMA zone X (shaded) · 0% chance over 30 yrs
- Wildfire 1/10 Low
- Heat 8/10 Severe 7 d/yr ≥111°F today · 21 d/yr by 30 yrs out
- Wind 8/10 Severe 80% chance of damaging wind over 30 yrs
- Air quality 1/10 Low 0 unhealthy d/yr today · 0 by 30 yrs out
Nearby sold comps map
Loading sold comps map…
Walkable amenities ~0.75 mi
Loading nearby amenities…
Taxation est. · year 1
- Rental income
- $22,596
- − Mortgage interest
- −$15,404
- − Property taxes
- −$3,444
- − Insurance
- −$1,375
- − Repairs & maintenance
- −$1,808
- − Management
- −$1,808
- − Depreciation
- −$8,000
- Taxable loss
- −$9,243
- Est. tax savings @ 24.0%
- +$2,218
- After-tax cash flow
- $-2,055/yr
For passive investors: Depreciation is non-cash, so a rental often shows a tax loss while cash-flowing — sheltering income. Rental losses are passive: they offset passive income freely, and up to $25,000/yr can offset ordinary (W-2) income if you actively participate and your MAGI is under $100k (phasing out to $0 by $150k); unused losses carry forward. On sale, claimed depreciation is recaptured at up to 25%, and gains may owe capital-gains tax (a 1031 exchange can defer both). Figures are a year-1 estimate at your 24.0% rate — not tax advice; consult a CPA.
Schools (NCES district)
- District
- Ouachita Parish
- NCES district ID
- 2201200
- Math proficiency
- 31% ▼ -38.00%
- Reading proficiency
- 45% ▼ -31.00%
- Median HH income
- $43,316
- Composite
- 32.14/100
- National rank
- #5791
- State rank
- #26 of 98 in LA
Livability — Sterlington
- Score
- 70/100
- State rank
- #60
- US rank
- #7741
Category grades
Schools grade is shown separately in the Schools card above.
Census & demographics
- Census place
- Sterlington, LA
- Population (ZIP)
- 4,999
Population outlook (Ouachita County) Hauer SSP2
- Today (2025)
- 163,370 people
- By 2030
- 165,520 · +1.3%
- By 2040
- 167,652 · +2.6%
- By 2050
- 166,699 · +2.0%
- By 2075
- 156,348 · -4.3%
- By 2100
- 134,102 · -17.9%
Race, ethnicity, and origin ACS 2023
- Neighborhood character
- Predominantly White (74%)
- Race & ethnicity
- White 74% Black 21% Hispanic / Latino 4%
- Common ancestry
- Lithuanian 4% Iranian 2% Danish 1%
- Foreign-born
- 3% · Canada, Jamaica
- Languages at home
- 98% English-only · Spanish 2%
Political lean MEDSL · Ouachita
- 2024 margin
- Strong R (+27.9) · D 35.5% · R 63.3% · Other 1.2%
- 2008→2024 swing
- -2.7pp toward R · 2008: -25.2pp · 2024: -27.9pp
- All cycles
- 2024: R+27.9 2020: R+23.6 2016: R+25.4 2012: R+20.9 2008: R+25.2
Not yet ingested
- Civics
- —
Market trends
- HPI YoY
- ▲ 11.14%
- Current HPI
- 283.4492
- Rent YoY
- —
- Metro
- —
- State GDP YoY
- ▲ 3.29%
- F500 in state
- 10
Industry mix (Fortune 500 HQ in LA)
| Industry | F500 HQs | Revenue |
|---|---|---|
| Telecommunications | 2 | $23B |
|
||
| Utilities | 1 | $12B |
|
||
| Wholesale / Distribution | 1 | $5B |
|
||
| Advertising | 1 | $2B |
|
||
Price history
+5.8% since first listed3 events — show timeline
- 2026-05-21 Pending — NELABOR
- 2026-05-21 Listed $275,000 NELABOR
- 2023-08-18 Listed $260,000 NELABOR
Property tax history
+1.9%/yrLatest (2025): $3,444 · -0.7% YoY. Source: county tax records.
Cash-flow waterfall
monthlySold comps — $/sqft
last 12 mo · ≤1 miLoading sold comps…