2878 Westeros St · Corpus Christi, TX
Flood risk No data
- FEMA flood zone
- —
- Chance of flooding over 30 yrs
- —
- Est. flood insurance / yr
- —
Fire risk No data
- Est. fire insurance / yr
- —
Heat risk No data
- Hot days now (above threshold)
- —
- Hot days in 30 yrs
- —
Wind risk No data
- Chance of severe wind over 30 yrs
- —
Air-quality risk No data
- Unhealthy air days now
- —
- Unhealthy air days in 30 yrs
- —
Risk factors via First Street. Map © Google.
Why this score? — see what drove the D grade
The composite is a weighted blend of 9 inputs, each scored 0–100. Each bar is that input's sub-score; the figure is the points it added to the 100-point composite (weight × sub-score).
- Cash flow +10.8/30.0
- ARV discount +9.1/15.0
- Schools +6.1/10.0
- Condition / age +4.0/5.0
- Livability +3.9/5.0
- 1% rule +3.2/10.0
- DSCR +3.1/10.0
- Rent growth +3.1/5.0
- Appreciation +0.0/10.0
$278,999
🖨 Deal sheet (PDF) 📄 Offer letter ✓ Due diligence
Listing remarks
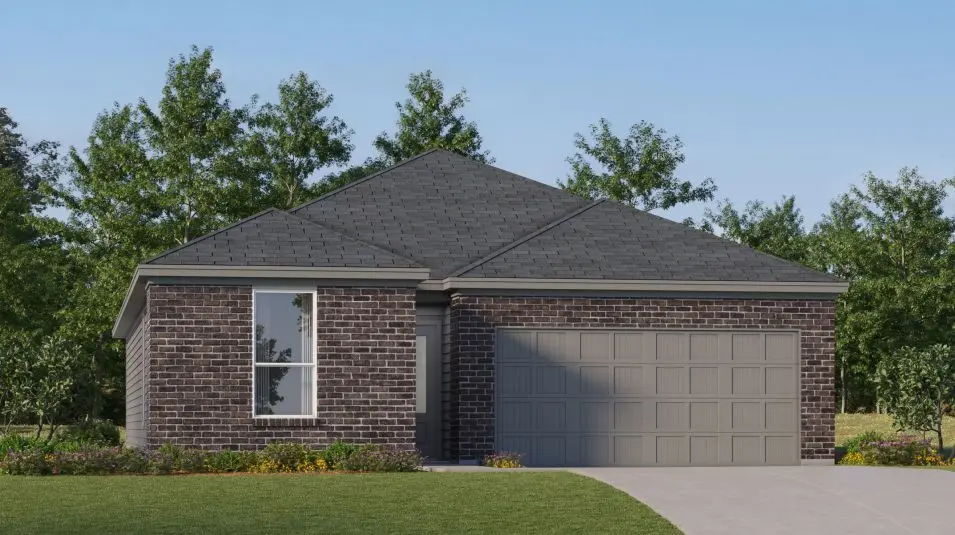
This new single-level home provides ample space to live and grow. An open-concept floorplan combines the kitchen, dining area and family room, with convenient access to a covered patio for seamless entertaining and relaxation. Two secondary bedrooms can be found off the foyer, and the luxe owner's suite is tucked away into a private corner at the back of the home, offering direct access to an en-suite bathroom and roomy walk-in closet.
Key facts
- Luxe owner's suite
- Covered patio
- En-suite bathroom
Tags
Property features AI
Finance
- Other: Virtual tour available
- Financial info: List price $291,999
Exterior
- Home design: Single-family home, Carmel plan; Active listing
- Construction: 1,634 living area (new construction spec)
- Exterior features: Located at 2878 Westeros St, Corpus Christi, TX 78415
Interior
- Bedrooms: 3 bedrooms
- Bathrooms: 2 full bathrooms
- Interior features: Spec new-construction Carmel plan
Neighborhood map
What this means for you Summary
Snapshot
- This is a 3-bed/2.0-bath single-family listed at $279k. Condition is rated good.
Deal economics
- At list price, monthly cash flow is $-125 ($-2k/yr) — negative.
- To cash-flow at today's rent, offer at most $261k (6.5% below list).
- To meet the 1% rule (rent ≥ 1% of price), the offer needs to be $228k (18.2% below list).
- Recommended offer: $228k (18.2% below list) — sets the bar for 1% rule.
- Cap rate 5.8% vs local median 3.6% in Corpus Christi — top-decile yield for the area; either an underpriced asset or a hidden risk that comps aren't pricing in. Stress-test before assuming the spread holds.
Location & tenants
- Location reads 78/100 on livability (#66 in TX, #2,404 nationally) — a middle-class / working-renter tenant base. Strengths: commute A+, cost of living A+, housing A+; Watch: crime F.
- London ISD (rural): math 65% / reading 62% proficiency, ranked #13 of 826 in TX (top 2%) — acceptable for families but not a draw, mixed tenant base, ~2y average lease; only 19% free/reduced lunch — higher-income household profile.
- Zoned schools: London El (346 students, 20% FRL); London Middle (math 70% / reading 63%, grade A-, #89 of 1,662 statewide, top 5%, 393 students, 14% FRL); London H S (math 62% / reading 77%, grade B, #119 of 1,632 statewide, top 9%, 507 students, 18% FRL) — zoned schools at 17% FRL track the district average.
- Market conditions: Rents rising (+2.3%/yr); 434 active listings in the ZIP; 10 comparable units currently listed for rent nearby; rentals at typical pace (median 16d on market — plan ~3-4 weeks tenant-placement turnaround); 1,397 units permitted in Nueces County in 2024 (47 in 5+ unit buildings).
- At $2,282/mo this rent would consume 50% of the median local household income ($55k/yr) (locally 1730% of renters already pay >50% of income on rent) — very limited rent-growth headroom before tenants either downsize or default.
Forward outlook
- Local home prices are declining (-3.0%/yr); year-one equity from $2k of loan paydown is wiped out by about $8k of value loss. Plan a longer hold.
- Nueces County population projected at +36% by 2050 — long-run rental-demand tailwind backs the buy-and-hold thesis.
Negotiation context
- It's been on market 32 days — a 3% lower offer ($271k) is reasonable based on typical stale-listing flexibility.
Questions for the listing agent
- What do current leases actually rent for vs. the listed asking? Can we see a recent rent roll and the last 12 months of T-12 income?
- It's been on market 32 days. Have you received any prior offers? Is the seller open to a 18% concession, seller financing, or rate buy-down credit?
- Is there a deadline driving the sale (1031 exchange, divorce, estate, relocation)? That informs how much negotiation room exists.
- Crime grade is F in this area — have there been break-ins, vandalism, or insurance claims at this property in the last 3 years? What carrier currently insures it and at what premium?
- The area grade is low — what's the realistic commute time and amenity access for the typical tenant pool here? Any planned neighborhood developments (good or bad) we should know about?
- What's the average days-on-market for RENTAL listings here right now (not sales)? A rising rental-DOM trend means longer vacancies and softer asking-rent achievability than the comps imply.
- What's the recent tenant-quality profile in this submarket — average credit score on applications, eviction rate, late-payment / NSF rate, and stable-employment percentage? A property-management company in the area should have these aggregated.
- How much new for-sale + rental construction is in the pipeline within 1–3 miles? Heavy new supply typically softens prices + rents 12–24 months out; constrained supply supports both.
Investment metrics
- 1% rule
- 0.82% ✗
- Cap rate
- 5.75%
- Cash-on-cash
- -1.93%
- DSCR
- 0.91
- GRM
- 10.2
CMA / ARV
- ARV (on-the-fly)
- $289,218
- Comps found
- 12
Show comp detail 12 sales within ~0.75 mi
| Address | Dist | Beds/Ba | Sqft | Sold | Price | $/sf | Match |
|---|---|---|---|---|---|---|---|
| 2766 Westeros St | 0.02mi | 4/2.0 (+1) | 1,667 (+2%) | 1mo | $267,999 | $161 | 90 |
| 1314 Lady Yoli St | 0.04mi | 4/2.0 (+1) | 1,667 (+2%) | 1mo | $254,999 | $153 | 89 |
| 2730 Westeros St | 0.10mi | 3/2.0 | 1,474 (-10%) | 1mo | $240,999 | $164 | 78 |
| 2606 Westeros St | 0.42mi | 3/2.0 | 1,595 (-2%) | 1mo | $329,990 | $207 | 76 |
| 2717 Eltonne Gardens Dr | 0.15mi | 4/2.0 (+1) | 1,761 (+8%) | 1mo | $265,100 | $151 | 74 |
| 1309 Connie Scott Dr | 0.25mi | 4/2.0 (+1) | 1,783 (+9%) | 1mo | $331,065 | $186 | 67 |
| 1281 Carnaby St | 0.47mi | 3/2.0 | 1,519 (-7%) | 1mo | $269,000 | $177 | 66 |
| 1339 Grey Worm Dr | 0.15mi | 4/2.0 (+1) | 1,850 (+13%) | 1mo | $268,999 | $145 | 65 |
| 2705 Eltonne Gardens Dr | 0.17mi | 4/2.0 (+1) | 1,855 (+14%) | 1mo | $280,000 | $151 | 64 |
| 2618 Westeros St | 0.38mi | 3/2.0 | 1,829 (+12%) | 1mo | $360,000 | $197 | 62 |
| 1258 Breebry Dr | 0.53mi | 3/2.0 | 1,484 (-9%) | 1mo | $265,000 | $179 | 59 |
| 1213 Breebry Dr | 0.65mi | 3/2.0 | 1,413 (-14%) | 1mo | $265,000 | $188 | 47 |
Match score weights: distance 35% · size 25% · config 20% · recency 20%. Top-matched comps best support the ARV.
Projected returns pro-forma
-3.0% appreciation · 2.32% rent growth · sell at horizon
- IRR
- -20.2%
- Equity multiple
- 0.30×
- Total profit
- $-54,718
- Equity at exit
- $41,600
- IRR
- -14.8%
- Equity multiple
- 0.18×
- Total profit
- $-64,075
- Equity at exit
- $24,123
Cash invested: $78,120 (down + closing). Projections, not guarantees.
Landlord ↔ Tenant lean methodology
- Overall (STATE)
- 87 Strongly Landlord-Friendly
- State Texas
- 87 Strongly Landlord-Friendly · R+5
- County
- — inherits STATE
- City
- — inherits STATE
ZIP-level market 78415
- Rents YoY
- 2.3%
- Active inventory
- 434
- Price-to-rent
- 10.2×
Monthly cashflow live
- Estimated rent
- $2,282 high interval (Pro) →
- Mortgage (P&I)
- −$1,463
- Tax est. 1.5%
- −$349 /mo · $4,185/yr
- Insurance
- −$116
- HOA
- −$0
- Vacancy / Maint / Mgmt
- −$479
- Net cashflow
- $-125
Break-even live
Sensitivity live
| Price | -10% $67 | -5% $-29 | +0% $-125 | +5% $-222 | +10% $-318 |
|---|---|---|---|---|---|
| Rent | -10% $-306 | -5% $-216 | +0% $-125 | +5% $-35 | +10% $55 |
| Rate | -1.0pp $15 | -0.5pp $-55 | base $-125 | +0.5pp $-198 | +1.0pp $-271 |
UW: 25.0% down · 7.5% · 30yr · 1.5% tax · 5.0% vac · 8.0% maint · 8.0% mgmt
Financing live
Cash to close
- Down payment
- $69,750
- Closing costs
- $8,370
- Reserves months
- —
- Total cash needed
- —
Loan-product check · same deal, 3 products live
Conventional
25% down · 7.5% · 30yr
- Down + closing
- —
- Monthly P&I
- —
- Monthly cashflow
- —
- DSCR
- —
- Eligible?
- —
Personal DTI + credit; lowest rate.
DSCR
20% down · 8.5% · 30yr
- Down + closing
- —
- Monthly P&I
- —
- Monthly cashflow
- —
- DSCR
- —
- Eligible?
- —
No personal income docs; deal must DSCR.
Hard money
10% down · 12.0% · 12mo
- Down + closing
- —
- Monthly P&I
- —
- Monthly cashflow
- —
- DSCR
- —
- Eligible?
- —
Short-term bridge; refi at stabilization.
Rent comps 10 comps
| Address | Beds | Baths | Sqft | Rent | $/sqft | DOM | Units | Dist |
|---|---|---|---|---|---|---|---|---|
| 2826 Westeros St Corpus Christi, TX | 4.0 | 3.0 | 2016 | $2,550 | $1.26 | 15d | 1 | 0.01mi |
| 2749 Eltonne Gardens Dr Corpus Christi, TX | 4.0 | 2.0 | 1894 | $2,295 | $1.21 | 15d | 1 | 0.11mi |
| 2741 Eltonne Gardens Dr Corpus Christi, TX | 4.0 | 2.0 | 1893 | $2,500 | $1.32 | 45d | 1 | 0.11mi |
| 2726 Winterfell St Corpus Christi, TX | 3.0 | 2.0 | 1217 | $1,900 | $1.56 | 15d | 1 | 0.17mi |
| 2714 Martell St Corpus Christi, TX | 3.0 | 2.0 | 1214 | $1,950 | $1.61 | 23d | 1 | 0.22mi |
| 2678 Lady Andrea Dr Corpus Christi, TX | 4.0 | 2.0 | 1780 | $3,000 | $1.69 | 15d | 1 | 0.39mi |
| 1269 Thames Chase Dr Corpus Christi, TX | 3.0 | 2.0 | 1585 | $2,350 | $1.48 | 15d | 1 | 0.47mi |
| 1258 Breebry Dr Corpus Christi, TX | 3.0 | 2.0 | 1484 | $2,195 | $1.48 | 15d | 1 | 0.53mi |
| 1405 Irigoyen Ct Corpus Christi, TX | 4.0 | 2.0 | 2065 | $2,800 | $1.36 | 15d | 1 | 0.56mi |
| 1205 Carnaby St Corpus Christi, TX | 4.0 | 2.0 | 1689 | $2,600 | $1.54 | 45d | 1 | 0.64mi |
Listing history 16 events
-
2026-06-21days on market $278,999 Active 32 DOM
-
2026-06-18days on market $278,999 Active 29 DOM
-
2026-06-17days on market $278,999 Active 28 DOM
-
2026-06-16pricedays on market $278,999 Active 27 DOM
-
2026-06-15days on market $275,999 Active 26 DOM
-
2026-06-14days on market $275,999 Active 24 DOM
-
2026-06-13days on market $275,999 Active 23 DOM
-
2026-06-10days on market $275,999 Active 21 DOM
-
2026-06-09days on market $275,999 Active 20 DOM
-
2026-06-08days on market $275,999 Active 19 DOM
-
2026-06-07pricedays on market $275,999 Active 18 DOM
-
2026-06-03days on market $276,999 Active 14 DOM
-
2026-06-02days on market $276,999 Active 13 DOM
-
2026-06-01days on market $276,999 Active 12 DOM
-
2026-05-31days on market $276,999 Active 11 DOM
-
2026-05-30days on market $276,999 Active 10 DOM
ⓘ Source: listings_history table (triggers on properties + properties_extension) + one-shot
backfill from property_details.listing_events for pre-trigger history.
Nearby sold comps map
Loading sold comps map…
Walkable amenities ~0.75 mi
Loading nearby amenities…
Taxation est. · year 1
- Rental income
- $27,382
- − Mortgage interest
- −$15,628
- − Property taxes
- −$4,185
- − Insurance
- −$1,395
- − Repairs & maintenance
- −$2,191
- − Management
- −$2,191
- − Depreciation
- −$8,116
- Taxable loss
- −$6,324
- Est. tax savings @ 24.0%
- +$1,518
- After-tax cash flow
- $12/yr
For passive investors: Depreciation is non-cash, so a rental often shows a tax loss while cash-flowing — sheltering income. Rental losses are passive: they offset passive income freely, and up to $25,000/yr can offset ordinary (W-2) income if you actively participate and your MAGI is under $100k (phasing out to $0 by $150k); unused losses carry forward. On sale, claimed depreciation is recaptured at up to 25%, and gains may owe capital-gains tax (a 1031 exchange can defer both). Figures are a year-1 estimate at your 24.0% rate — not tax advice; consult a CPA.
Condition & rehab AI · 12 photos
This single-level home offers a good condition with a modern and open-concept floor plan, suitable for both resale and rental purposes. Minor cosmetic updates can further enhance its curb appeal and value.
Value-add opportunities
- Both Painting the exterior brick — Enhances curb appeal and can increase both resale and rental value
- Both Landscaping improvements — Enhances curb appeal and can increase both resale and rental value
Renovation cost estimate screening
Value-add ROI direction
- Both Painting the exterior brick — Enhances curb appeal and can increase both resale and rental value ↑
- Both Landscaping improvements — Enhances curb appeal and can increase both resale and rental value ↑
ⓘ Cost ranges are severity-bucket heuristics (US national rule-of-thumb). Get contractor quotes + a written scope before underwriting a rehab budget.
Schools (NCES district)
- District
- London ISD
- NCES district ID
- 4827990
- Math proficiency
- 65% ▬ 0.00%
- Reading proficiency
- 62% ▬ 0.00%
- Median HH income
- $123,503
- Composite
- 61.03/100
- National rank
- #796
- State rank
- #13 of 826 in TX
Livability — Corpus Christi
- Score
- 78/100
- State rank
- #66
- US rank
- #2404
Category grades
Schools grade is shown separately in the Schools card above.
Census & demographics
- Census place
- Corpus Christi, TX
- County
- Nueces County · 296,836 people
- City population
- 296,836
- Metro
- Corpus Christi, TX
- Population (ZIP)
- 43,080
- Household income
- $54,990
- Rent vs Own
- Severe rent burden
- 1730.0
Population outlook (Nueces County) Hauer SSP2
- Today (2025)
- 418,037 people
- By 2030
- 447,123 · +7.0%
- By 2040
- 505,911 · +21.0%
- By 2050
- 567,522 · +35.8%
- By 2075
- 729,686 · +74.6%
- By 2100
- 847,087 · +102.6%
Race, ethnicity, and origin ACS 2023
- Neighborhood character
- Predominantly Hispanic (83%)
- Race & ethnicity
- Hispanic / Latino 83% Two or more races 41% White 12% Black 3%
- Hispanic origin (detail)
- Mexican 75%
- Foreign-born
- 9% · Canada
- Languages at home
- 59% English-only · Spanish 40%
Political lean MEDSL · Nueces
- 2024 margin
- R (+11.5) · D 43.8% · R 55.3%
- 2008→2024 swing
- -7.1pp toward R · 2008: -4.4pp · 2024: -11.5pp
- All cycles
- 2024: R+11.5 2020: R+2.9 2016: R+1.5 2012: R+3.2 2008: R+4.4
Not yet ingested
- Civics
- —
Market trends
- HPI YoY
- ▼ -173.20%
- Current HPI
- 158.011
- Rent YoY
- ▲ 2.32%
- Metro
- Corpus Christi, TX
- State GDP YoY
- ▲ 3.95%
- F500 in state
- 110
Industry mix (Fortune 500 HQ in TX)
| Industry | F500 HQs | Revenue |
|---|---|---|
| Energy | 16 | $1,198B |
|
||
| Technology | 5 | $198B |
|
||
| Engineering / Construction | 4 | $72B |
|
||
| Energy Services | 3 | $60B |
|
||
| Utilities | 3 | $41B |
|
||
| Healthcare | 2 | $330B |
|
||
Cash-flow waterfall
monthlySold comps — $/sqft
last 12 mo · ≤1 miLoading sold comps…