116 Nashua · Lehigh, PA
Flood risk 1/10 · Minimal
- FEMA flood zone
- X (unshaded)
- Chance of flooding over 30 yrs
- 0.0%
- Est. flood insurance / yr
- $473 – $860
Fire risk 3/10 · Minor
- Est. fire insurance / yr
- $511 – $949
Heat risk 4/10 · Minor
- Hot days now (above 97°F)
- 7 days/yr
- Hot days in 30 yrs
- 15 days/yr
Wind risk 4/10 · Minor
- Chance of severe wind over 30 yrs
- 15.0%
Air-quality risk 2/10 · Minimal
- Unhealthy air days now
- 1 days/yr
- Unhealthy air days in 30 yrs
- 2 days/yr
Risk factors via First Street. Map © Google.
Why this score? — see what drove the B+ grade
The composite is a weighted blend of 9 inputs, each scored 0–100. Each bar is that input's sub-score; the figure is the points it added to the 100-point composite (weight × sub-score).
- Cash flow +30.0/30.0
- ARV discount +15.0/15.0
- 1% rule +10.0/10.0
- DSCR +10.0/10.0
- Schools +4.4/10.0
- Rent growth +2.5/5.0
- Livability +2.5/5.0
- Condition / age +2.5/5.0
- Appreciation +0.0/10.0
$75,500
🖨 Deal sheet 📄 Offer letter ✓ Due diligence
Listing remarks
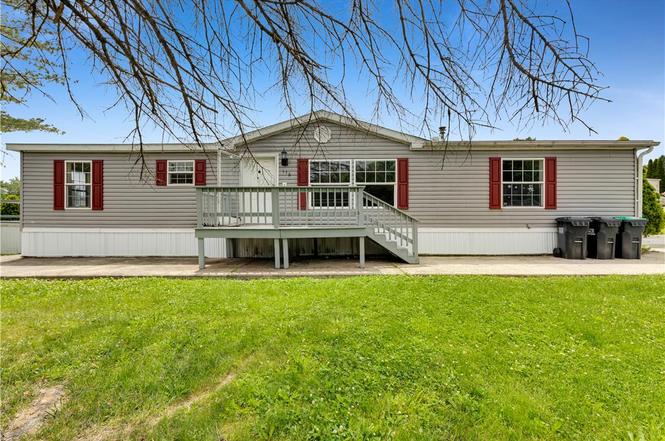
Don't miss this value-packed opportunity in Lehigh Township! This 3-bedroom, 3-bath manufactured home offers generous living space and endless possibilities. With some TLC and updates, this home can truly shine. Conveniently located within a mobile home community and priced to reflect needed improvements, this is an excellent chance for buyers looking for affordability, sweat equity, and the opportunity to create a space of their own.
Key facts
- 2 garage spots
- Built 2003
- Listed 8 days
Property features AI
Finance
- HOA & community: Monthly association fee
Exterior
- Parking: Attached garage with 2 spaces; Parking pad
- Utilities: 100 amp electric service; Community/Coop water; Public sewer
- Home design: Single-story home
- Construction: Aluminum siding; Asphalt/fiberglass roof
- Exterior features: Deck; Covered porch; Shed(s); Leased propane tank; Zoned Ra - Rural Agriculture
Interior
- Kitchen: Gas oven and gas range; Refrigerator; Eat-in layout with kitchen island
- Bedrooms: Two bedrooms on the first floor (each about 14 x 12)
- Bathrooms: Two full bathrooms and one half bath (half bath on the first floor)
- Heating & cooling: Propane heating; Central air conditioning; Ceiling fans
- Interior features: Skylights; Eat-in kitchen; Kitchen island; Living room fireplace
- Laundry & utility: First-floor laundry room (approx. 8 x 6)
Neighborhood map
What this means for you Summary
Snapshot
- This is a 3-bed/2.0-bath manufactured listed at $76k.
Deal economics
- At list price, monthly cash flow is $891 ($11k/yr) — positive.
- The deal already cash-flows at list — no discount required.
- Meets the 1% rule at list price ($2k rent vs $76k).
Location & tenants
- Location reads: area grade B — affects rentability + tenant quality, not the cash-flow math above.
- Northampton Area SD (suburban): math 47% / reading 54% proficiency, ranked #153 of 539 in PA (top 28%) — acceptable for families but not a draw, mixed tenant base, ~2y average lease.
- Market conditions: 43 active listings in the ZIP; 567 units permitted in Northampton County in 2024 (151 in 5+ unit buildings).
Forward outlook
- Local home prices are declining (-3.0%/yr); year-one equity from $522 of loan paydown is wiped out by about $2k of value loss. Plan a longer hold.
- At projected returns (-3.0% appreciation + 3.0% rent growth), your $21k cash investment doubles in ~3 years — after that, you're playing with house money.
Negotiation context
- Only 8 days on market — expect competitive offers; lowballing is unlikely to land.
- 12 sale attempts since 19y ago with the ask held roughly flat each time — persistent listings suggest the price (not the market) is what's stuck; bring a comps-based counter.
- Current owner paid $44k; list at $76k implies a 72% gain — meaningful room to come down on a strong offer.
Risks & watch-outs
- Watch-outs: property tax is 3.1% of price.
Questions for the listing agent
- Property tax is high relative to price — has the assessment been appealed recently, and will the sale trigger a re-assessment?
- Is there a deadline driving the sale (1031 exchange, divorce, estate, relocation)? That informs how much negotiation room exists.
- What's the average days-on-market for RENTAL listings here right now (not sales)? A rising rental-DOM trend means longer vacancies and softer asking-rent achievability than the comps imply.
- What's the recent tenant-quality profile in this submarket — average credit score on applications, eviction rate, late-payment / NSF rate, and stable-employment percentage? A property-management company in the area should have these aggregated.
- How much new for-sale + rental construction is in the pipeline within 1–3 miles? Heavy new supply typically softens prices + rents 12–24 months out; constrained supply supports both.
Investment metrics
- 1% rule
- 2.54% ✓
- Cap rate
- 20.46%
- Cash-on-cash
- 50.58%
- DSCR
- 3.25
- GRM
- 3.3
CMA / ARV
- ARV (on-the-fly)
- $106,624
- Comps found
- 6
Show comp detail 6 sales within ~0.75 mi
| Address | Dist | Beds/Ba | Sqft | Sold | Price | $/sf | Match |
|---|---|---|---|---|---|---|---|
| 32B Derose St | 0.06mi | 3/2.0 | 1,512 (-4%) | 3mo | $92,000 | $61 | 89 |
| 32 Derose St | 0.07mi | 3/2.0 | 1,512 (-4%) | 3mo | $92,000 | $61 | 88 |
| 52 W Zimmer Dr | 0.04mi | 3/2.0 | 1,440 (-8%) | 3mo | $68,000 | $47 | 82 |
| 119 Duke St | 0.09mi | 3/2.0 | 1,680 (+7%) | 13mo | $143,000 | $85 | 73 |
| 19 E Zimmer Dr | 0.04mi | 3/2.0 | 1,344 (-14%) | 10mo | $133,000 | $99 | 66 |
| 4231 Independence Ln | 0.61mi | 3/2.0 | 1,620 (+3%) | 8mo | $110,000 | $68 | 59 |
Match score weights: distance 35% · size 25% · config 20% · recency 20%. Top-matched comps best support the ARV.
Projected returns pro-forma
-3.0% appreciation · 3.0% rent growth · sell at horizon
- IRR
- 48.4%
- Equity multiple
- 3.11×
- Total profit
- $44,609
- Equity at exit
- $11,257
- IRR
- 54.0%
- Equity multiple
- 6.31×
- Total profit
- $112,289
- Equity at exit
- $6,528
Cash invested: $21,140 (down + closing). Projections, not guarantees.
Landlord ↔ Tenant lean methodology
- Overall (STATE)
- 62 Landlord-Friendly
- State Pennsylvania
- 62 Landlord-Friendly · EVEN
- County
- — inherits STATE
- City
- — inherits STATE
ZIP-level market 18088
- Active inventory
- 43
- Price-to-rent
- 3.3×
Monthly cashflow live
- Estimated rent
- $1,914 medium interval (Pro) →
- Mortgage (P&I)
- −$396
- Tax from tax record
- −$194 /mo · $2,327/yr
- Insurance
- −$31
- HOA
- −$0
- Vacancy / Maint / Mgmt
- −$402
- Net cashflow
- $891
Break-even live
UW: 25.0% down · 7.5% · 30yr · 1.5% tax · 5.0% vac · 8.0% maint · 8.0% mgmt
Financing live
Cash to close
- Down payment
- $18,875
- Closing costs
- $2,265
- Reserves months
- —
- Total cash needed
- —
Loan-product check · same deal, 3 products live
Conventional
25% down · 7.5% · 30yr
- Down + closing
- —
- Monthly P&I
- —
- Monthly cashflow
- —
- DSCR
- —
- Eligible?
- —
Personal DTI + credit; lowest rate.
DSCR
20% down · 8.5% · 30yr
- Down + closing
- —
- Monthly P&I
- —
- Monthly cashflow
- —
- DSCR
- —
- Eligible?
- —
No personal income docs; deal must DSCR.
Hard money
10% down · 12.0% · 12mo
- Down + closing
- —
- Monthly P&I
- —
- Monthly cashflow
- —
- DSCR
- —
- Eligible?
- —
Short-term bridge; refi at stabilization.
Listing history 6 events
-
2026-06-18days on market $75,500 Active 8 DOM
-
2026-06-17days on market $75,500 Active 7 DOM
-
2026-06-16days on market $75,500 Active 6 DOM
-
2026-06-15days on market $75,500 Active 5 DOM
-
2026-06-14remarks 438-char remark
-
2026-06-14$75,500 Active 3 DOM
ⓘ Source: listings_history table (triggers on properties + properties_extension) + one-shot
backfill from property_details.listing_events for pre-trigger history.
Tax reassessment forecast PA · Partial reset (capped growth)
- Current annual tax
- $2,327 · $194/mo
- Projected year-2 tax
- $2,327 · $194/mo
- Expected delta
- $0/yr ($0/mo · 0.0%)
ⓘ Screening estimate from a state-policy table — verify with the county assessor before closing.
Climate risk First Street
- Flood 1/10 Low FEMA zone X (unshaded) · 0% chance over 30 yrs
- Wildfire 3/10 Moderate
- Heat 4/10 Moderate 7 d/yr ≥97°F today · 15 d/yr by 30 yrs out
- Wind 4/10 Moderate 15% chance of damaging wind over 30 yrs
- Air quality 2/10 Low 1 unhealthy d/yr today · 2 by 30 yrs out
Nearby sold comps map
Loading sold comps map…
Walkable amenities ~0.75 mi
Loading nearby amenities…
Taxation est. · year 1
- Rental income
- $22,973
- − Mortgage interest
- −$4,229
- − Property taxes
- −$2,327
- − Insurance
- −$378
- − Repairs & maintenance
- −$1,838
- − Management
- −$1,838
- − Depreciation
- −$2,196
- Taxable income
- $10,167
- Est. tax owed @ 24.0%
- −$2,440
- After-tax cash flow
- $8,253/yr
For passive investors: Depreciation is non-cash, so a rental often shows a tax loss while cash-flowing — sheltering income. Rental losses are passive: they offset passive income freely, and up to $25,000/yr can offset ordinary (W-2) income if you actively participate and your MAGI is under $100k (phasing out to $0 by $150k); unused losses carry forward. On sale, claimed depreciation is recaptured at up to 25%, and gains may owe capital-gains tax (a 1031 exchange can defer both). Figures are a year-1 estimate at your 24.0% rate — not tax advice; consult a CPA.
Schools (NCES district)
- District
- Northampton Area SD
- NCES district ID
- 4217370
- Math proficiency
- 47% ▼ -1.00%
- Reading proficiency
- 54% ▼ -13.00%
- Median HH income
- $62,326
- Composite
- 44.35/100
- National rank
- #2822
- State rank
- #153 of 539 in PA
Livability — Lehigh
No livability data for this city. (Only ~50 U.S. cities are tracked.)
Census & demographics
- Population (ZIP)
- 8,162
Population outlook (Northampton County) Hauer SSP2
- Today (2025)
- 312,227 people
- By 2030
- 314,769 · +0.8%
- By 2040
- 316,914 · +1.5%
- By 2050
- 318,037 · +1.9%
- By 2075
- 334,003 · +7.0%
- By 2100
- 344,696 · +10.4%
Race, ethnicity, and origin ACS 2023
- Neighborhood character
- Predominantly White (89%)
- Race & ethnicity
- White 89% Two or more races 5% Hispanic / Latino 4% Black 2% Asian 1%
- Common ancestry
- Polish 7% Romanian 3% Danish 3%
- Foreign-born
- 2% · India, Canada
- Languages at home
- 96% English-only · Other Indo-European 2% Spanish 1%
Political lean MEDSL · Northampton
- 2024 margin
- Toss-up / Even · D 48.6% · R 50.4%
- 2008→2024 swing
- -14.1pp toward R · 2008: 12.3pp · 2024: -1.8pp
- All cycles
- 2024: R+1.8 2020: D+0.7 2016: R+3.8 2012: D+4.6 2008: D+12.3
Not yet ingested
- Civics
- —
Market trends
- HPI YoY
- ▼ -137.19%
- Current HPI
- 203.2109
- Rent YoY
- —
- Metro
- —
- State GDP YoY
- ▲ 1.68%
- F500 in state
- 34
Industry mix (Fortune 500 HQ in PA)
| Industry | F500 HQs | Revenue |
|---|---|---|
| Healthcare | 2 | $309B |
|
||
| Insurance | 2 | $27B |
|
||
| Telecommunications / Media | 1 | $124B |
|
||
| Industrial Distribution | 1 | $22B |
|
||
| Financial Services | 1 | $20B |
|
||
| Chemicals / Materials | 1 | $18B |
|
||
Price history
-13.1% since first listed26 events — show timeline
- 2026-06-10 Listed $75,500 GLVRMLS
- 2019-03-26 Listing Removed — GLVRMLS
- 2019-03-11 Pending — GLVRMLS
- 2019-02-14 Listed $37,000 GLVRMLS
- 2018-12-20 Listing Removed — GLVRMLS
- 2018-06-05 Price Changed $29,500 GLVRMLS
- 2018-04-09 Listed $33,000 GLVRMLS
- 2018-04-09 Listing Removed — GLVRMLS
- 2018-02-07 Price Changed $33,000 GLVRMLS
- 2017-11-12 Price Changed $37,000 GLVRMLS
- 2017-03-13 Listed $44,900 GLVRMLS
- 2014-06-06 Sold (MLS) $43,900 GLVRMLS
- 2014-02-19 Listed $49,500 GLVRMLS
- 2014-01-22 Listing Removed — GLVRMLS
- 2013-07-30 Listing Removed — GLVRMLS
- 2013-07-22 Listed $52,500 GLVRMLS
- 2013-07-22 Listed $52,500 GLVRMLS
- 2012-10-15 Listing Removed — GLVRMLS
- 2012-05-22 Listed $49,900 PMAR
- 2012-05-10 Listed $49,900 GLVRMLS
- 2012-03-02 Listing Removed — GLVRMLS
- 2011-10-07 Listed $57,000 GLVRMLS
- 2008-01-07 Listing Removed — GLVRMLS
- 2007-07-06 Listed $83,900 GLVRMLS
- 2007-06-20 Listing Removed — GLVRMLS
- 2007-03-19 Listed $86,900 GLVRMLS
Property tax history
+1.6%/yrLatest (2026): $2,327 · +4.4% YoY. Source: county tax records.
Cash-flow waterfall
monthlySold comps — $/sqft
last 12 mo · ≤1 miLoading sold comps…