301 Pr 67004 · Redwater, TX
Flood risk 1/10 · Minimal
- FEMA flood zone
- X (unshaded)
- Chance of flooding over 30 yrs
- 0.0%
- Est. flood insurance / yr
- $507 – $1,088
Fire risk 7/10 · Major
- Est. fire insurance / yr
- $1,222 – $2,270
Heat risk 7/10 · Major
- Hot days now (above 111°F)
- 7 days/yr
- Hot days in 30 yrs
- 23 days/yr
Wind risk 6/10 · Moderate
- Chance of severe wind over 30 yrs
- 27.0%
Air-quality risk 2/10 · Minimal
- Unhealthy air days now
- 1 days/yr
- Unhealthy air days in 30 yrs
- 1 days/yr
Risk factors via First Street. Map © Google.
Why this score? — see what drove the D grade
The composite is a weighted blend of 9 inputs, each scored 0–100. Each bar is that input's sub-score; the figure is the points it added to the 100-point composite (weight × sub-score).
- ARV discount +15.0/15.0
- Cash flow +6.6/30.0
- Appreciation +5.0/10.0
- Schools +4.6/10.0
- Livability +3.4/5.0
- Rent growth +2.5/5.0
- Condition / age +2.5/5.0
- DSCR +0.8/10.0
- 1% rule +0.5/10.0
$219,000
🖨 Deal sheet (PDF) 📄 Offer letter ✓ Due diligence
Listing remarks MLS
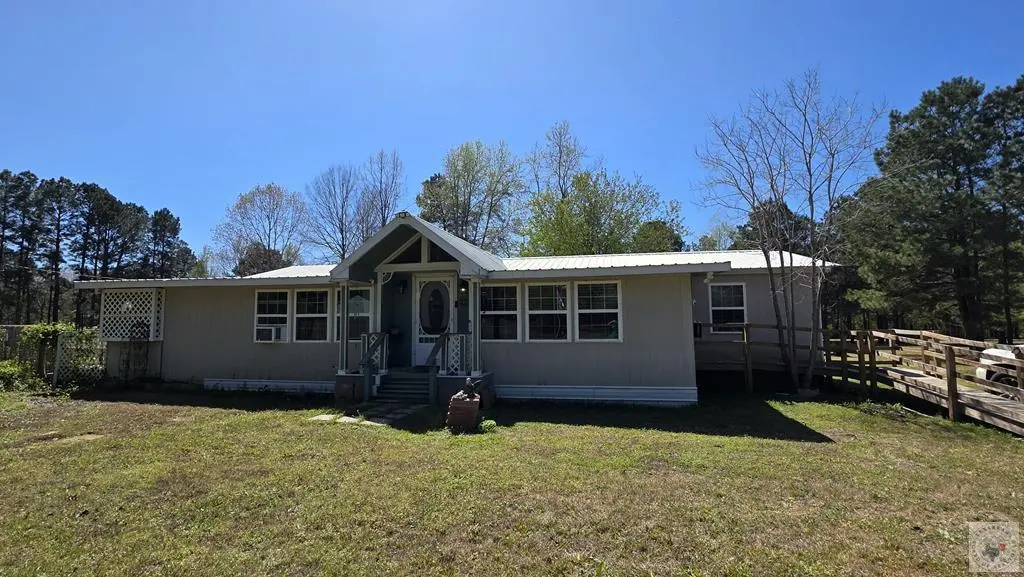
If you are looking for space to build and create at home - this one has it! This property has 1734 sq ft- including 3 bedrooms, 2 bathrooms, 2 living areas, and an additional area that can be used as an office, craft room, family room, or man cave. Outside, there is an RV awning with electricity, a large walk-in well house with water softener and cedar work bench, a full home generator, and 2 other storage buildings. There is a separate fenced area (that is perfect for pets) and a porch with a small screened-in area and pet door. Come check out the possibilities held in this home!
Key facts
- Separate fenced area
- Full home generator
- 1.25 acre lot
Tags
Neighborhood map
What this means for you Summary
Snapshot
- This is a 3-bed/2.0-bath manufactured listed at $219k.
Deal economics
- At list price, monthly cash flow is $-362 ($-4k/yr) — negative.
- To cash-flow at today's rent, offer at most $155k (29.2% below list).
- To meet the 1% rule (rent ≥ 1% of price), the offer needs to be $120k (45.0% below list).
- Recommended offer: $120k (45.0% below list) — sets the bar for 1% rule.
Location & tenants
- Location reads 68/100 on livability (#467 in TX) — a middle-class / working-renter tenant base. Strengths: cost of living A+, housing A, crime A-; Watch: amenities F, commute F, health & safety F.
- Redwater ISD (rural): math 58% / reading 48% proficiency, ranked #123 of 826 in TX (top 15%) — acceptable for families but not a draw, mixed tenant base, ~2y average lease.
- Zoned schools: Redwater El (math 42% / reading 47%, grade F, #1,155 of 4,322 statewide, top 29%, 313 students, 54% FRL); Redwater Int (math 55% / reading 34%, grade D, #491 of 1,662 statewide, top 31%, 227 students, 62% FRL); Redwater H S (math 77% / reading 67%, grade B+, #95 of 1,632 statewide, top 7%, 339 students, 44% FRL) — zoned schools average 53% FRL vs 36% district-wide (17 pts higher); higher-poverty schools than district average — tighter screening recommended.
- Market conditions: 40 active listings in the ZIP; 137 units permitted in Bowie County in 2024 (5 in 5+ unit buildings).
Forward outlook
- In year one you build about $8k of equity ($2k loan paydown + $7k appreciation (3.0% local appreciation)).
- By year 5, paydown + projected appreciation supports a ~$35k cash-out refi (75% LTV) — recoverable capital for the next deal without selling this one.
Negotiation context
- It's been on market 90 days — a 6% lower offer ($206k) is reasonable based on typical stale-listing flexibility.
Risks & watch-outs
- Climate carrying-cost: major wind risk, 27% chance of damaging wind over 30y; major wildfire risk; extreme-heat days projected 7→23/yr by 2055 (HVAC capex compounding) — expect insurance premiums to compound above CPI over the hold.
Questions for the listing agent
- What do current leases actually rent for vs. the listed asking? Can we see a recent rent roll and the last 12 months of T-12 income?
- It's been on market 90 days. Have you received any prior offers? Is the seller open to a 45% concession, seller financing, or rate buy-down credit?
- Why hasn't it sold? Are there any deal-killer items the seller is aware of (foundation, flood, title, zoning, code violations)?
- Is there a deadline driving the sale (1031 exchange, divorce, estate, relocation)? That informs how much negotiation room exists.
- The area grade is low — what's the realistic commute time and amenity access for the typical tenant pool here? Any planned neighborhood developments (good or bad) we should know about?
- What's the average days-on-market for RENTAL listings here right now (not sales)? A rising rental-DOM trend means longer vacancies and softer asking-rent achievability than the comps imply.
- What's the recent tenant-quality profile in this submarket — average credit score on applications, eviction rate, late-payment / NSF rate, and stable-employment percentage? A property-management company in the area should have these aggregated.
- How much new for-sale + rental construction is in the pipeline within 1–3 miles? Heavy new supply typically softens prices + rents 12–24 months out; constrained supply supports both.
Investment metrics
- 1% rule
- 0.55% ✗
- Cap rate
- 4.31%
- Cash-on-cash
- -7.09%
- DSCR
- 0.68
- GRM
- 15.2
CMA / ARV
- ARV (median comp)
- $275,061
- List price
- $219,000
- Delta
- -18.56%
- Verdict
- UNDERPRICED
- Comps
- 1 within 2.0 mi
Projected returns pro-forma
3.0% appreciation · 3.0% rent growth · sell at horizon
- IRR
- 0.9%
- Equity multiple
- 1.05×
- Total profit
- $3,215
- Equity at exit
- $98,472
- IRR
- 4.6%
- Equity multiple
- 1.71×
- Total profit
- $43,656
- Equity at exit
- $151,757
Cash invested: $61,320 (down + closing). Projections, not guarantees.
Landlord ↔ Tenant lean methodology
- Overall (STATE)
- 87 Strongly Landlord-Friendly
- State Texas
- 87 Strongly Landlord-Friendly · R+5
- County
- — inherits STATE
- City
- — inherits STATE
ZIP-level market 75567
- Active inventory
- 40
- Price-to-rent
- 15.2×
Monthly cashflow live
- Estimated rent
- $1,204 medium interval (Pro) →
- Mortgage (P&I)
- −$1,148
- Tax from tax record
- −$74 /mo · $886/yr
- Insurance
- −$91
- HOA
- −$0
- Vacancy / Maint / Mgmt
- −$253
- Net cashflow
- $-362
Break-even live
Sensitivity live
| Price | -10% $-238 | -5% $-300 | +0% $-362 | +5% $-424 | +10% $-486 |
|---|---|---|---|---|---|
| Rent | -10% $-457 | -5% $-410 | +0% $-362 | +5% $-315 | +10% $-267 |
| Rate | -1.0pp $-252 | -0.5pp $-306 | base $-362 | +0.5pp $-419 | +1.0pp $-477 |
UW: 25.0% down · 7.5% · 30yr · 1.5% tax · 5.0% vac · 8.0% maint · 8.0% mgmt
Financing live
Cash to close
- Down payment
- $54,750
- Closing costs
- $6,570
- Reserves months
- —
- Total cash needed
- —
Loan-product check · same deal, 3 products live
Conventional
25% down · 7.5% · 30yr
- Down + closing
- —
- Monthly P&I
- —
- Monthly cashflow
- —
- DSCR
- —
- Eligible?
- —
Personal DTI + credit; lowest rate.
DSCR
20% down · 8.5% · 30yr
- Down + closing
- —
- Monthly P&I
- —
- Monthly cashflow
- —
- DSCR
- —
- Eligible?
- —
No personal income docs; deal must DSCR.
Hard money
10% down · 12.0% · 12mo
- Down + closing
- —
- Monthly P&I
- —
- Monthly cashflow
- —
- DSCR
- —
- Eligible?
- —
Short-term bridge; refi at stabilization.
Listing history 17 events
-
2026-06-22pricedays on market $219,000 Active 90 DOM
-
2026-06-19days on market $224,000 Active 88 DOM
-
2026-06-18days on market $224,000 Active 87 DOM
-
2026-06-17days on market $224,000 Active 86 DOM
-
2026-06-16days on market $224,000 Active 85 DOM
-
2026-06-15days on market $224,000 Active 84 DOM
-
2026-06-14days on market $224,000 Active 82 DOM
-
2026-06-13days on market $224,000 Active 81 DOM
-
2026-06-10days on market $224,000 Active 79 DOM
-
2026-06-09days on market $224,000 Active 78 DOM
-
2026-06-08days on market $224,000 Active 77 DOM
-
2026-06-07days on market $224,000 Active 76 DOM
-
2026-06-02days on market $224,000 Active 71 DOM
-
2026-06-01days on market $224,000 Active 70 DOM
-
2026-05-31days on market $224,000 Active 69 DOM
-
2026-05-30days on market $224,000 Active 68 DOM
-
2026-03-19$224,000 Active 587-char remark
Show marketing remark (587 chars)
If you are looking for space to build and create at home - this one has it! This property has 1734 sq ft- including 3 bedrooms, 2 bathrooms, 2 living areas, and an additional area that can be used as an office, craft room, family room, or man cave. Outside, there is an RV awning with electricity, a large walk-in well house with water softener and cedar work bench, a full home generator, and 2 other storage buildings. There is a separate fenced area (that is perfect for pets) and a porch with a small screened-in area and pet door. Come check out the possibilities held in this home!
ⓘ Source: listings_history table (triggers on properties + properties_extension) + one-shot
backfill from property_details.listing_events for pre-trigger history.
Tax reassessment forecast TX · Resets to sale price
- Current annual tax
- $886 · $74/mo
- Projected year-2 tax
- $4,008 · $334/mo
- Expected delta
- +$3,122/yr (+$260/mo · 352.5%)
ⓘ Screening estimate from a state-policy table — verify with the county assessor before closing.
Climate risk First Street
- Flood 1/10 Low FEMA zone X (unshaded) · 0% chance over 30 yrs
- Wildfire 7/10 Severe
- Heat 7/10 Severe 7 d/yr ≥111°F today · 23 d/yr by 30 yrs out
- Wind 6/10 Major 27% chance of damaging wind over 30 yrs
- Air quality 2/10 Low 1 unhealthy d/yr today · 1 by 30 yrs out
Nearby sold comps map
Loading sold comps map…
Walkable amenities ~0.75 mi
Loading nearby amenities…
Taxation est. · year 1
- Rental income
- $14,452
- − Mortgage interest
- −$12,267
- − Property taxes
- −$886
- − Insurance
- −$1,095
- − Repairs & maintenance
- −$1,156
- − Management
- −$1,156
- − Depreciation
- −$6,371
- Taxable loss
- −$8,479
- Est. tax savings @ 24.0%
- +$2,035
- After-tax cash flow
- $-2,310/yr
For passive investors: Depreciation is non-cash, so a rental often shows a tax loss while cash-flowing — sheltering income. Rental losses are passive: they offset passive income freely, and up to $25,000/yr can offset ordinary (W-2) income if you actively participate and your MAGI is under $100k (phasing out to $0 by $150k); unused losses carry forward. On sale, claimed depreciation is recaptured at up to 25%, and gains may owe capital-gains tax (a 1031 exchange can defer both). Figures are a year-1 estimate at your 24.0% rate — not tax advice; consult a CPA.
Schools (NCES district)
- District
- Redwater ISD
- NCES district ID
- 4836750
- Math proficiency
- 58% ▼ -4.00%
- Reading proficiency
- 48% ▼ -2.00%
- Median HH income
- $56,454
- Composite
- 45.94/100
- National rank
- #2542
- State rank
- #123 of 826 in TX
Livability — Redwater
- Score
- 68/100
- State rank
- #467
- US rank
- #9379
Category grades
Schools grade is shown separately in the Schools card above.
Census & demographics
- Population (ZIP)
- 3,762
Population outlook (Bowie County) Hauer SSP2
- Today (2025)
- 94,699 people
- By 2030
- 94,824 · +0.1%
- By 2040
- 94,870 · +0.2%
- By 2050
- 93,686 · -1.1%
- By 2075
- 90,082 · -4.9%
- By 2100
- 76,579 · -19.1%
Race, ethnicity, and origin ACS 2023
- Neighborhood character
- Predominantly White (86%)
- Race & ethnicity
- White 86% Black 7% Two or more races 4% Asian 2% Hispanic / Latino 2%
- Common ancestry
- Lithuanian 1% Italian 1% Iranian 1%
- Foreign-born
- 3% · Canada, South Korea
- Languages at home
- 96% English-only · Spanish 2% Tagalog/Filipino 1% Korean 1%
Political lean MEDSL · Bowie
- 2024 margin
- Solid R (+48.7) · D 25.3% · R 74.0%
- 2008→2024 swing
- -10.8pp toward R · 2008: -37.9pp · 2024: -48.7pp
- All cycles
- 2024: R+48.7 2020: R+42.8 2016: R+46.6 2012: R+41.5 2008: R+37.9
Not yet ingested
- Civics
- —
Market trends
- HPI YoY
- —
- Current HPI
- —
- Rent YoY
- —
- Metro
- —
- State GDP YoY
- ▲ 3.95%
- F500 in state
- 110
Industry mix (Fortune 500 HQ in TX)
| Industry | F500 HQs | Revenue |
|---|---|---|
| Energy | 16 | $1,198B |
|
||
| Technology | 5 | $198B |
|
||
| Engineering / Construction | 4 | $72B |
|
||
| Energy Services | 3 | $60B |
|
||
| Utilities | 3 | $41B |
|
||
| Healthcare | 2 | $330B |
|
||
Price history
1 event — show timeline
- 2026-03-19 Listed $224,000 TBOR
Property tax history
+0.8%/yrLatest (2025): $886 · +10.7% YoY. Source: county tax records.
Cash-flow waterfall
monthlySold comps — $/sqft
last 12 mo · ≤1 miLoading sold comps…