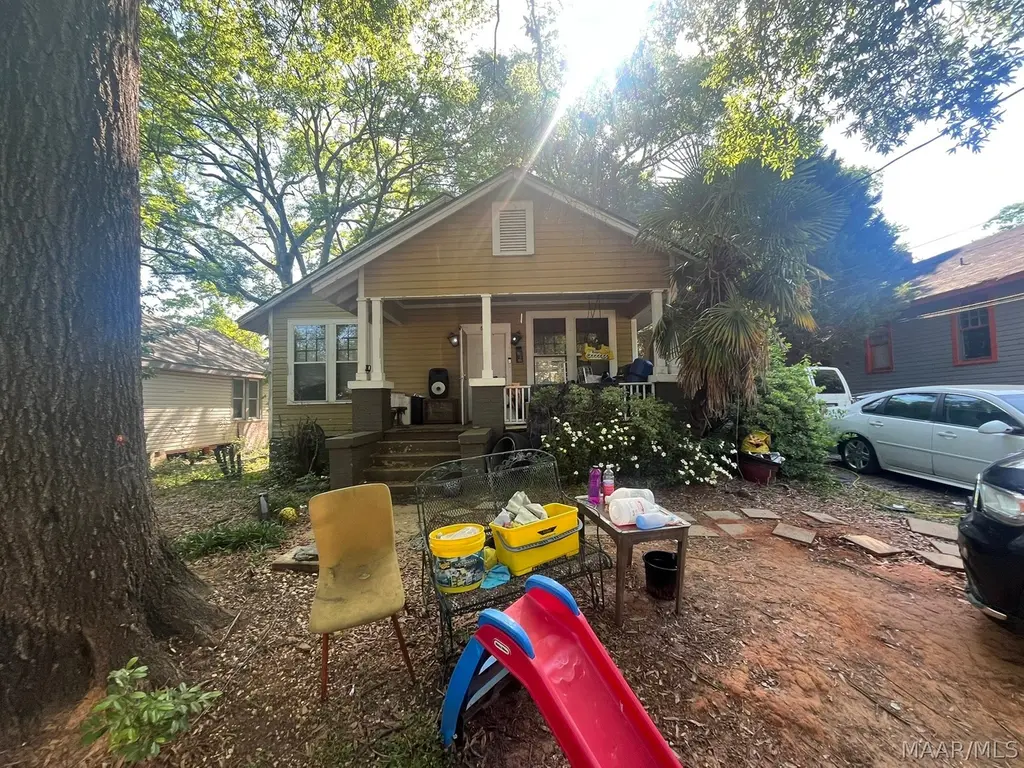
605 Buford St · Montgomery, AL
Flood risk 1/10 · Minimal
- FEMA flood zone
- X (unshaded)
- Chance of flooding over 30 yrs
- 0.0%
- Est. flood insurance / yr
- $507 – $1,088
Fire risk 1/10 · Minimal
- Est. fire insurance / yr
- $916 – $1,700
Heat risk 7/10 · Major
- Hot days now (above 107°F)
- 7 days/yr
- Hot days in 30 yrs
- 19 days/yr
Wind risk 8/10 · Major
- Chance of severe wind over 30 yrs
- 80.0%
Air-quality risk 3/10 · Minor
- Unhealthy air days now
- 4 days/yr
- Unhealthy air days in 30 yrs
- 4 days/yr
Risk factors via First Street. Map © Google.
Why this score? — see what drove the C+ grade
The composite is a weighted blend of 9 inputs, each scored 0–100. Each bar is that input's sub-score; the figure is the points it added to the 100-point composite (weight × sub-score).
- Cash flow +30.0/30.0
- 1% rule +10.0/10.0
- DSCR +10.0/10.0
- Rent growth +3.8/5.0
- Livability +3.2/5.0
- Condition / age +2.5/5.0
- Schools +1.7/10.0
- ARV discount +0.0/15.0
- Appreciation +0.0/10.0
$55,000
🖨 Deal sheet (PDF) 📄 Offer letter ✓ Due diligence
Listing remarks MLS
This property has been beautifully updated throughout. It is perfect for a first time home buyer or an investor. It features a front and back porch. Hot water heater is approximately two years old. A/C is approximately 3 years old.
Key facts
- Manageable lot
- Resale
- Solid layout
Tags
Property features AI
Finance
- Other: City lot with dirt road access; Lot approximately 0.12 acres
- Financial info: Lease expires 2026-06-01
- HOA & community: Has homeowners association; Annual association fee of $25 (contact agent for details)
Exterior
- Parking: Driveway
- Utilities: Cable available; Electricity available; Natural gas available; Public water; Public sewer
- Home design: Single-story home; New construction; Wood siding
- Construction: Built on a slab foundation; Wood siding construction; Completed (year built from public records)
- Exterior features: Covered porch; Porch
Interior
- Kitchen: Electric cooktop; Electric oven; Water heater
- Bedrooms: Bedroom on the first level
- Flooring: Plank; Vinyl
- Bathrooms: 2 full bathrooms
- Interior features: Garden tub / Roman tub; Plank and vinyl flooring
- Laundry & utility: Washer hookup; Dryer hookup
Neighborhood map
What this means for you Summary
Snapshot
- This is a 2-bed/2.0-bath single-family listed at $55k.
Deal economics
- At list price, monthly cash flow is $393 ($5k/yr) — positive.
- The deal already cash-flows at list — no discount required.
- Meets the 1% rule at list price ($939 rent vs $55k).
- Cap rate 14.9% vs local median 6.0% in Montgomery — top-decile yield for the area; either an underpriced asset or a hidden risk that comps aren't pricing in. Stress-test before assuming the spread holds.
Location & tenants
- Location reads 65/100 on livability (#138 in AL) — a middle-class / working-renter tenant base. Strengths: cost of living A+, housing A+; Watch: schools C-, employment D, crime F.
- Montgomery County (urban): math 9% / reading 31% proficiency, ranked #106 of 129 in AL (top 82%) — low school quality limits family demand, transient renter base, plan for 1-2y turnover; 70% free/reduced lunch — lower-income household profile, screen leases tightly.
- Market conditions: Rents rising fast (+5.0%/yr); 67 active listings in the ZIP; 40 comparable units currently listed for rent nearby; rentals lingering (median 45d on market — plan ~5-8 weeks vacancy on turnover, expect pricing pressure); 55% of comp listings sitting > 30 days — soft ceiling on asking rent; lower-income renter base — watch delinquency; 460 units permitted in Montgomery County in 2024 (37 in 5+ unit buildings).
- This rent runs 35% of the median local income ($32k/yr) — at the standard rent-burdened threshold; future hikes will face affordability resistance.
Forward outlook
- Local home prices are declining (-3.0%/yr); year-one equity from $380 of loan paydown is wiped out by about $2k of value loss. Plan a longer hold.
- Montgomery County population projected to shrink 8% by 2050 — rents likely to lag national; underwrite the cash flow, not the appreciation.
- At projected returns (-3.0% appreciation + 5.0% rent growth), your $15k cash investment doubles in ~4 years — after that, you're playing with house money.
Negotiation context
- Only 11 days on market — expect competitive offers; lowballing is unlikely to land.
- 3 sale attempts since 7y ago; this cycle's ask has dropped $3k (5%) from the opening price — seller is motivated, your offer sets the floor, not the list.
- Current owner paid $30k; list at $55k implies a 83% gain — meaningful room to come down on a strong offer.
Risks & watch-outs
- Watch-outs: built in 1930 — expect roof / HVAC / electrical / plumbing capex.
- Climate carrying-cost: severe wind risk, 80% chance of damaging wind over 30y; extreme-heat days projected 7→19/yr by 2055 (HVAC capex compounding) — expect insurance premiums to compound above CPI over the hold.
Questions for the listing agent
- Built in 1930 — when were the roof, HVAC, electrical panel, plumbing, and water heater last replaced?
- What does the HOA fee cover, when was the last increase, and are there any pending special assessments or reserve-fund shortfalls?
- Is there a deadline driving the sale (1031 exchange, divorce, estate, relocation)? That informs how much negotiation room exists.
- Crime grade is F in this area — have there been break-ins, vandalism, or insurance claims at this property in the last 3 years? What carrier currently insures it and at what premium?
- What's the average days-on-market for RENTAL listings here right now (not sales)? A rising rental-DOM trend means longer vacancies and softer asking-rent achievability than the comps imply.
- What's the recent tenant-quality profile in this submarket — average credit score on applications, eviction rate, late-payment / NSF rate, and stable-employment percentage? A property-management company in the area should have these aggregated.
- How much new for-sale + rental construction is in the pipeline within 1–3 miles? Heavy new supply typically softens prices + rents 12–24 months out; constrained supply supports both.
Investment metrics
- 1% rule
- 1.71% ✓
- Cap rate
- 14.87%
- Cash-on-cash
- 30.62%
- DSCR
- 2.36
- GRM
- 4.9
CMA / ARV
- ARV (median comp)
- $38,252
- List price
- $55,000
- Delta
- 69.93%
- Verdict
- OVERPRICED
- Comps
- 20 within 1.0 mi
Show comp detail 12 sales within ~0.75 mi
| Address | Dist | Beds/Ba | Sqft | Sold | Price | $/sf | Match |
|---|---|---|---|---|---|---|---|
| 2414 Chapman St | 0.17mi | 2/1.0 | 1,026 (+5%) | 4mo | $39,000 | $38 | 76 |
| 2405 Palmetto St | 0.15mi | 3/2.0 (+1) | 1,008 (+3%) | 13mo | $73,500 | $73 | 73 |
| 420 Calloway St | 0.22mi | 2/0.5 | 935 (-5%) | 20mo | $30,000 | $32 | 59 |
| 321 Ryan St | 0.29mi | 2/1.0 | 1,042 (+6%) | 16mo | $47,000 | $45 | 58 |
| 2829 Highland Ave | 0.46mi | 2/1.0 | 910 (-7%) | 8mo | $51,500 | $57 | 56 |
| 344 Arthur St | 0.21mi | 3/1.0 (+1) | 933 (-5%) | 22mo | $50,000 | $54 | 56 |
| 2050 Yancey Ave | 0.73mi | 3/2.0 (+1) | 1,040 (+6%) | 8mo | $95,000 | $91 | 44 |
| 1224 Ryan St | 0.49mi | 2/1.0 | 841 (-14%) | 12mo | $40,000 | $48 | 39 |
| 1525 Bryan St | 0.62mi | 3/1.0 (+1) | 1,052 (+7%) | 13mo | $37,500 | $36 | 39 |
| 2518 Poplar St | 0.40mi | 3/1.0 (+1) | 1,064 (+9%) | 23mo | $27,000 | $25 | 39 |
| 2318 Winona Ave | 0.74mi | 2/1.0 | 1,118 (+14%) | 2mo | $89,000 | $80 | 36 |
| 2943 Althea St | 0.58mi | 3/2.0 (+1) | 1,092 (+11%) | 16mo | $60,000 | $55 | 35 |
Match score weights: distance 35% · size 25% · config 20% · recency 20%. Top-matched comps best support the ARV.
Projected returns pro-forma
-3.0% appreciation · 5.05% rent growth · sell at horizon
- IRR
- 27.5%
- Equity multiple
- 2.17×
- Total profit
- $18,084
- Equity at exit
- $8,201
- IRR
- 36.2%
- Equity multiple
- 4.66×
- Total profit
- $56,408
- Equity at exit
- $4,755
Cash invested: $15,400 (down + closing). Projections, not guarantees.
Landlord ↔ Tenant lean methodology
- Overall (STATE)
- 90 Strongly Landlord-Friendly
- State Alabama
- 90 Strongly Landlord-Friendly · R+15
- County
- — inherits STATE
- City
- — inherits STATE
ZIP-level market 36107
- Home prices YoY
- -10.9%
- Rents YoY
- 5.0%
- Active inventory
- 67
- Price-to-rent
- 4.9×
Monthly cashflow live
- Estimated rent
- $939 high interval (Pro) →
- Mortgage (P&I)
- −$288
- Tax from tax record
- −$35 /mo · $426/yr
- Insurance
- −$23
- HOA
- −$2
- Vacancy / Maint / Mgmt
- −$197
- Net cashflow
- $393
Break-even live
Sensitivity live
| Price | -10% $424 | -5% $408 | +0% $393 | +5% $377 | +10% $362 |
|---|---|---|---|---|---|
| Rent | -10% $319 | -5% $356 | +0% $393 | +5% $430 | +10% $467 |
| Rate | -1.0pp $421 | -0.5pp $407 | base $393 | +0.5pp $379 | +1.0pp $364 |
UW: 25.0% down · 7.5% · 30yr · 1.5% tax · 5.0% vac · 8.0% maint · 8.0% mgmt
Financing live
Cash to close
- Down payment
- $13,750
- Closing costs
- $1,650
- Reserves months
- —
- Total cash needed
- —
Loan-product check · same deal, 3 products live
Conventional
25% down · 7.5% · 30yr
- Down + closing
- —
- Monthly P&I
- —
- Monthly cashflow
- —
- DSCR
- —
- Eligible?
- —
Personal DTI + credit; lowest rate.
DSCR
20% down · 8.5% · 30yr
- Down + closing
- —
- Monthly P&I
- —
- Monthly cashflow
- —
- DSCR
- —
- Eligible?
- —
No personal income docs; deal must DSCR.
Hard money
10% down · 12.0% · 12mo
- Down + closing
- —
- Monthly P&I
- —
- Monthly cashflow
- —
- DSCR
- —
- Eligible?
- —
Short-term bridge; refi at stabilization.
Rent comps 40 comps
| Address | Beds | Baths | Sqft | Rent | $/sqft | DOM | Units | Dist |
|---|---|---|---|---|---|---|---|---|
| 2405 Palmetto St Unit B Montgomery, AL | 1.0 | 1.0 | 550 | $750 | $1.36 | 14d | 1 | 0.14mi |
| 2302 Plum St Montgomery, AL | 1.0 | 1.0 | 656 | $700 | $1.07 | 14d | 1 | 0.14mi |
| 2300 Plum St Unit 2302 Montgomery, AL | 1.0 | 1.0 | 656 | $700 | $1.07 | 14d | 1 | 0.15mi |
| 1834 Highland Ave Unit A Montgomery, AL | 1.0 | 1.0 | 980 | $1,250 | $1.28 | 44d | 1 | 0.26mi |
| 2000 Cherry St Montgomery, AL | 2.0 | 1.0 | 1106 | $950 | $0.86 | 44d | 1 | 0.26mi |
| 329 S Capitol Pkwy Apt A Montgomery, AL | 1.0 | 1.0 | 800 | $645 | $0.81 | 44d | 1 | 0.39mi |
| 1827 Capitol Ave Montgomery, AL | 2.0 | 1.0 | 1068 | $1,600 | $1.50 | 14d | 1 | 0.48mi |
| 1827 Capitol Ave Montgomery, AL | 2.0 | 1.0 | 1068 | $1,600 | $1.50 | 44d | 1 | 0.48mi |
| 2229 Madison Ave Montgomery, AL | 2.0 | 1.0 | 1100 | $625 | $0.57 | 44d | 1 | 0.59mi |
| 2241 Saint Charles Ave Unit 2247 Montgomery, AL | 1.0 | 1.0 | 915 | $1,475 | $1.61 | 44d | 1 | 0.69mi |
| 319 Olivia Ct Montgomery, AL | 2.0 | 1.0 | 850 | $700 | $0.82 | 22d | 1 | 0.69mi |
| 311 Bradley Dr Montgomery, AL | 3.0 | 1.0 | 1104 | $825 | $0.75 | 44d | 1 | 0.71mi |
| 2121 Winona Ave Unit 2123 Montgomery, AL | 1.0 | 1.5 | 828 | $995 | $1.20 | 14d | 1 | 0.71mi |
| 2454 Spruce Curv Montgomery, AL | 3.0 | 1.0 | 988 | $1,100 | $1.11 | 44d | 1 | 0.72mi |
| 301 Bradley Dr Montgomery, AL | 2.0 | 1.0 | 841 | $935 | $1.11 | 14d | 1 | 0.72mi |
| 1517 Madison Ave Montgomery, AL | 1.0 | 1.0 | 1044 | $650 | $0.62 | 22d | 1 | 0.73mi |
| 1517 Madison Ave Montgomery, AL | 1.0 | 1.0 | 1044 | $650 | $0.62 | 44d | 1 | 0.73mi |
| 1732 West St Unit 1732 A Montgomery, AL | 1.0 | 1.0 | 715 | $1,375 | $1.92 | 44d | 1 | 0.75mi |
| 1530 Saint Charles Ave Unit B Montgomery, AL | 1.0 | 1.0 | 725 | $775 | $1.07 | 44d | 1 | 0.77mi |
| 116 N Lewis St Montgomery, AL | 1.0 | 1.0 | 690 | $875 | $1.27 | 44d | 1 | 0.77mi |
| 1415 Madison Ave Apt E Montgomery, AL | 2.0 | 1.0 | 825 | $1,095 | $1.33 | 14d | 1 | 0.79mi |
| 122 Oak Forest Dr Montgomery, AL | 3.0 | 1.0 | 1092 | $975 | $0.89 | 22d | 1 | 0.79mi |
| 2205 E 5th St Montgomery, AL | 3.0 | 1.0 | 1020 | $800 | $0.78 | 44d | 1 | 0.81mi |
| 1513 Rex St Montgomery, AL | 1.0 | 1.0 | 840 | $1,095 | $1.30 | 44d | 1 | 0.81mi |
| 2642 E 3rd St Unit EA2676 Montgomery, AL | 1.0 | 1.0 | 604 | $800 | $1.32 | 22d | 1 | 0.85mi |
| 2122 Windsor Ave Montgomery, AL | 2.0 | 1.0 | 1052 | $725 | $0.69 | 44d | 1 | 0.88mi |
| 424 N California St Apt D Montgomery, AL | 2.0 | 1.0 | 850 | $778 | $0.92 | 22d | 1 | 0.88mi |
| 2023 Windsor Ave Montgomery, AL | 2.0 | 1.0 | 889 | $895 | $1.01 | 44d | 1 | 0.90mi |
| 1510 Yancey Ave Unit B Montgomery, AL | 1.0 | 1.0 | 650 | $725 | $1.12 | 44d | 1 | 0.90mi |
| 1915 Walnut St Ste B Montgomery, AL | 1.0 | 1.0 | 950 | $950 | $1.00 | 44d | 1 | 0.93mi |
| 517 N Florida St Unit B Montgomery, AL | 2.0 | 1.0 | 900 | $750 | $0.83 | 44d | 1 | 0.93mi |
| 7 Calhoun Rd Unit B Montgomery, AL | 2.0 | 1.0 | 961 | $850 | $0.88 | 44d | 1 | 1.02mi |
| 1347 Felder Ave Montgomery, AL | 2.0 | 1.0 | 1000 | $1,095 | $1.09 | 14d | 1 | 1.08mi |
| 1343 Felder Ave Montgomery, AL | 2.0 | 1.0 | 1000 | $1,095 | $1.09 | 14d | 1 | 1.08mi |
| 1491 Watson St Montgomery, AL | 1.0 | 1.0 | 1066 | $900 | $0.84 | 22d | 1 | 1.13mi |
| 1487 Watson St Montgomery, AL | 1.0 | 1.0 | 1066 | $875 | $0.82 | 22d | 1 | 1.13mi |
| 1493 Watson St Montgomery, AL | 1.0 | 1.0 | 1066 | $900 | $0.84 | 22d | 1 | 1.13mi |
| 2166 College St Montgomery, AL | 1.0 | 1.0 | 700 | $775 | $1.11 | 14d | 1 | 1.14mi |
| 1814 Pinecrest Dr Montgomery, AL | 3.0 | 1.0 | 1053 | $990 | $0.94 | 44d | 1 | 1.22mi |
| 80 Turner Pl Unit 14 Montgomery, AL | 2.0 | 1.0 | 620 | $750 | $1.21 | 44d | 1 | 1.24mi |
HOA detail
- Monthly dues
- $2 · $24/yr
- Likely covers
- water
Listing history 10 events
-
2026-06-21pricedays on market $55,000 Active 11 DOM
-
2026-06-18days on market $58,000 Active 8 DOM
-
2026-06-17days on market $58,000 Active 7 DOM
-
2026-06-16days on market $58,000 Active 6 DOM
-
2026-06-15days on market $58,000 Active 5 DOM
-
2026-06-14days on market $58,000 Active 3 DOM
-
2026-06-13pricedays on market $58,000 Active 2 DOM
-
2026-04-24$65,000 Active 540-char remark
-
2019-06-03soldstatus $30,000 231-char remark
Show marketing remark (231 chars)
This property has been beautifully updated throughout. It is perfect for a first time home buyer or an investor. It features a front and back porch. Hot water heater is approximately two years old. A/C is approximately 3 years old.
-
2019-04-01$34,995 231-char remark
Show marketing remark (231 chars)
This property has been beautifully updated throughout. It is perfect for a first time home buyer or an investor. It features a front and back porch. Hot water heater is approximately two years old. A/C is approximately 3 years old.
ⓘ Source: listings_history table (triggers on properties + properties_extension) + one-shot
backfill from property_details.listing_events for pre-trigger history.
Tax reassessment forecast AL · Resets to sale price
- Current annual tax
- $426 · $35/mo
- Projected year-2 tax
- $426 · $35/mo
- Expected delta
- $0/yr ($0/mo · 0.0%)
ⓘ Screening estimate from a state-policy table — verify with the county assessor before closing.
Climate risk First Street
- Flood 1/10 Low FEMA zone X (unshaded) · 0% chance over 30 yrs
- Wildfire 1/10 Low
- Heat 7/10 Severe 7 d/yr ≥107°F today · 19 d/yr by 30 yrs out
- Wind 8/10 Severe 80% chance of damaging wind over 30 yrs
- Air quality 3/10 Moderate 4 unhealthy d/yr today · 4 by 30 yrs out
Nearby sold comps map
Loading sold comps map…
Walkable amenities ~0.75 mi
Loading nearby amenities…
Taxation est. · year 1
- Rental income
- $11,267
- − Mortgage interest
- −$3,081
- − Property taxes
- −$426
- − Insurance
- −$275
- − Repairs & maintenance
- −$901
- − Management
- −$901
- − HOA
- −$24
- − Depreciation
- −$1,600
- Taxable income
- $4,059
- Est. tax owed @ 24.0%
- −$974
- After-tax cash flow
- $3,741/yr
For passive investors: Depreciation is non-cash, so a rental often shows a tax loss while cash-flowing — sheltering income. Rental losses are passive: they offset passive income freely, and up to $25,000/yr can offset ordinary (W-2) income if you actively participate and your MAGI is under $100k (phasing out to $0 by $150k); unused losses carry forward. On sale, claimed depreciation is recaptured at up to 25%, and gains may owe capital-gains tax (a 1031 exchange can defer both). Figures are a year-1 estimate at your 24.0% rate — not tax advice; consult a CPA.
Schools (NCES district)
- District
- Montgomery County
- NCES district ID
- 0102430
- Math proficiency
- 9% ▼ -21.00%
- Reading proficiency
- 31% ▼ -1.00%
- Median HH income
- $43,902
- Composite
- 17.24/100
- National rank
- #9093
- State rank
- #106 of 129 in AL
Livability — Montgomery
- Score
- 65/100
- State rank
- #138
- US rank
- #13416
Category grades
Schools grade is shown separately in the Schools card above.
Census & demographics
- Census place
- Montgomery, AL
- County
- Montgomery County · 190,016 people
- City population
- 175,913
- Metro
- Montgomery, AL
- Population (ZIP)
- 8,001
- Household income
- $32,492
- Rent vs Own
- Severe rent burden
- 642.0
Population outlook (Montgomery County) Hauer SSP2
- Today (2025)
- 224,008 people
- By 2030
- 221,460 · -1.1%
- By 2040
- 214,179 · -4.4%
- By 2050
- 204,912 · -8.5%
- By 2075
- 177,821 · -20.6%
- By 2100
- 145,134 · -35.2%
Race, ethnicity, and origin ACS 2023
- Neighborhood character
- Diverse neighborhood (Simpson 0.69)
- Race & ethnicity
- Black 43% White 27% Hispanic / Latino 23% Two or more races 20%
- Hispanic origin (detail)
- Mexican 8% Cuban 3%
- Common ancestry
- Slovak 1% Iranian 1% Serbian 1%
- Foreign-born
- 11% · Canada
- Languages at home
- 83% English-only · Spanish 13%
Political lean MEDSL · Montgomery
- 2024 margin
- Solid D (+30.7) · D 64.8% · R 34.1% · Other 1.1%
- 2008→2024 swing
- +11.5pp toward D · 2008: 19.2pp · 2024: 30.7pp
- All cycles
- 2024: D+30.7 2020: D+31.5 2016: D+26.2 2012: D+24.3 2008: D+19.2
Not yet ingested
- Civics
- —
Market trends
- HPI YoY
- ▼ -18.16%
- Current HPI
- 147.8065
- Rent YoY
- ▲ 5.05%
- Metro
- Montgomery, AL
- State GDP YoY
- ▲ 2.94%
- F500 in state
- 4
Industry mix (Fortune 500 HQ in AL)
| Industry | F500 HQs | Revenue |
|---|---|---|
| Financial Services | 1 | $8B |
|
||
| Healthcare | 1 | $5B |
|
||
Price history
+65.7% since first listed4 events — show timeline
- 2026-06-10 Listed $58,000 MAAR
- 2026-04-24 Listed $65,000 MAAR
- 2019-06-03 Sold (MLS) $30,000 MAAR
- 2019-04-01 Listed $34,995 MAAR
Property tax history
+4.8%/yrLatest (2025): $426 · +6.0% YoY. Source: county tax records.
Cash-flow waterfall
monthlySold comps — $/sqft
last 12 mo · ≤1 miLoading sold comps…