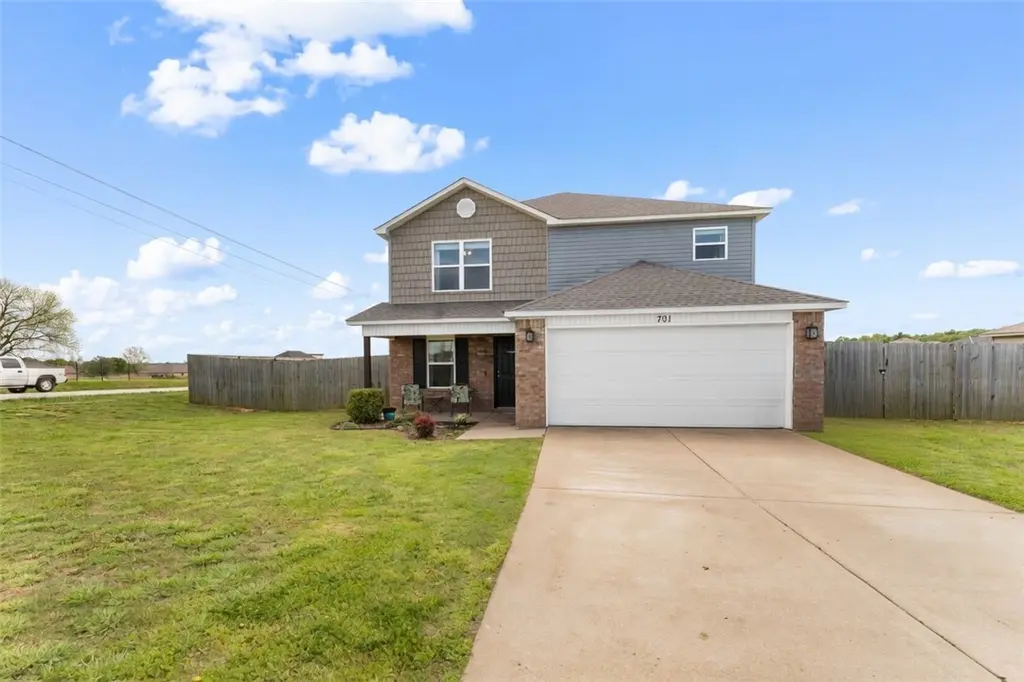
701 NW 67th Ave · Highfill, AR
Flood risk 1/10 · Minimal
- FEMA flood zone
- X (unshaded)
- Chance of flooding over 30 yrs
- 0.0%
- Est. flood insurance / yr
- $507 – $1,088
Fire risk 6/10 · Moderate
- Est. fire insurance / yr
- $1,499 – $2,785
Heat risk 5/10 · Moderate
- Hot days now (above 106°F)
- 7 days/yr
- Hot days in 30 yrs
- 21 days/yr
Wind risk 2/10 · Minimal
- Chance of severe wind over 30 yrs
- 2.0%
Air-quality risk 1/10 · Minimal
- Unhealthy air days now
- 0 days/yr
- Unhealthy air days in 30 yrs
- 0 days/yr
Risk factors via First Street. Map © Google.
Why this score? — see what drove the D+ grade
The composite is a weighted blend of 9 inputs, each scored 0–100. Each bar is that input's sub-score; the figure is the points it added to the 100-point composite (weight × sub-score).
- ARV discount +15.0/15.0
- Appreciation +10.0/10.0
- Cash flow +7.1/30.0
- Schools +5.2/10.0
- Livability +3.4/5.0
- Rent growth +2.6/5.0
- Condition / age +2.5/5.0
- DSCR +1.3/10.0
- 1% rule +1.0/10.0
$325,000
🖨 Deal sheet (PDF) 📄 Offer letter ✓ Due diligence
Listing remarks MLS
RD Eligible! ($0 Down) New 3br 2.5 bath 2-story home with a nice covered front porch and a 2-10 warranty situated on a corner lot.
Key facts
- Private office
- Corner lot
- New roof
Tags
Property features AI
Finance
- HOA & community: Annual association fee of $100
Exterior
- Parking: Attached garage; Asphalt driveway; Garage door opener; 2 covered parking spaces
- Security: Fire alarm; Smoke detectors
- Utilities: Electricity available; Natural gas available; Public water
- Home design: Two-story home; Resale (less than 25 years old)
- Construction: Vinyl siding; Architectural shingle roof; Slab foundation
- Exterior features: Patio; Privacy wood fencing; Corner lot; Subdivision; Private road frontage
Interior
- Kitchen: Dishwasher; Disposal; Microwave; Microwave hood fan; Electric range; Electric oven; Smooth cooktop; Refrigerator; Water heater
- Flooring: Laminate
- Bathrooms: 2 full bathrooms; 1 half bathroom
- Heating & cooling: Central heating; Central air conditioning
- Interior features: Walk-in closet(s); Pantry; Window treatments; Blinds
- Laundry & utility: Washer hookup; Dryer hookup
Neighborhood map
What this means for you Summary
Snapshot
- This is a 4-bed/2.5-bath single-family listed at $325k.
Deal economics
- At list price, monthly cash flow is $-457 ($-5k/yr) — negative.
- To cash-flow at today's rent, offer at most $244k (24.8% below list).
- To meet the 1% rule (rent ≥ 1% of price), the offer needs to be $197k (39.5% below list).
- Recommended offer: $197k (39.5% below list) — sets the bar for 1% rule.
- Cap rate 4.6% vs local median 2.9% in Highfill — top-decile yield for the area; either an underpriced asset or a hidden risk that comps aren't pricing in. Stress-test before assuming the spread holds.
Location & tenants
- Location reads 67/100 on livability (#97 in AR) — a middle-class / working-renter tenant base. Strengths: crime A+, employment A+, cost of living A+; Watch: schools F, amenities F, commute F.
- Bentonville School District (urban): math 59% / reading 59% proficiency, ranked #3 of 238 in AR (top 1%) — acceptable for families but not a draw, mixed tenant base, ~2y average lease.
- Market conditions: Rents flat; 710 active listings in the ZIP; 10 comparable units currently listed for rent nearby; rentals at typical pace (median 16d on market — plan ~3-4 weeks tenant-placement turnaround); high-income renter base; 4,359 units permitted in Benton County in 2024 (402 in 5+ unit buildings).
Forward outlook
- In year one you build about $35k of equity ($2k loan paydown + $32k appreciation (10.0% local appreciation)).
- Benton County population projected at +56% by 2050 — long-run rental-demand tailwind backs the buy-and-hold thesis.
- By year 2, paydown + projected appreciation supports a ~$56k cash-out refi (75% LTV) — recoverable capital for the next deal without selling this one.
Negotiation context
- It's been on market 51 days — a 3% lower offer ($315k) is reasonable based on typical stale-listing flexibility.
- 2 sale attempts since 8y ago; this cycle's ask has dropped $25k (7%) from the opening price — seller is motivated, your offer sets the floor, not the list.
- Current owner paid $175k; list at $325k implies a 86% gain — meaningful room to come down on a strong offer.
Risks & watch-outs
- Climate carrying-cost: major wildfire risk; extreme-heat days projected 7→21/yr by 2055 (HVAC capex compounding) — expect insurance premiums to compound above CPI over the hold.
Questions for the listing agent
- What do current leases actually rent for vs. the listed asking? Can we see a recent rent roll and the last 12 months of T-12 income?
- It's been on market 51 days. Have you received any prior offers? Is the seller open to a 40% concession, seller financing, or rate buy-down credit?
- What does the HOA fee cover, when was the last increase, and are there any pending special assessments or reserve-fund shortfalls?
- Is there a deadline driving the sale (1031 exchange, divorce, estate, relocation)? That informs how much negotiation room exists.
- Schools are F-rated, which usually means shorter tenancies and higher turnover. Who's the typical renter profile here, and what's been the actual vacancy rate?
- The area grade is low — what's the realistic commute time and amenity access for the typical tenant pool here? Any planned neighborhood developments (good or bad) we should know about?
- What's the average days-on-market for RENTAL listings here right now (not sales)? A rising rental-DOM trend means longer vacancies and softer asking-rent achievability than the comps imply.
- What's the recent tenant-quality profile in this submarket — average credit score on applications, eviction rate, late-payment / NSF rate, and stable-employment percentage? A property-management company in the area should have these aggregated.
- How much new for-sale + rental construction is in the pipeline within 1–3 miles? Heavy new supply typically softens prices + rents 12–24 months out; constrained supply supports both.
Investment metrics
- 1% rule
- 0.60% ✗
- Cap rate
- 4.61%
- Cash-on-cash
- -6.02%
- DSCR
- 0.73
- GRM
- 13.8
CMA / ARV
- ARV (on-the-fly)
- $392,448
- Comps found
- 12
Show comp detail 12 sales within ~0.75 mi
| Address | Dist | Beds/Ba | Sqft | Sold | Price | $/sf | Match |
|---|---|---|---|---|---|---|---|
| 805 NW 70th Ave | 0.20mi | 3/2.5 (-1) | 2,021 (-1%) | 2mo | $345,000 | $171 | 82 |
| 6408 NW Zella St | 0.13mi | 4/3.0 | 1,887 (-8%) | 1mo | $373,183 | $198 | 78 |
| 6312 NW Zella St | 0.16mi | 4/3.0 | 1,887 (-8%) | 1mo | $377,778 | $200 | 77 |
| 6417 NW Harley St | 0.13mi | 3/2.0 (-1) | 1,805 (-12%) | 3mo | $360,000 | $199 | 65 |
| 6401 NW Harley St | 0.16mi | 3/2.0 (-1) | 1,805 (-12%) | 1mo | $357,287 | $198 | 65 |
| 6308 NW Zella St | 0.17mi | 3/2.0 (-1) | 1,805 (-12%) | 5mo | $358,633 | $199 | 61 |
| 406 NW 59th Ave | 0.66mi | 3/2.0 (-1) | 1,968 (-4%) | 6mo | $349,000 | $177 | 52 |
| 6008 NW Meade St | 0.38mi | 3/2.0 (-1) | 1,761 (-14%) | 3mo | $333,000 | $189 | 50 |
| 5909 Sherman St | 0.40mi | 3/2.0 (-1) | 1,750 (-14%) | 2mo | $326,000 | $186 | 49 |
| 424 59th Ave | 0.45mi | 3/2.0 (-1) | 1,782 (-13%) | 5mo | $330,000 | $185 | 47 |
| 6007 NW Hoover St | 0.50mi | 3/2.0 (-1) | 1,748 (-14%) | 2mo | $320,000 | $183 | 44 |
| 6002 NW Ettie May St | 0.50mi | 3/2.0 (-1) | 1,762 (-14%) | 6mo | $339,000 | $192 | 42 |
Match score weights: distance 35% · size 25% · config 20% · recency 20%. Top-matched comps best support the ARV.
Projected returns pro-forma
10.0% appreciation · 0.39% rent growth · sell at horizon
- IRR
- 19.4%
- Equity multiple
- 2.57×
- Total profit
- $142,779
- Equity at exit
- $292,786
- IRR
- 17.4%
- Equity multiple
- 5.77×
- Total profit
- $433,941
- Equity at exit
- $631,404
Cash invested: $91,000 (down + closing). Projections, not guarantees.
Landlord ↔ Tenant lean methodology
- Overall (STATE)
- 92 Strongly Landlord-Friendly
- State Arkansas
- 92 Strongly Landlord-Friendly · R+14
- County
- — inherits STATE
- City
- — inherits STATE
ZIP-level market 72713
- Home prices YoY
- 3.5%
- Rents YoY
- 0.4%
- Active inventory
- 710
- Price-to-rent
- 13.8×
Monthly cashflow live
- Estimated rent
- $1,965 high interval (Pro) →
- Mortgage (P&I)
- −$1,704
- Tax from tax record
- −$161 /mo · $1,935/yr
- Insurance
- −$135
- HOA
- −$8
- Vacancy / Maint / Mgmt
- −$413
- Net cashflow
- $-457
Break-even live
Sensitivity live
| Price | -10% $-273 | -5% $-365 | +0% $-457 | +5% $-549 | +10% $-641 |
|---|---|---|---|---|---|
| Rent | -10% $-612 | -5% $-534 | +0% $-457 | +5% $-379 | +10% $-301 |
| Rate | -1.0pp $-293 | -0.5pp $-374 | base $-457 | +0.5pp $-541 | +1.0pp $-626 |
UW: 25.0% down · 7.5% · 30yr · 1.5% tax · 5.0% vac · 8.0% maint · 8.0% mgmt
Financing live
Cash to close
- Down payment
- $81,250
- Closing costs
- $9,750
- Reserves months
- —
- Total cash needed
- —
Loan-product check · same deal, 3 products live
Conventional
25% down · 7.5% · 30yr
- Down + closing
- —
- Monthly P&I
- —
- Monthly cashflow
- —
- DSCR
- —
- Eligible?
- —
Personal DTI + credit; lowest rate.
DSCR
20% down · 8.5% · 30yr
- Down + closing
- —
- Monthly P&I
- —
- Monthly cashflow
- —
- DSCR
- —
- Eligible?
- —
No personal income docs; deal must DSCR.
Hard money
10% down · 12.0% · 12mo
- Down + closing
- —
- Monthly P&I
- —
- Monthly cashflow
- —
- DSCR
- —
- Eligible?
- —
Short-term bridge; refi at stabilization.
Rent comps 10 comps
| Address | Beds | Baths | Sqft | Rent | $/sqft | DOM | Units | Dist |
|---|---|---|---|---|---|---|---|---|
| 864 NW Evans Cir Bentonville, AR | 4.0 | 2.0 | 1497 | $1,650 | $1.10 | 25d | 1 | 0.09mi |
| 805 NW 70th Ave Bentonville, AR | 3.0 | 2.5 | 2021 | $2,350 | $1.16 | 16d | 1 | 0.19mi |
| 6103 NW McClellen St Bentonville, AR | 4.0 | 2.0 | 1433 | $1,795 | $1.25 | 25d | 1 | 0.32mi |
| 6002 NW Meade St Bentonville, AR | 3.0 | 2.0 | 1860 | $1,825 | $0.98 | 25d | 1 | 0.42mi |
| 424 NW 59 Ave Bentonville, AR | 3.0 | 2.0 | 1782 | $2,150 | $1.21 | 16d | 1 | 0.46mi |
| 6005 NW Hoover St Bentonville, AR | 4.0 | 2.0 | 1433 | $1,595 | $1.11 | 16d | 1 | 0.51mi |
| 6600 NW Altus St Highfill, AR | 4.0 | 2.0 | 1454 | $1,595 | $1.10 | 16d | 1 | 0.58mi |
| 6605 NW Vandergriff St Bentonville, AR | 4.0 | 2.0 | 1454 | $1,595 | $1.10 | 16d | 1 | 0.60mi |
| 6608 NW Vandergriff St Highfill, AR | 4.0 | 2.0 | 1454 | $1,595 | $1.10 | 16d | 1 | 0.63mi |
| 210 NW 67th Ave Bentonville, AR | 4.0 | 2.0 | 1454 | $1,595 | $1.10 | 16d | 1 | 0.70mi |
HOA detail
- Monthly dues
- $8 · $96/yr
Listing history 16 events
-
2026-06-14status $325,000 Pending 51 DOM
-
2026-06-10days on market $325,000 Active 51 DOM
-
2026-06-09days on market $325,000 Active 50 DOM
-
2026-06-08days on market $325,000 Active 49 DOM
-
2026-06-07days on market $325,000 Active 48 DOM
-
2026-06-05days on market $325,000 Active 45 DOM
-
2026-06-03days on market $325,000 Active 44 DOM
-
2026-06-02days on market $325,000 Active 43 DOM
-
2026-06-01days on market $325,000 Active 42 DOM
-
2026-05-31days on market $325,000 Active 41 DOM
-
2026-05-31days on market $325,000 Active 40 DOM
-
2026-05-11price $345,000
-
2026-04-20$350,000 Active
-
2018-08-09soldstatus $174,675 130-char remark
Show marketing remark (130 chars)
RD Eligible! ($0 Down) New 3br 2.5 bath 2-story home with a nice covered front porch and a 2-10 warranty situated on a corner lot.
-
2018-08-09soldstatus $174,675
Show marketing remark (130 chars)
RD Eligible! ($0 Down) New 3br 2.5 bath 2-story home with a nice covered front porch and a 2-10 warranty situated on a corner lot.
-
2018-03-07$174,675 130-char remark
Show marketing remark (130 chars)
RD Eligible! ($0 Down) New 3br 2.5 bath 2-story home with a nice covered front porch and a 2-10 warranty situated on a corner lot.
ⓘ Source: listings_history table (triggers on properties + properties_extension) + one-shot
backfill from property_details.listing_events for pre-trigger history.
Tax reassessment forecast AR · Resets to sale price
- Current annual tax
- $1,935 · $161/mo
- Projected year-2 tax
- $2,080 · $173/mo
- Expected delta
- +$145/yr (+$12/mo · 7.5%)
ⓘ Screening estimate from a state-policy table — verify with the county assessor before closing.
Climate risk First Street
- Flood 1/10 Low FEMA zone X (unshaded) · 0% chance over 30 yrs
- Wildfire 6/10 Major
- Heat 5/10 Major 7 d/yr ≥106°F today · 21 d/yr by 30 yrs out
- Wind 2/10 Low 2% chance of damaging wind over 30 yrs
- Air quality 1/10 Low 0 unhealthy d/yr today · 0 by 30 yrs out
Nearby sold comps map
Loading sold comps map…
Walkable amenities ~0.75 mi
Loading nearby amenities…
Taxation est. · year 1
- Rental income
- $23,581
- − Mortgage interest
- −$18,205
- − Property taxes
- −$1,935
- − Insurance
- −$1,625
- − Repairs & maintenance
- −$1,886
- − Management
- −$1,886
- − HOA
- −$96
- − Depreciation
- −$9,455
- Taxable loss
- −$11,507
- Est. tax savings @ 24.0%
- +$2,762
- After-tax cash flow
- $-2,717/yr
For passive investors: Depreciation is non-cash, so a rental often shows a tax loss while cash-flowing — sheltering income. Rental losses are passive: they offset passive income freely, and up to $25,000/yr can offset ordinary (W-2) income if you actively participate and your MAGI is under $100k (phasing out to $0 by $150k); unused losses carry forward. On sale, claimed depreciation is recaptured at up to 25%, and gains may owe capital-gains tax (a 1031 exchange can defer both). Figures are a year-1 estimate at your 24.0% rate — not tax advice; consult a CPA.
Schools (NCES district)
- District
- Bentonville School District
- NCES district ID
- 0503060
- Math proficiency
- 59% ▼ -8.00%
- Reading proficiency
- 59% ▼ -6.00%
- Median HH income
- $66,721
- Composite
- 51.85/100
- National rank
- #1661
- State rank
- #3 of 238 in AR
Livability — Highfill
- Score
- 67/100
- State rank
- #97
- US rank
- #10302
Category grades
Schools grade is shown separately in the Schools card above.
Census & demographics
- Census place
- Highfill, AR
- County
- Benton County · 259,241 people
- Metro
- Fayetteville-Springdale-Rogers, AR
- Population (ZIP)
- 28,999
- Household income
- $119,853
- Rent vs Own
- Severe rent burden
- 508.0
Population outlook (Benton County) Hauer SSP2
- Today (2025)
- 318,683 people
- By 2030
- 353,481 · +10.9%
- By 2040
- 425,280 · +33.4%
- By 2050
- 497,239 · +56.0%
- By 2075
- 662,114 · +107.8%
- By 2100
- 776,431 · +143.6%
Race, ethnicity, and origin ACS 2023
- Neighborhood character
- Diverse neighborhood (Simpson 0.66)
- Race & ethnicity
- White 54% Asian 20% Two or more races 16% Hispanic / Latino 11% Black 3%
- Hispanic origin (detail)
- Mexican 8%
- Common ancestry
- Italian 2% Slovak 2% Romanian 1%
- Foreign-born
- 22% · Canada, China, Vietnam
- Languages at home
- 79% English-only · Other Asian/Pacific 8% Spanish 6% Other Indo-European 5%
Political lean MEDSL · Benton
- 2024 margin
- Strong R (+27.0) · D 35.2% · R 62.1% · Other 2.7%
- 2008→2024 swing
- +9.6pp toward D · 2008: -36.5pp · 2024: -27.0pp
- All cycles
- 2024: R+27.0 2020: R+26.4 2016: R+34.9 2012: R+40.4 2008: R+36.5
Not yet ingested
- Civics
- —
Market trends
- HPI YoY
- ▲ 10.77%
- Current HPI
- 319.3081
- Rent YoY
- ▲ 0.39%
- Metro
- Fayetteville-Springdale-Rogers, AR
- State GDP YoY
- ▲ 3.80%
- F500 in state
- 10
Industry mix (Fortune 500 HQ in AR)
| Industry | F500 HQs | Revenue |
|---|---|---|
| Retail | 1 | $681B |
|
||
| Food / Agriculture | 1 | $53B |
|
||
| Retail / Energy | 1 | $22B |
|
||
| Transportation / Logistics | 1 | $12B |
|
||
| Energy | 1 | $4B |
|
||
Price history
+97.5% since first listed5 events — show timeline
- 2026-05-11 Price Changed $345,000 NWARMLS
- 2026-04-20 Listed $350,000 NWARMLS
- 2018-08-09 Sold (Public Records) $174,675 Public Records
- 2018-08-09 Sold (MLS) $174,675 NWARMLS
- 2018-03-07 Listed $174,675 NWARMLS
Property tax history
+29.5%/yrLatest (2025): $1,935 · +2.4% YoY. Source: county tax records.
Cash-flow waterfall
monthlySold comps — $/sqft
last 12 mo · ≤1 miLoading sold comps…