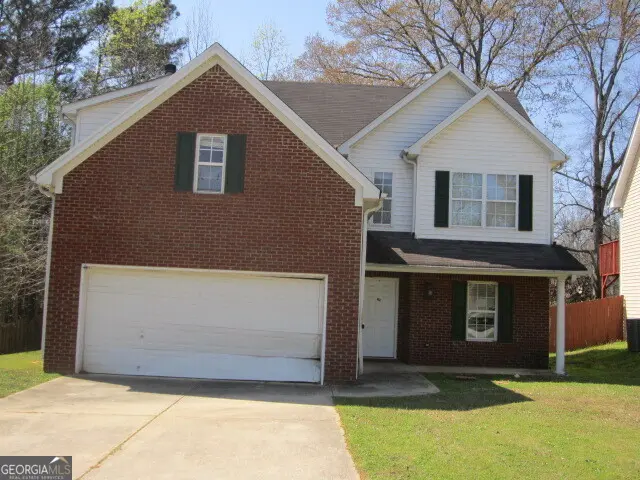
513 Luke Ct · Jonesboro, GA
Flood risk 1/10 · Minimal
- FEMA flood zone
- X (unshaded)
- Chance of flooding over 30 yrs
- 0.0%
- Est. flood insurance / yr
- $507 – $1,088
Fire risk 1/10 · Minimal
- Est. fire insurance / yr
- $963 – $1,789
Heat risk 6/10 · Moderate
- Hot days now (above 105°F)
- 7 days/yr
- Hot days in 30 yrs
- 18 days/yr
Wind risk 6/10 · Moderate
- Chance of severe wind over 30 yrs
- 27.0%
Air-quality risk 4/10 · Minor
- Unhealthy air days now
- 4 days/yr
- Unhealthy air days in 30 yrs
- 6 days/yr
Risk factors via First Street. Map © Google.
Why this score? — see what drove the C+ grade
The composite is a weighted blend of 9 inputs, each scored 0–100. Each bar is that input's sub-score; the figure is the points it added to the 100-point composite (weight × sub-score).
- Cash flow +21.9/30.0
- ARV discount +15.0/15.0
- DSCR +7.0/10.0
- 1% rule +5.8/10.0
- Livability +3.6/5.0
- Rent growth +3.0/5.0
- Condition / age +2.5/5.0
- Schools +1.3/10.0
- Appreciation +0.0/10.0
$177,500
🖨 Deal sheet 📄 Offer letter ✓ Due diligence
Listing remarks MLS
4 bedroom, 2.5 bath two story on quiet dead end street in Jonesboro. 1980 sq.ft. plus double garage. Large family room with fireplace. This is a cash or rehab loan only. Sold as-is with no seller disclosure.
Key facts
- 9,147 sq ft lot
- Garage
- Built 2005
Neighborhood map
What this means for you Summary
Snapshot
- This is a 3-bed/3.0-bath single-family listed at $178k.
Deal economics
- At list price, monthly cash flow is $279 ($3k/yr) — positive.
- The deal already cash-flows at list — no discount required.
- Meets the 1% rule at list price ($2k rent vs $178k).
- Recommended offer: $167k (6.0% below list) — sets the bar for market timing.
- Cap rate 8.2% vs local median 5.0% in Jonesboro — top-decile yield for the area; either an underpriced asset or a hidden risk that comps aren't pricing in. Stress-test before assuming the spread holds.
Location & tenants
- Location reads 72/100 on livability (#63 in GA) — a middle-class / working-renter tenant base. Strengths: cost of living A+, housing A-; Watch: crime C-, employment D, schools F.
- Clayton County (suburban): math 11% / reading 20% proficiency, ranked #155 of 174 in GA (top 89%) — low school quality limits family demand, transient renter base, plan for 1-2y turnover; 78% free/reduced lunch — lower-income household profile, screen leases tightly.
- Market conditions: Rents rising (+2.1%/yr); 251 active listings in the ZIP; 40 comparable units currently listed for rent nearby; rentals at typical pace (median 24d on market — plan ~3-4 weeks tenant-placement turnaround); 865 units permitted in Clayton County in 2024 (448 in 5+ unit buildings).
- This rent runs 37% of the median local income ($62k/yr) — at the standard rent-burdened threshold; future hikes will face affordability resistance.
Forward outlook
- Local home prices are declining (-3.0%/yr); year-one equity from $1k of loan paydown is wiped out by about $5k of value loss. Plan a longer hold.
- Clayton County population projected at +29% by 2050 — long-run rental-demand tailwind backs the buy-and-hold thesis.
Negotiation context
- It's been on market 89 days — a 6% lower offer ($167k) is reasonable based on typical stale-listing flexibility.
- 2 sale attempts since 5y ago; this cycle's ask has dropped $15k (8%) from the opening price — seller is motivated, your offer sets the floor, not the list.
Risks & watch-outs
- Climate carrying-cost: major wind risk, 27% chance of damaging wind over 30y; extreme-heat days projected 7→18/yr by 2055 (HVAC capex compounding) — expect insurance premiums to compound above CPI over the hold.
Questions for the listing agent
- It's been on market 89 days. Have you received any prior offers? Is the seller open to a 6% concession, seller financing, or rate buy-down credit?
- Why hasn't it sold? Are there any deal-killer items the seller is aware of (foundation, flood, title, zoning, code violations)?
- Is there a deadline driving the sale (1031 exchange, divorce, estate, relocation)? That informs how much negotiation room exists.
- Schools are F-rated, which usually means shorter tenancies and higher turnover. Who's the typical renter profile here, and what's been the actual vacancy rate?
- What's the average days-on-market for RENTAL listings here right now (not sales)? A rising rental-DOM trend means longer vacancies and softer asking-rent achievability than the comps imply.
- What's the recent tenant-quality profile in this submarket — average credit score on applications, eviction rate, late-payment / NSF rate, and stable-employment percentage? A property-management company in the area should have these aggregated.
- How much new for-sale + rental construction is in the pipeline within 1–3 miles? Heavy new supply typically softens prices + rents 12–24 months out; constrained supply supports both.
Investment metrics
- 1% rule
- 1.08% ✓
- Cap rate
- 8.18%
- Cash-on-cash
- 6.73%
- DSCR
- 1.30
- GRM
- 7.7
CMA / ARV
- ARV (median comp)
- $250,207
- List price
- $177,500
- Delta
- -29.06%
- Verdict
- UNDERPRICED
- Comps
- 20 within 1.0 mi
Show comp detail 12 sales within ~0.75 mi
| Address | Dist | Beds/Ba | Sqft | Sold | Price | $/sf | Match |
|---|---|---|---|---|---|---|---|
| 9383 Woodknoll Way | 0.24mi | 3/2.0 | 1,764 (-11%) | 0mo | $265,000 | $150 | 66 |
| 652 Post Oak Rd | 0.42mi | 4/3.0 (+1) | 2,005 (+1%) | 10mo | $160,000 | $80 | 65 |
| 396 Independence Dr | 0.36mi | 4/3.0 (+1) | 1,920 (-3%) | 12mo | $289,000 | $151 | 63 |
| 337 Independence Dr | 0.48mi | 4/3.0 (+1) | 1,884 (-5%) | 3mo | $270,000 | $143 | 62 |
| 381 Fleming Ct | 0.25mi | 3/2.5 | 2,208 (+12%) | 12mo | $250,000 | $113 | 57 |
| 548 Thomas Downs Way | 0.52mi | 3/2.5 | 1,872 (-6%) | 10mo | $259,900 | $139 | 57 |
| 9041 Southcrest Ct | 0.57mi | 3/2.5 | 1,924 (-3%) | 13mo | $168,000 | $87 | 56 |
| 453 Camp Hill Ln | 0.51mi | 3/2.5 | 1,743 (-12%) | 6mo | $240,000 | $138 | 49 |
| 254 Wood Duck Dr | 0.74mi | 3/2.5 | 2,058 (+4%) | 11mo | $272,000 | $132 | 48 |
| 301 Deerfield Dr | 0.59mi | 4/2.0 (+1) | 1,785 (-10%) | 1mo | $194,000 | $109 | 46 |
| 895 Corinth Dr | 0.71mi | 3/2.0 | 1,840 (-7%) | 7mo | $260,000 | $141 | 45 |
| 8878 Raven Dr | 0.75mi | 4/2.0 (+1) | 1,754 (-11%) | 10mo | $256,000 | $146 | 28 |
Match score weights: distance 35% · size 25% · config 20% · recency 20%. Top-matched comps best support the ARV.
Projected returns pro-forma
-3.0% appreciation · 2.06% rent growth · sell at horizon
- IRR
- -7.0%
- Equity multiple
- 0.74×
- Total profit
- $-12,773
- Equity at exit
- $26,466
- IRR
- 1.4%
- Equity multiple
- 1.09×
- Total profit
- $4,648
- Equity at exit
- $15,347
Cash invested: $49,700 (down + closing). Projections, not guarantees.
Landlord ↔ Tenant lean methodology
- Overall (STATE)
- 90 Strongly Landlord-Friendly
- State Georgia
- 90 Strongly Landlord-Friendly · R+3
- County
- — inherits STATE
- City
- — inherits STATE
ZIP-level market 30238
- Home prices YoY
- -33.3%
- Rents YoY
- 2.1%
- Active inventory
- 251
- Price-to-rent
- 7.7×
Monthly cashflow live
- Estimated rent
- $1,913 high interval (Pro) →
- Mortgage (P&I)
- −$931
- Tax from tax record
- −$228 /mo · $2,736/yr
- Insurance
- −$74
- HOA
- −$0
- Vacancy / Maint / Mgmt
- −$402
- Net cashflow
- $279
Break-even live
UW: 25.0% down · 7.5% · 30yr · 1.5% tax · 5.0% vac · 8.0% maint · 8.0% mgmt
Financing live
Cash to close
- Down payment
- $44,375
- Closing costs
- $5,325
- Reserves months
- —
- Total cash needed
- —
Loan-product check · same deal, 3 products live
Conventional
25% down · 7.5% · 30yr
- Down + closing
- —
- Monthly P&I
- —
- Monthly cashflow
- —
- DSCR
- —
- Eligible?
- —
Personal DTI + credit; lowest rate.
DSCR
20% down · 8.5% · 30yr
- Down + closing
- —
- Monthly P&I
- —
- Monthly cashflow
- —
- DSCR
- —
- Eligible?
- —
No personal income docs; deal must DSCR.
Hard money
10% down · 12.0% · 12mo
- Down + closing
- —
- Monthly P&I
- —
- Monthly cashflow
- —
- DSCR
- —
- Eligible?
- —
Short-term bridge; refi at stabilization.
Rent comps 40 comps
| Address | Beds | Baths | Sqft | Rent | $/sqft | DOM | Units | Dist |
|---|---|---|---|---|---|---|---|---|
| 9265 Forest Knoll Dr Jonesboro, GA | 3.0 | 2.0 | 1272 | $2,400 | $1.89 | 43d | 1 | 0.07mi |
| 9375 Woodknoll Way Jonesboro, GA | 3.0 | 2.0 | 1558 | $1,841 | $1.18 | 43d | 1 | 0.19mi |
| 9370 Woodloop Ct Jonesboro, GA | 3.0 | 2.0 | 1353 | $1,781 | $1.32 | 43d | 1 | 0.23mi |
| 9360 Thomas Rd Jonesboro, GA | 3.0 | 2.0 | 1400 | $1,700 | $1.21 | 24d | 1 | 0.27mi |
| 505 Brookfield Way Jonesboro, GA | 3.0 | 2.0 | 1400 | $1,655 | $1.18 | 24d | 1 | 0.33mi |
| 423 Brookfield Way Jonesboro, GA | 3.0 | 2.0 | 1400 | $1,745 | $1.25 | 19d | 1 | 0.37mi |
| 566 Brookfield Way Jonesboro, GA | 3.0 | 2.0 | 1432 | $1,500 | $1.05 | 43d | 1 | 0.39mi |
| 9432 Cypress Ln Jonesboro, GA | 2.0 | 2.0 | 1253 | $1,550 | $1.24 | 24d | 1 | 0.39mi |
| 9432 Cypress Ln Jonesboro, GA | 2.0 | 2.0 | 1253 | $1,550 | $1.24 | 15d | 1 | 0.39mi |
| 640 Post Oak Rd Jonesboro, GA | 3.0 | 2.0 | 1508 | $1,780 | $1.18 | 5d | 1 | 0.43mi |
| 672 Raven Ct Jonesboro, GA | 3.0 | 2.0 | 1362 | $1,645 | $1.21 | 43d | 1 | 0.44mi |
| 9471 Bogey Ct Jonesboro, GA | 3.0 | 2.5 | 1560 | $2,143 | $1.37 | 5d | 1 | 0.47mi |
| 461 Camp Hill Ln Jonesboro, GA | 3.0 | 2.5 | 2160 | $1,825 | $0.84 | 22d | 1 | 0.48mi |
| 655 Post Oak Rd Jonesboro, GA | 3.0 | 1.0 | 1302 | $1,600 | $1.23 | 15d | 1 | 0.48mi |
| 9439 Sleepy Hollow Ln Jonesboro, GA | 4.0 | 3.0 | 1500 | $1,745 | $1.16 | 24d | 1 | 0.49mi |
| 9430 Sleepy Hollow Ln Jonesboro, GA | 3.0 | 2.0 | 1320 | $1,680 | $1.27 | 5d | 1 | 0.50mi |
| 372 Cheri Pl Jonesboro, GA | 3.0 | 2.0 | 1468 | $1,749 | $1.19 | 24d | 1 | 0.54mi |
| 688 River Mist Dr Jonesboro, GA | 4.0 | 3.0 | 2137 | $1,995 | $0.93 | 12d | 1 | 0.54mi |
| 9039 Raven Dr Jonesboro, GA | 4.0 | 2.0 | 1560 | $1,795 | $1.15 | 43d | 1 | 0.55mi |
| 191 Marsh Glen Dr Jonesboro, GA | 4.0 | 3.0 | 1550 | $2,131 | $1.37 | 4d | 1 | 0.62mi |
| 575 Oak Trace Ct Jonesboro, GA | 3.0 | 2.0 | 1302 | $1,761 | $1.35 | 43d | 1 | 0.68mi |
| 9206 Fairway Ct Riverdale, GA | 3.0 | 2.0 | 1353 | $1,690 | $1.25 | 43d | 1 | 0.69mi |
| 9602 Sleepy Hollow Ln Jonesboro, GA | 3.0 | 2.0 | 1404 | $1,600 | $1.14 | 43d | 1 | 0.75mi |
| 9138 Clubhouse Dr Riverdale, GA | 3.0 | 2.0 | 1312 | $1,850 | $1.41 | 24d | 1 | 0.77mi |
| 9245 Club View Trce Riverdale, GA | 3.0 | 2.0 | 1588 | $1,861 | $1.17 | 2d | 1 | 0.77mi |
| 205 Inverness Trce Riverdale, GA | 3.0 | 2.0 | 1490 | $1,719 | $1.15 | 43d | 1 | 0.77mi |
| 8837 Wesley Pl Jonesboro, GA | 4.0 | 2.0 | 1899 | $2,041 | $1.07 | 43d | 1 | 0.78mi |
| 161 Sterling Ridge Dr Riverdale, GA | 4.0 | 2.0 | 1686 | $1,495 | $0.89 | 24d | 1 | 0.82mi |
| 432 Wesley Park Dr Jonesboro, GA | 3.0 | 2.0 | 1350 | $1,685 | $1.25 | 24d | 1 | 0.83mi |
| 8983 Habersham Dr Jonesboro, GA | 4.0 | 2.0 | 1770 | $1,910 | $1.08 | 44d | 1 | 0.84mi |
| 90 Inverness Trce Riverdale, GA | 3.0 | 2.0 | 1393 | $1,670 | $1.20 | 12d | 1 | 0.85mi |
| 57 Inverness Trce Jonesboro, GA | 3.0 | 2.5 | 1452 | $1,850 | $1.27 | 43d | 1 | 0.86mi |
| 561 Chatham Trl Jonesboro, GA | 4.0 | 2.5 | 2142 | $2,275 | $1.06 | 22d | 1 | 0.86mi |
| 9170 Dorsey Rd Riverdale, GA | 4.0 | 2.0 | 1358 | $1,500 | $1.10 | 12d | 1 | 0.92mi |
| 9700 Pintail Trl Jonesboro, GA | 3.0 | 2.5 | 1529 | $1,900 | $1.24 | 24d | 1 | 0.93mi |
| 779 Edenton Ct Jonesboro, GA | 3.0 | 2.5 | 2165 | $1,700 | $0.79 | 19d | 1 | 1.11mi |
| 8669 Thomas Rd Riverdale, GA | 3.0 | 2.5 | 1532 | $1,623 | $1.06 | 43d | 1 | 1.13mi |
| 8584 Guthrie Dr Riverdale, GA | 3.0 | 2.0 | 1445 | $1,650 | $1.14 | 15d | 1 | 1.15mi |
| 8620 Guthrie Dr Riverdale, GA | 4.0 | 2.5 | 2498 | $2,406 | $0.96 | 5d | 1 | 1.16mi |
| 8644 Thomas Ln Riverdale, GA | 3.0 | 2.5 | 1530 | $1,623 | $1.06 | 43d | 1 | 1.19mi |
Listing history 16 events
-
2026-06-16days on market $177,500 Active 89 DOM
-
2026-06-15days on market $177,500 Active 88 DOM
-
2026-06-13days on market $177,500 Active 86 DOM
-
2026-06-09days on market $177,500 Active 82 DOM
-
2026-06-08days on market $177,500 Active 81 DOM
-
2026-06-07days on market $177,500 Active 80 DOM
-
2026-06-04days on market $177,500 Active 77 DOM
-
2026-06-03days on market $177,500 Active 76 DOM
-
2026-06-02days on market $177,500 Active 75 DOM
-
2026-06-01days on market $177,500 Active 74 DOM
-
2026-05-31days on market $177,500 Active 73 DOM
-
2026-04-29price $177,500 207-char remark
Show marketing remark (207 chars)
4 bedroom, 2.5 bath two story on quiet dead end street in Jonesboro. 1980 sq.ft. plus double garage. Large family room with fireplace. This is a cash or rehab loan only. Sold as-is with no seller disclosure.
-
2026-03-19$192,400 New 207-char remark
Show marketing remark (207 chars)
4 bedroom, 2.5 bath two story on quiet dead end street in Jonesboro. 1980 sq.ft. plus double garage. Large family room with fireplace. This is a cash or rehab loan only. Sold as-is with no seller disclosure.
-
2021-11-30historical
-
2021-11-30$138,000
-
2021-11-30historical
ⓘ Source: listings_history table (triggers on properties + properties_extension) + one-shot
backfill from property_details.listing_events for pre-trigger history.
Tax reassessment forecast GA · Resets to sale price
- Current annual tax
- $2,736 · $228/mo
- Projected year-2 tax
- $2,736 · $228/mo
- Expected delta
- $0/yr ($0/mo · 0.0%)
ⓘ Screening estimate from a state-policy table — verify with the county assessor before closing.
Climate risk First Street
- Flood 1/10 Low FEMA zone X (unshaded) · 0% chance over 30 yrs
- Wildfire 1/10 Low
- Heat 6/10 Major 7 d/yr ≥105°F today · 18 d/yr by 30 yrs out
- Wind 6/10 Major 27% chance of damaging wind over 30 yrs
- Air quality 4/10 Moderate 4 unhealthy d/yr today · 6 by 30 yrs out
Nearby sold comps map
Loading sold comps map…
Walkable amenities ~0.75 mi
Loading nearby amenities…
Taxation est. · year 1
- Rental income
- $22,959
- − Mortgage interest
- −$9,943
- − Property taxes
- −$2,736
- − Insurance
- −$888
- − Repairs & maintenance
- −$1,837
- − Management
- −$1,837
- − Depreciation
- −$5,164
- Taxable income
- $556
- Est. tax owed @ 24.0%
- −$133
- After-tax cash flow
- $3,211/yr
For passive investors: Depreciation is non-cash, so a rental often shows a tax loss while cash-flowing — sheltering income. Rental losses are passive: they offset passive income freely, and up to $25,000/yr can offset ordinary (W-2) income if you actively participate and your MAGI is under $100k (phasing out to $0 by $150k); unused losses carry forward. On sale, claimed depreciation is recaptured at up to 25%, and gains may owe capital-gains tax (a 1031 exchange can defer both). Figures are a year-1 estimate at your 24.0% rate — not tax advice; consult a CPA.
Schools (NCES district)
- District
- Clayton County
- NCES district ID
- 1301230
- Math proficiency
- 11% ▼ -13.00%
- Reading proficiency
- 20% ▼ -9.00%
- Median HH income
- $42,266
- Composite
- 13.41/100
- National rank
- #9527
- State rank
- #155 of 174 in GA
Livability — Jonesboro
- Score
- 72/100
- State rank
- #63
- US rank
- #6030
Category grades
Schools grade is shown separately in the Schools card above.
Census & demographics
- County
- Clayton County · 230,153 people
- City population
- 93,280
- Metro
- Atlanta-Sandy Springs-Alpharetta, GA
- Population (ZIP)
- 43,191
- Household income
- $62,185
- Rent vs Own
- Severe rent burden
- 1992.0
Population outlook (Clayton County) Hauer SSP2
- Today (2025)
- 310,777 people
- By 2030
- 329,762 · +6.1%
- By 2040
- 368,052 · +18.4%
- By 2050
- 401,196 · +29.1%
- By 2075
- 472,488 · +52.0%
- By 2100
- 500,446 · +61.0%
Race, ethnicity, and origin ACS 2023
- Neighborhood character
- Predominantly Black (71%)
- Race & ethnicity
- Black 71% Hispanic / Latino 17% White 7% Two or more races 7%
- Hispanic origin (detail)
- Mexican 13% Puerto Rican 2%
- Foreign-born
- 11% · Canada, United Kingdom
- Languages at home
- 83% English-only · Spanish 14% French/Haitian/Cajun 1%
Political lean MEDSL · Clayton
- 2024 margin
- Solid D (+69.2) · D 84.3% · R 15.1%
- 2008→2024 swing
- +2.8pp toward D · 2008: 66.4pp · 2024: 69.2pp
- All cycles
- 2024: D+69.2 2020: D+70.9 2016: D+71.9 2012: D+70.1 2008: D+66.4
Not yet ingested
- Civics
- —
Market trends
- HPI YoY
- ▼ -105.48%
- Current HPI
- 211.6309
- Rent YoY
- ▲ 2.06%
- Metro
- Atlanta-Sandy Springs-Alpharetta, GA
- State GDP YoY
- ▲ 2.66%
- F500 in state
- 28
Industry mix (Fortune 500 HQ in GA)
| Industry | F500 HQs | Revenue |
|---|---|---|
| Paper / Packaging | 2 | $29B |
|
||
| Retail | 1 | $160B |
|
||
| Transportation / Logistics | 1 | $91B |
|
||
| Airlines | 1 | $62B |
|
||
| Consumer Goods | 1 | $47B |
|
||
| Utilities | 1 | $25B |
|
||
Price history
+28.6% since first listed5 events — show timeline
- 2026-04-29 Price Changed $177,500 GAMLS
- 2026-03-19 Listed $192,400 GAMLS
- 2021-11-30 Listing Removed — GAMLS
- 2021-11-30 Listed $138,000 GAMLS
- 2021-11-30 Listing Removed — GAMLS
Property tax history
+3.8%/yrLatest (2025): $2,736 · -1.8% YoY. Source: county tax records.
Cash-flow waterfall
monthlySold comps — $/sqft
last 12 mo · ≤1 miLoading sold comps…