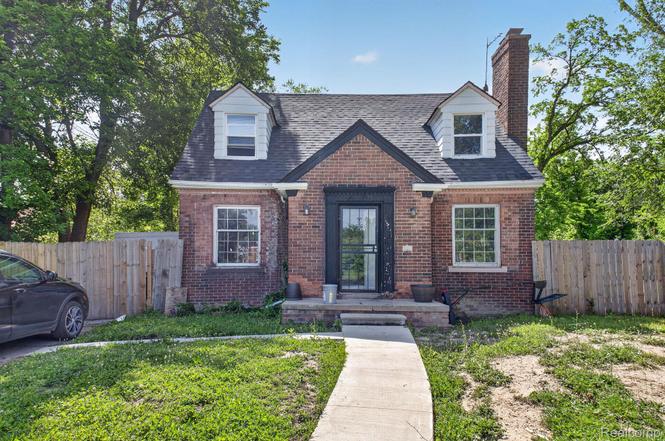
14949 Coyle St · Detroit, MI
Flood risk 1/10 · Minimal
- FEMA flood zone
- X (unshaded)
- Chance of flooding over 30 yrs
- 0.0%
- Est. flood insurance / yr
- $473 – $860
Fire risk 1/10 · Minimal
- Est. fire insurance / yr
- $784 – $1,456
Heat risk 3/10 · Minor
- Hot days now (above 98°F)
- 7 days/yr
- Hot days in 30 yrs
- 15 days/yr
Wind risk 2/10 · Minimal
- Chance of severe wind over 30 yrs
- —
Air-quality risk 3/10 · Minor
- Unhealthy air days now
- 2 days/yr
- Unhealthy air days in 30 yrs
- 5 days/yr
Risk factors via First Street. Map © Google.
Why this score? — see what drove the F grade
The composite is a weighted blend of 9 inputs, each scored 0–100. Each bar is that input's sub-score; the figure is the points it added to the 100-point composite (weight × sub-score).
- Cash flow +8.6/30.0
- ARV discount +7.5/15.0
- 1% rule +4.9/10.0
- Rent growth +3.9/5.0
- Livability +3.7/5.0
- Condition / age +2.5/5.0
- DSCR +2.4/10.0
- Schools +1.3/10.0
- Appreciation +0.0/10.0
$135,000
🖨 Deal sheet (PDF) 📄 Offer letter ✓ Due diligence
Listing remarks MLS
Looking for extra space and added value? This 3-bedroom, 1 full bath, 2 half bath brick home delivers both! Featuring generous living space, spacious bedrooms, and a layout designed for comfortable living, this home is ready for its next owner. The adjacent side lot will be quitclaimed to the buyer with the purchase of the property, giving you additional outdoor space and endless possibilities. Whether you're looking to call it home or add to your investment portfolio, this is an opportunity you don't want to miss. 72 HOURS NOTICE!!! Schedule your showing today! BATVAI!!!
Key facts
- 7,841 sq ft lot
- 2 garage spots
- Built 1939
Property features AI
Exterior
- Parking: Detached 2-car garage
- Utilities: Public water; Public sewer
- Home design: Single-family residence; One and one-half stories; Ground-level entry with steps; Brick exterior
- Construction: Brick construction
- Exterior features: Paved road access; Lot dimensions approximately 60 x 131.77 (0.18 acres)
Interior
- Bathrooms: One full bathroom
- Heating & cooling: Forced air heating (natural gas); No central air conditioning
- Interior features: Finished basement; Five total rooms
Neighborhood map
What this means for you Summary
Snapshot
- This is a 3-bed/1.0-bath single-family listed at $135k.
Deal economics
- At list price, monthly cash flow is $-115 ($-1k/yr) — negative.
- To cash-flow at today's rent, offer at most $115k (15.1% below list).
- To meet the 1% rule (rent ≥ 1% of price), the offer needs to be $134k (0.9% below list).
- Recommended offer: $115k (15.1% below list) — sets the bar for cash-flow.
- Cap rate 5.3% vs local median 10.0% in Detroit — below-typical yield; the buyer is paying a premium for something (appreciation thesis, condition, location) that the cap rate doesn't capture.
Location & tenants
- Location reads 73/100 on livability (#218 in MI) — a middle-class / working-renter tenant base. Strengths: amenities A+, commute A+, cost of living A+; Watch: crime F, employment F.
- Detroit Public Schools Community District (urban): math 10% / reading 24% proficiency, ranked #499 of 540 in MI (top 92%) — low school quality limits family demand, transient renter base, plan for 1-2y turnover; 90% free/reduced lunch — lower-income household profile, screen leases tightly.
- Zoned schools: Burns Elementarymiddle School (math 2% / reading 8%, grade F, #1,325 of 1,397 statewide, top 99%, 382 students, 93% FRL); Cody High School (math 24% / reading 24%, grade F, #481 of 713 statewide, top 81%, 466 students, 88% FRL) — zoned schools at 90% FRL track the district average.
- Market conditions: Rents rising fast (+5.6%/yr); 392 active listings in the ZIP; 40 comparable units currently listed for rent nearby; rentals at typical pace (median 22d on market — plan ~3-4 weeks tenant-placement turnaround); lower-income renter base — watch delinquency; 2,639 units permitted in Wayne County in 2024 (1,216 in 5+ unit buildings).
- This rent runs 44% of the median local income ($37k/yr) — at the standard rent-burdened threshold; future hikes will face affordability resistance.
Forward outlook
- Local home prices are declining (-3.0%/yr); year-one equity from $933 of loan paydown is wiped out by about $4k of value loss. Plan a longer hold.
- Wayne County population projected at -17% by 2050 — secular population decline; favor cash flow + early exit over multi-decade hold.
Negotiation context
- Only 6 days on market — expect competitive offers; lowballing is unlikely to land.
- 4 sale attempts since 13y ago with the ask held roughly flat each time — persistent listings suggest the price (not the market) is what's stuck; bring a comps-based counter.
- Current owner paid $3k; list at $135k implies a 4182% gain — meaningful room to come down on a strong offer.
Risks & watch-outs
- Watch-outs: property tax is 3.6% of price; built in 1939 — expect roof / HVAC / electrical / plumbing capex.
Questions for the listing agent
- What do current leases actually rent for vs. the listed asking? Can we see a recent rent roll and the last 12 months of T-12 income?
- Built in 1939 — when were the roof, HVAC, electrical panel, plumbing, and water heater last replaced?
- Property tax is high relative to price — has the assessment been appealed recently, and will the sale trigger a re-assessment?
- Is there a deadline driving the sale (1031 exchange, divorce, estate, relocation)? That informs how much negotiation room exists.
- Schools are F-rated, which usually means shorter tenancies and higher turnover. Who's the typical renter profile here, and what's been the actual vacancy rate?
- Crime grade is F in this area — have there been break-ins, vandalism, or insurance claims at this property in the last 3 years? What carrier currently insures it and at what premium?
- The area grade is low — what's the realistic commute time and amenity access for the typical tenant pool here? Any planned neighborhood developments (good or bad) we should know about?
- What's the average days-on-market for RENTAL listings here right now (not sales)? A rising rental-DOM trend means longer vacancies and softer asking-rent achievability than the comps imply.
- What's the recent tenant-quality profile in this submarket — average credit score on applications, eviction rate, late-payment / NSF rate, and stable-employment percentage? A property-management company in the area should have these aggregated.
- How much new for-sale + rental construction is in the pipeline within 1–3 miles? Heavy new supply typically softens prices + rents 12–24 months out; constrained supply supports both.
Investment metrics
- 1% rule
- 0.99% ✗
- Cap rate
- 5.27%
- Cash-on-cash
- -3.66%
- DSCR
- 0.84
- GRM
- 8.4
CMA / ARV
- ARV (on-the-fly)
- $61,664
- Comps found
- 12
Show comp detail 12 sales within ~0.75 mi
| Address | Dist | Beds/Ba | Sqft | Sold | Price | $/sf | Match |
|---|---|---|---|---|---|---|---|
| 15328 Prest St E | 0.28mi | 3/1.5 | 1,298 (-1%) | 3mo | $66,999 | $52 | 80 |
| 14644 Hubbell St | 0.33mi | 3/1.0 | 1,248 (-5%) | 2mo | $45,000 | $36 | 75 |
| 14736 Mansfield St | 0.57mi | 3/1.0 | 1,318 (+0%) | 0mo | $62,000 | $47 | 73 |
| 14232 Lauder St | 0.55mi | 3/1.0 | 1,272 (-3%) | 2mo | $60,000 | $47 | 67 |
| 15868 Whitcomb St | 0.64mi | 3/1.0 | 1,332 (+2%) | 2mo | $95,000 | $71 | 66 |
| 15771 Rutherford St | 0.74mi | 3/1.0 | 1,289 (-2%) | 1mo | $55,106 | $43 | 62 |
| 15727 Mansfield St | 0.74mi | 3/1.5 | 1,300 (-1%) | 3mo | $55,000 | $42 | 59 |
| 15748 Freeland St | 0.68mi | 3/1.0 | 1,243 (-5%) | 4mo | $78,000 | $63 | 56 |
| 15316 Prevost St NE | 0.49mi | 2/1.5 (-1) | 1,193 (-9%) | 2mo | $157,000 | $132 | 54 |
| 14400 Hubbell St | 0.46mi | 4/1.5 (+1) | 1,444 (+10%) | 4mo | $108,000 | $75 | 51 |
| 15763 Robson St | 0.54mi | 2/1.5 (-1) | 1,485 (+13%) | 3mo | $58,500 | $39 | 44 |
| 14321 Ardmore St | 0.65mi | 2/2.0 (-1) | 1,188 (-10%) | 2mo | $11,000 | $9 | 44 |
Match score weights: distance 35% · size 25% · config 20% · recency 20%. Top-matched comps best support the ARV.
Projected returns pro-forma
-3.0% appreciation · 5.59% rent growth · sell at horizon
- IRR
- -18.7%
- Equity multiple
- 0.33×
- Total profit
- $-25,480
- Equity at exit
- $20,129
- IRR
- -5.5%
- Equity multiple
- 0.59×
- Total profit
- $-15,487
- Equity at exit
- $11,672
Cash invested: $37,800 (down + closing). Projections, not guarantees.
Landlord ↔ Tenant lean methodology
- Overall (STATE)
- 62 Landlord-Friendly
- State Michigan
- 62 Landlord-Friendly · EVEN
- County
- — inherits STATE
- City
- — inherits STATE
ZIP-level market 48227
- Rents YoY
- 5.6%
- Active inventory
- 392
- Price-to-rent
- 8.4×
Monthly cashflow live
- Estimated rent
- $1,338 high interval (Pro) →
- Mortgage (P&I)
- −$708
- Tax from tax record
- −$409 /mo · $4,902/yr
- Insurance
- −$56
- HOA
- −$0
- Vacancy / Maint / Mgmt
- −$281
- Net cashflow
- $-115
Break-even live
Sensitivity live
| Price | -10% $-39 | -5% $-77 | +0% $-115 | +5% $-154 | +10% $-192 |
|---|---|---|---|---|---|
| Rent | -10% $-221 | -5% $-168 | +0% $-115 | +5% $-63 | +10% $-10 |
| Rate | -1.0pp $-47 | -0.5pp $-81 | base $-115 | +0.5pp $-150 | +1.0pp $-186 |
UW: 25.0% down · 7.5% · 30yr · 1.5% tax · 5.0% vac · 8.0% maint · 8.0% mgmt
Financing live
Cash to close
- Down payment
- $33,750
- Closing costs
- $4,050
- Reserves months
- —
- Total cash needed
- —
Loan-product check · same deal, 3 products live
Conventional
25% down · 7.5% · 30yr
- Down + closing
- —
- Monthly P&I
- —
- Monthly cashflow
- —
- DSCR
- —
- Eligible?
- —
Personal DTI + credit; lowest rate.
DSCR
20% down · 8.5% · 30yr
- Down + closing
- —
- Monthly P&I
- —
- Monthly cashflow
- —
- DSCR
- —
- Eligible?
- —
No personal income docs; deal must DSCR.
Hard money
10% down · 12.0% · 12mo
- Down + closing
- —
- Monthly P&I
- —
- Monthly cashflow
- —
- DSCR
- —
- Eligible?
- —
Short-term bridge; refi at stabilization.
Rent comps 40 comps
| Address | Beds | Baths | Sqft | Rent | $/sqft | DOM | Units | Dist |
|---|---|---|---|---|---|---|---|---|
| 14814 Sussex St Unit 2 Detroit, MI | 3.0 | 1.0 | 1100 | $1,000 | $0.91 | 45d | 1 | 0.13mi |
| 14893 Prest St Detroit, MI | 3.0 | 1.0 | 1100 | $1,000 | $0.91 | 16d | 1 | 0.20mi |
| 15330 Coyle St Unit 1 Detroit, MI | 3.0 | 1.0 | 1000 | $1,425 | $1.43 | 14d | 1 | 0.23mi |
| 15330 Coyle St Unit 1 Detroit, MI | 3.0 | 1.0 | 1000 | $1,375 | $1.38 | 26d | 1 | 0.23mi |
| 15330 Coyle St Unit 2 Detroit, MI | 3.0 | 1.0 | 1000 | $1,450 | $1.45 | 26d | 1 | 0.23mi |
| 15328 Coyle St Detroit, MI | 3.0 | 1.0 | 1000 | $1,450 | $1.45 | 19d | 1 | 0.23mi |
| 15341 Lauder St Detroit, MI | 4.0 | 1.5 | 1080 | $1,475 | $1.37 | 18d | 1 | 0.27mi |
| 15468 Sussex St #2 Detroit, MI | 2.0 | 1.0 | 900 | $1,250 | $1.39 | 45d | 1 | 0.38mi |
| 14559 Strathmoor St Detroit, MI | 2.0 | 1.0 | 1033 | $1,150 | $1.11 | 22d | 1 | 0.40mi |
| 14600 Strathmoor St Detroit, MI | 4.0 | 1.0 | 1300 | $1,450 | $1.12 | 45d | 1 | 0.40mi |
| 14375 Terry St Detroit, MI | 3.0 | 2.0 | 1300 | $1,425 | $1.10 | 45d | 1 | 0.41mi |
| 14615 Winthrop St Detroit, MI | 2.0 | 1.0 | 1217 | $1,300 | $1.07 | 18d | 1 | 0.42mi |
| 14580 Forrer St Unit Unit Detroit, MI | 2.0 | 1.0 | 1300 | $900 | $0.69 | 21d | 1 | 0.45mi |
| 14836 Rutherford St Unit 2 Detroit, MI | 2.0 | 1.0 | 1104 | $950 | $0.86 | 45d | 1 | 0.51mi |
| 14264 Coyle St Detroit, MI | 2.0 | 1.0 | 1000 | $1,150 | $1.15 | 45d | 1 | 0.51mi |
| 16014 Hackett St Detroit, MI | 4.0 | 2.0 | 1142 | $1,500 | $1.31 | 45d | 1 | 0.53mi |
| 14590 Ardmore St Detroit, MI | 3.0 | 1.0 | 1200 | $1,195 | $1.00 | 4d | 1 | 0.55mi |
| 15375 Prevost St Detroit, MI | 4.0 | 1.0 | 907 | $1,300 | $1.43 | 18d | 1 | 0.55mi |
| 15810 Robson St Detroit, MI | 3.0 | 1.0 | 1142 | $1,500 | $1.31 | 26d | 1 | 0.58mi |
| 14104 Coyle St Detroit, MI | 3.0 | 1.0 | 1327 | $1,350 | $1.02 | 6d | 1 | 0.64mi |
| 15332 Saint Marys St Detroit, MI | 3.0 | 1.0 | 1200 | $1,200 | $1.00 | 18d | 1 | 0.65mi |
| 15762 Mark Twain St Detroit, MI | 3.0 | 2.0 | 1430 | $1,250 | $0.87 | 18d | 1 | 0.66mi |
| 14753 Saint Marys St Detroit, MI | 2.0 | 1.0 | 900 | $1,150 | $1.28 | 6d | 1 | 0.67mi |
| 14753 Saint Marys St Detroit, MI | 2.0 | 1.0 | 900 | $1,150 | $1.28 | 14d | 1 | 0.67mi |
| 14504 Saint Marys St Detroit, MI | 4.0 | 1.0 | 1362 | $1,473 | $1.08 | 45d | 1 | 0.68mi |
| 14903 Tracey St Detroit, MI | 3.0 | 1.0 | 1004 | $1,100 | $1.10 | 18d | 1 | 0.70mi |
| 15752 Rutherford St Detroit, MI | 3.0 | 2.0 | 1174 | $1,386 | $1.18 | 6d | 1 | 0.70mi |
| 15387 Lesure St Detroit, MI | 3.0 | 1.0 | 1064 | $1,350 | $1.27 | 14d | 1 | 0.71mi |
| 14284 Cruse St Detroit, MI | 3.0 | 1.0 | 1121 | $1,150 | $1.03 | 18d | 1 | 0.74mi |
| 16151 Robson St Detroit, MI | 3.0 | 1.0 | 1300 | $1,525 | $1.17 | 16d | 1 | 0.74mi |
| 14535 Mettetal St Unit 1 Detroit, MI | 2.0 | 1.0 | 965 | $1,000 | $1.04 | 45d | 1 | 0.75mi |
| 14800 Woodmont Ave Detroit, MI | 3.0 | 2.0 | 1612 | $1,525 | $0.95 | 16d | 1 | 0.75mi |
| 15517 Lesure St Unit BDRM1A Detroit, MI | 2.0 | 1.0 | 1000 | $850 | $0.85 | 26d | 1 | 0.78mi |
| 14510 Asbury Park Detroit, MI | 2.0 | 1.0 | 1771 | $1,250 | $0.71 | 45d | 1 | 0.78mi |
| 14891 Hartwell St Detroit, MI | 3.0 | 1.0 | 1000 | $1,150 | $1.15 | 45d | 1 | 0.81mi |
| 15866 Mansfield St Detroit, MI | 3.0 | 1.0 | 1324 | $1,425 | $1.08 | 26d | 1 | 0.84mi |
| 15340 Hartwell St Detroit, MI | 2.0 | 1.0 | 900 | $1,300 | $1.44 | 18d | 1 | 0.87mi |
| 15065 Gilchrist St Detroit, MI | 3.0 | 1.0 | 1100 | $1,250 | $1.14 | 45d | 1 | 0.92mi |
| 15736 Biltmore St Detroit, MI | 3.0 | 1.5 | 1000 | $1,200 | $1.20 | 18d | 1 | 0.95mi |
| 15088 Littlefield St Detroit, MI | 2.0 | 1.0 | 1294 | $1,275 | $0.99 | 23d | 1 | 0.95mi |
Listing history 6 events
-
2026-06-21days on market $135,000 Active 6 DOM
-
2026-06-18days on market $135,000 Active 3 DOM
-
2026-06-17days on market $135,000 Active 2 DOM
-
2026-06-16remarks 578-char remark
-
2026-06-15remarks 104-char remark
Show marketing remark (578 chars)
Looking for extra space and added value? This 3-bedroom, 1 full bath, 2 half bath brick home delivers both! Featuring generous living space, spacious bedrooms, and a layout designed for comfortable living, this home is ready for its next owner. The adjacent side lot will be quitclaimed to the buyer with the purchase of the property, giving you additional outdoor space and endless possibilities. Whether you're looking to call it home or add to your investment portfolio, this is an opportunity you don't want to miss. 72 HOURS NOTICE!!! Schedule your showing today! BATVAI!!!
-
2026-06-15$135,000 Active 1 DOM
Show marketing remark (578 chars)
Looking for extra space and added value? This 3-bedroom, 1 full bath, 2 half bath brick home delivers both! Featuring generous living space, spacious bedrooms, and a layout designed for comfortable living, this home is ready for its next owner. The adjacent side lot will be quitclaimed to the buyer with the purchase of the property, giving you additional outdoor space and endless possibilities. Whether you're looking to call it home or add to your investment portfolio, this is an opportunity you don't want to miss. 72 HOURS NOTICE!!! Schedule your showing today! BATVAI!!!
ⓘ Source: listings_history table (triggers on properties + properties_extension) + one-shot
backfill from property_details.listing_events for pre-trigger history.
Tax reassessment forecast MI · Partial reset (capped growth)
- Current annual tax
- $4,902 · $409/mo
- Projected year-2 tax
- $4,902 · $409/mo
- Expected delta
- $0/yr ($0/mo · 0.0%)
ⓘ Screening estimate from a state-policy table — verify with the county assessor before closing.
Climate risk First Street
- Flood 1/10 Low FEMA zone X (unshaded) · 0% chance over 30 yrs
- Wildfire 1/10 Low
- Heat 3/10 Moderate 7 d/yr ≥98°F today · 15 d/yr by 30 yrs out
- Wind 2/10 Low
- Air quality 3/10 Moderate 2 unhealthy d/yr today · 5 by 30 yrs out
Nearby sold comps map
Loading sold comps map…
Walkable amenities ~0.75 mi
Loading nearby amenities…
Taxation est. · year 1
- Rental income
- $16,061
- − Mortgage interest
- −$7,562
- − Property taxes
- −$4,902
- − Insurance
- −$675
- − Repairs & maintenance
- −$1,285
- − Management
- −$1,285
- − Depreciation
- −$3,927
- Taxable loss
- −$3,576
- Est. tax savings @ 24.0%
- +$858
- After-tax cash flow
- $-527/yr
For passive investors: Depreciation is non-cash, so a rental often shows a tax loss while cash-flowing — sheltering income. Rental losses are passive: they offset passive income freely, and up to $25,000/yr can offset ordinary (W-2) income if you actively participate and your MAGI is under $100k (phasing out to $0 by $150k); unused losses carry forward. On sale, claimed depreciation is recaptured at up to 25%, and gains may owe capital-gains tax (a 1031 exchange can defer both). Figures are a year-1 estimate at your 24.0% rate — not tax advice; consult a CPA.
Schools (NCES district)
- District
- Detroit Public Schools Community District
- NCES district ID
- 2601103
- Math proficiency
- 10% ▼ -2.00%
- Reading proficiency
- 24% ▲ 6.00%
- Median HH income
- $25,815
- Composite
- 13.06/100
- National rank
- #9564
- State rank
- #499 of 540 in MI
Livability — Detroit
- Score
- 73/100
- State rank
- #218
- US rank
- #5427
Category grades
Schools grade is shown separately in the Schools card above.
Census & demographics
- Census place
- Detroit, MI
- County
- Wayne County · 1,562,939 people
- City population
- 572,865
- Metro
- Detroit-Warren-Dearborn, MI
- Population (ZIP)
- 40,302
- Household income
- $36,527
- Rent vs Own
- Severe rent burden
- 2371.0
Population outlook (Wayne County) Hauer SSP2
- Today (2025)
- 1,675,273 people
- By 2030
- 1,620,300 · -3.3%
- By 2040
- 1,502,341 · -10.3%
- By 2050
- 1,384,039 · -17.4%
- By 2075
- 1,124,592 · -32.9%
- By 2100
- 881,193 · -47.4%
Race, ethnicity, and origin ACS 2023
- Neighborhood character
- Predominantly Black (95%)
- Race & ethnicity
- Black 95% Two or more races 3% White 1%
- Foreign-born
- 1%
- Languages at home
- 98% English-only · Spanish 1% French/Haitian/Cajun 1%
Political lean MEDSL · Wayne
- 2024 margin
- Strong D (+29.0) · D 62.7% · R 33.7% · Other 3.6%
- 2008→2024 swing
- -20.5pp toward R · 2008: 49.5pp · 2024: 29.0pp
- All cycles
- 2024: D+29.0 2020: D+38.1 2016: D+37.3 2012: D+46.9 2008: D+49.5
Not yet ingested
- Civics
- —
Market trends
- HPI YoY
- ▼ -125.00%
- Current HPI
- 186.4158
- Rent YoY
- ▲ 5.59%
- Metro
- Detroit-Warren-Dearborn, MI
- State GDP YoY
- ▲ 1.37%
- F500 in state
- 28
Industry mix (Fortune 500 HQ in MI)
| Industry | F500 HQs | Revenue |
|---|---|---|
| Automotive Parts | 3 | $48B |
|
||
| Automotive | 2 | $372B |
|
||
| Chemicals | 1 | $45B |
|
||
| Automotive Retail | 1 | $29B |
|
||
| Healthcare / Medical Devices | 1 | $23B |
|
||
| Automotive Technology | 1 | $20B |
|
||
Price history
+6650.0% since first listed8 events — show timeline
- 2026-06-15 Listed $135,000 REALCOMP
- 2026-06-15 Listed $135,000 MiRealSource-MiMLS
- 2013-05-07 Sold (MLS) $3,153 MiRealSource-MiMLS
- 2013-05-07 Sold (MLS) $3,153 REALCOMP
- 2013-03-25 Listing Removed — MiRealSource-MiMLS
- 2013-03-25 Listing Removed — REALCOMP
- 2013-03-13 Listed $2,000 MiRealSource-MiMLS
- 2013-03-13 Listed $2,000 REALCOMP
Property tax history
+27.0%/yrLatest (2025): $4,902 · +0.5% YoY. Source: county tax records.
Cash-flow waterfall
monthlySold comps — $/sqft
last 12 mo · ≤1 miLoading sold comps…