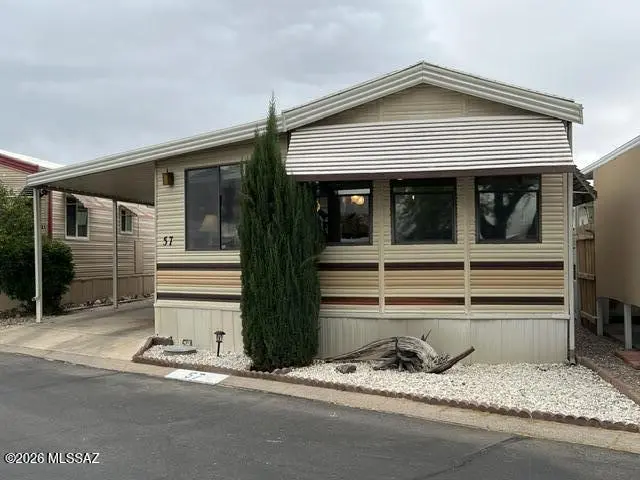
3100 S Kinney Rd #57 · Tucson Estates, AZ
Flood risk 1/10 · Minimal
- FEMA flood zone
- X (unshaded)
- Chance of flooding over 30 yrs
- 0.0%
- Est. flood insurance / yr
- $507 – $1,088
Fire risk 8/10 · Major
- Est. fire insurance / yr
- $610 – $1,132
Heat risk 8/10 · Major
- Hot days now (above 106°F)
- 7 days/yr
- Hot days in 30 yrs
- 19 days/yr
Wind risk 1/10 · Minimal
- Chance of severe wind over 30 yrs
- —
Air-quality risk 1/10 · Minimal
- Unhealthy air days now
- 0 days/yr
- Unhealthy air days in 30 yrs
- 0 days/yr
Risk factors via First Street. Map © Google.
Why this score? — see what drove the B+ grade
The composite is a weighted blend of 9 inputs, each scored 0–100. Each bar is that input's sub-score; the figure is the points it added to the 100-point composite (weight × sub-score).
- Cash flow +30.0/30.0
- ARV discount +15.0/15.0
- 1% rule +10.0/10.0
- DSCR +10.0/10.0
- Condition / age +4.0/5.0
- Livability +3.1/5.0
- Rent growth +2.6/5.0
- Schools +1.6/10.0
- Appreciation +0.0/10.0
$57,500
🖨 Deal sheet 📄 Offer letter ✓ Due diligence
Listing remarks
Welcome to Western Way RV Resort, a vibrant 55+ active adult community nestled in scenic Tucson! This charming, fully furnished 1-bedroom, 1-bath manufactured home offers 550 sq ft of comfortable living with stunning mountain and sunset views. Enjoy modern touches like laminate flooring, stainless steel appliances, a full dining area and a cozy breakfast bar. Relax on the covered deck or patio surrounded by low-care landscaping and a tall fence for privacy. There is also generous covered parking & a storage shed. Community amenities include pickleball, pool, spa, recreation room, exercise facilities, laundry facilities, water, sewer, garbage and much much more.
Key facts
- Garage
- Community pool
- Built 1987
Property features AI
Finance
- Other: Zoned Pima County - TH
- HOA & community: Community pool; Community spa / hot tub; Fitness center; Recreation/rec center; Pickleball courts; Paved streets; Association maintenance provided; Association fees include common area maintenance, sewer, street maintenance, and water
Exterior
- Parking: Attached garage; Covered carport space (1)
- Security: Smoke detector(s)
- Utilities: Public water; Sewer connected
- Home design: Manufactured home; One story; Faces west; Entry level: one
- Construction: Frame and siding construction; Metal siding; Metal roof; Built on foundation (manufactured-home construction materials)
- Exterior features: Covered patio; Deck; Patio; Wood fencing; Shed(s); Decorative gravel; Shrubs; East/West exposure; Paved road
Interior
- Kitchen: Refrigerator; Electric range; Microwave
- Flooring: Carpet; Laminate
- Bathrooms: 1 full bathroom
- Heating & cooling: Heat pump (heating and cooling); Has heating; Has cooling
- Interior features: Kitchen island
Neighborhood map
What this means for you Summary
Snapshot
- This is a 1-bed/1.0-bath manufactured listed at $58k. Condition is rated good.
Deal economics
- At list price, monthly cash flow is $354 ($4k/yr) — positive.
- The deal already cash-flows at list — no discount required.
- Meets the 1% rule at list price ($951 rent vs $58k).
- Recommended offer: $56k (3.0% below list) — sets the bar for market timing.
- Cap rate 13.7% vs local median 4.4% in Tucson Estates — top-decile yield for the area; either an underpriced asset or a hidden risk that comps aren't pricing in. Stress-test before assuming the spread holds.
Location & tenants
- Location reads 62/100 on livability (#137 in AZ) — a middle-class / working-renter tenant base. Strengths: cost of living A+, housing A+; Watch: crime D, amenities F, commute F.
- Tucson Unified District (4403) (urban): math 14% / reading 23% proficiency, ranked #190 of 249 in AZ (top 76%) — low school quality limits family demand, transient renter base, plan for 1-2y turnover.
- Zoned schools: Laura N. Banks Elementary (math 8% / reading 22%, grade F, #888 of 1,109 statewide, top 81%, 308 students, 70% FRL); Valencia Middle School (math 3% / reading 11%, grade F, #210 of 218 statewide, top 97%, 722 students, 79% FRL); Cholla High School (math 2% / reading 17%, grade F, #343 of 381 statewide, top 93%, 1,760 students, 62% FRL).
- Market conditions: Rents flat; 264 active listings in the ZIP; 5,268 units permitted in Pima County in 2024 (996 in 5+ unit buildings).
Forward outlook
- Local home prices are declining (-3.0%/yr); year-one equity from $398 of loan paydown is wiped out by about $2k of value loss. Plan a longer hold.
- Pima County population projected at +8% by 2050 — modest demand growth; plan on rents tracking national, not racing it.
- At projected returns (-3.0% appreciation + 0.2% rent growth), your $16k cash investment doubles in ~6 years — after that, you're playing with house money.
Negotiation context
- It's been on market 44 days — a 3% lower offer ($56k) is reasonable based on typical stale-listing flexibility.
Risks & watch-outs
- Climate carrying-cost: severe wildfire risk; extreme-heat days projected 7→19/yr by 2055 (HVAC capex compounding) — expect insurance premiums to compound above CPI over the hold.
Questions for the listing agent
- It's been on market 44 days. Have you received any prior offers? Is the seller open to a 3% concession, seller financing, or rate buy-down credit?
- Is there a deadline driving the sale (1031 exchange, divorce, estate, relocation)? That informs how much negotiation room exists.
- Schools are F-rated, which usually means shorter tenancies and higher turnover. Who's the typical renter profile here, and what's been the actual vacancy rate?
- Crime grade is D in this area — have there been break-ins, vandalism, or insurance claims at this property in the last 3 years? What carrier currently insures it and at what premium?
- What's the average days-on-market for RENTAL listings here right now (not sales)? A rising rental-DOM trend means longer vacancies and softer asking-rent achievability than the comps imply.
- What's the recent tenant-quality profile in this submarket — average credit score on applications, eviction rate, late-payment / NSF rate, and stable-employment percentage? A property-management company in the area should have these aggregated.
- How much new for-sale + rental construction is in the pipeline within 1–3 miles? Heavy new supply typically softens prices + rents 12–24 months out; constrained supply supports both.
Investment metrics
- 1% rule
- 1.65% ✓
- Cap rate
- 13.68%
- Cash-on-cash
- 26.38%
- DSCR
- 2.17
- GRM
- 5.0
CMA / ARV
- ARV (median comp)
- $89,900
- List price
- $57,500
- Delta
- -36.04%
- Verdict
- UNDERPRICED
- Comps
- 5 within 1.0 mi
Show comp detail 7 sales within ~0.75 mi
| Address | Dist | Beds/Ba | Sqft | Sold | Price | $/sf | Match |
|---|---|---|---|---|---|---|---|
| 5716 W Bar X St | 0.42mi | 2/1.0 (+1) | 550 (0%) | 9mo | $68,000 | $124 | 68 |
| 5825 W Bar X St | 0.31mi | 2/2.0 (+1) | 550 (0%) | 16mo | $115,000 | $209 | 63 |
| 6012 W Bar X St | 0.31mi | 2/1.5 (+1) | 600 (+9%) | 3mo | $89,900 | $150 | 61 |
| 5772 W Lazy St S | 0.39mi | 1/1.0 | 624 (+14%) | 3mo | $100,000 | $160 | 57 |
| 5780 W Lazy St S | 0.39mi | 2/2.0 (+1) | 600 (+9%) | 4mo | $155,000 | $258 | 54 |
| 5448 W Lazy St S | 0.73mi | 2/1.0 (+1) | 600 (+9%) | 20mo | $82,500 | $138 | 29 |
| 5509 W Lazy Heart St | 0.66mi | 1/1.5 | 620 (+13%) | 22mo | $130,000 | $210 | 28 |
Match score weights: distance 35% · size 25% · config 20% · recency 20%. Top-matched comps best support the ARV.
Projected returns pro-forma
-3.0% appreciation · 0.21% rent growth · sell at horizon
- IRR
- 17.0%
- Equity multiple
- 1.66×
- Total profit
- $10,643
- Equity at exit
- $8,573
- IRR
- 23.4%
- Equity multiple
- 2.76×
- Total profit
- $28,276
- Equity at exit
- $4,972
Cash invested: $16,100 (down + closing). Projections, not guarantees.
Landlord ↔ Tenant lean methodology
- Overall (STATE)
- 87 Strongly Landlord-Friendly
- State Arizona
- 87 Strongly Landlord-Friendly · R+3
- County
- — inherits STATE
- City
- — inherits STATE
ZIP-level market 85713
- Home prices YoY
- -24.5%
- Rents YoY
- 0.2%
- Active inventory
- 264
- Price-to-rent
- 5.0×
Monthly cashflow live
- Estimated rent
- $951 medium interval (Pro) →
- Mortgage (P&I)
- −$302
- Tax est. 1.5%
- −$72 /mo · $862/yr
- Insurance
- −$24
- HOA
- −$0
- Vacancy / Maint / Mgmt
- −$200
- Net cashflow
- $354
Break-even live
UW: 25.0% down · 7.5% · 30yr · 1.5% tax · 5.0% vac · 8.0% maint · 8.0% mgmt
Financing live
Cash to close
- Down payment
- $14,375
- Closing costs
- $1,725
- Reserves months
- —
- Total cash needed
- —
Loan-product check · same deal, 3 products live
Conventional
25% down · 7.5% · 30yr
- Down + closing
- —
- Monthly P&I
- —
- Monthly cashflow
- —
- DSCR
- —
- Eligible?
- —
Personal DTI + credit; lowest rate.
DSCR
20% down · 8.5% · 30yr
- Down + closing
- —
- Monthly P&I
- —
- Monthly cashflow
- —
- DSCR
- —
- Eligible?
- —
No personal income docs; deal must DSCR.
Hard money
10% down · 12.0% · 12mo
- Down + closing
- —
- Monthly P&I
- —
- Monthly cashflow
- —
- DSCR
- —
- Eligible?
- —
Short-term bridge; refi at stabilization.
Listing history 15 events
-
2026-06-18days on market $57,500 Active 44 DOM
-
2026-06-17days on market $57,500 Active 43 DOM
-
2026-06-16days on market $57,500 Active 42 DOM
-
2026-06-15days on market $57,500 Active 41 DOM
-
2026-06-13days on market $57,500 Active 39 DOM
-
2026-06-10days on market $57,500 Active 36 DOM
-
2026-06-09days on market $57,500 Active 35 DOM
-
2026-06-08days on market $57,500 Active 34 DOM
-
2026-06-07days on market $57,500 Active 33 DOM
-
2026-06-05days on market $57,500 Active 30 DOM
-
2026-06-03days on market $57,500 Active 29 DOM
-
2026-06-02days on market $57,500 Active 28 DOM
-
2026-06-01days on market $57,500 Active 27 DOM
-
2026-05-31days on market $57,500 Active 26 DOM
-
2026-05-05$57,500 Active 675-char remark
ⓘ Source: listings_history table (triggers on properties + properties_extension) + one-shot
backfill from property_details.listing_events for pre-trigger history.
Climate risk First Street
- Flood 1/10 Low FEMA zone X (unshaded) · 0% chance over 30 yrs
- Wildfire 8/10 Severe
- Heat 8/10 Severe 7 d/yr ≥106°F today · 19 d/yr by 30 yrs out
- Wind 1/10 Low
- Air quality 1/10 Low 0 unhealthy d/yr today · 0 by 30 yrs out
Nearby sold comps map
Loading sold comps map…
Walkable amenities ~0.75 mi
Loading nearby amenities…
Taxation est. · year 1
- Rental income
- $11,413
- − Mortgage interest
- −$3,221
- − Property taxes
- −$862
- − Insurance
- −$288
- − Repairs & maintenance
- −$913
- − Management
- −$913
- − Depreciation
- −$1,673
- Taxable income
- $3,543
- Est. tax owed @ 24.0%
- −$850
- After-tax cash flow
- $3,397/yr
For passive investors: Depreciation is non-cash, so a rental often shows a tax loss while cash-flowing — sheltering income. Rental losses are passive: they offset passive income freely, and up to $25,000/yr can offset ordinary (W-2) income if you actively participate and your MAGI is under $100k (phasing out to $0 by $150k); unused losses carry forward. On sale, claimed depreciation is recaptured at up to 25%, and gains may owe capital-gains tax (a 1031 exchange can defer both). Figures are a year-1 estimate at your 24.0% rate — not tax advice; consult a CPA.
Condition & rehab AI · 30 photos
This fully furnished 1-bedroom, 1-bath manufactured home in Western Way RV Resort is in good condition with a good condition score of 80. It offers a covered deck and patio area, and is located in a community with various amenities. The home is ready for immediate occupancy and can be enhanced with some cosmetic updates to further increase its value.
Value-add opportunities
- Both Paint the exterior siding — Painting the exterior siding can enhance the curb appeal and increase the home's value.
- Both Replace the ceiling tiles in the living area — Replacing the ceiling tiles can improve the home's appearance and increase its value.
- Rental Clean the air filters — A clean HVAC system can improve air quality and reduce energy costs, making it more attractive to renters.
Renovation cost estimate screening
Value-add ROI direction
- Both Paint the exterior siding — Painting the exterior siding can enhance the curb appeal and increase the home's value. ↑
- Both Replace the ceiling tiles in the living area — Replacing the ceiling tiles can improve the home's appearance and increase its value. ↑
- Rental Clean the air filters — A clean HVAC system can improve air quality and reduce energy costs, making it more attractive to renters. ↑
ⓘ Cost ranges are severity-bucket heuristics (US national rule-of-thumb). Get contractor quotes + a written scope before underwriting a rehab budget.
Schools (NCES district)
- District
- Tucson Unified District (4403)
- NCES district ID
- 0408800
- Math proficiency
- 14% ▼ -17.00%
- Reading proficiency
- 23% ▼ -11.00%
- Median HH income
- $40,962
- Composite
- 15.78/100
- National rank
- #9270
- State rank
- #190 of 249 in AZ
Livability — Tucson Estates
- Score
- 62/100
- State rank
- #137
- US rank
- #16650
Category grades
Schools grade is shown separately in the Schools card above.
Census & demographics
- Census place
- Tucson Estates, AZ
- County
- Pima County · 1,012,107 people
- Metro
- Tucson, AZ
- Population (ZIP)
- 46,439
- Household income
- $53,152
- Rent vs Own
- Severe rent burden
- 1517.0
Population outlook (Pima County) Hauer SSP2
- Today (2025)
- 1,066,056 people
- By 2030
- 1,086,684 · +1.9%
- By 2040
- 1,117,160 · +4.8%
- By 2050
- 1,149,778 · +7.9%
- By 2075
- 1,271,480 · +19.3%
- By 2100
- 1,321,160 · +23.9%
Race, ethnicity, and origin ACS 2023
- Neighborhood character
- Predominantly Hispanic (70%)
- Race & ethnicity
- Hispanic / Latino 70% Two or more races 30% White 21% Native American 5% Black 3% Asian 1%
- Hispanic origin (detail)
- Mexican 67%
- Common ancestry
- Italian 1% Lithuanian 1% Portuguese 1%
- Foreign-born
- 19% · Canada, China
- Languages at home
- 49% English-only · Spanish 49%
Political lean MEDSL · Pima
- 2024 margin
- D (+15.2) · D 57.0% · R 41.8% · Other 1.2%
- 2008→2024 swing
- +9.1pp toward D · 2008: 6.1pp · 2024: 15.2pp
- All cycles
- 2024: D+15.2 2020: D+18.7 2016: D+13.5 2012: D+5.8 2008: D+6.1
Not yet ingested
- Civics
- —
Market trends
- HPI YoY
- ▼ -107.07%
- Current HPI
- 329.8338
- Rent YoY
- ▲ 0.21%
- Metro
- Tucson, AZ
- State GDP YoY
- ▲ 4.54%
- F500 in state
- 20
Industry mix (Fortune 500 HQ in AZ)
| Industry | F500 HQs | Revenue |
|---|---|---|
| Technology | 2 | $13B |
|
||
| Mining / Metals | 1 | $23B |
|
||
| Environmental Services | 1 | $16B |
|
||
| Metals / Steel | 1 | $14B |
|
||
| Technology Distribution | 1 | $9B |
|
||
| Homebuilding | 1 | $8B |
|
||
Price history
1 event — show timeline
- 2026-05-05 Listed $57,500 MLSSAZ
Cash-flow waterfall
monthlySold comps — $/sqft
last 12 mo · ≤1 miLoading sold comps…